Baldwin Park, CA (California) Houses and Residents
| Baldwin Park: | $581,600 |
| California: | $715,900 |
Mean price in 2022:
Detached houses: $572,866
Here: $572,866 State: $988,808 Townhouses or other attached units: $436,207
Here: $436,207 State: $838,546 In 3-to-4-unit structures: $303,047
Here: $303,047 State: $824,253 In 5-or-more-unit structures: $400,851
Here: $400,851 State: $730,996 Mobile homes: $374,780
Here: $374,780 State: $184,506
Total population: 77,119 (Urban population: 75,753, Rural population: 0)
Houses: 19,165 (18,778 occupied: 10,287 owner occupied, 8,491 renter occupied)
| % of renters here: | 45% |
| State: | 44% |
Housing density: 2,876 houses/condos per square mile
Median price asked for vacant for-sale houses and condos in 2022: $593,241.
Median contract rent in 2022: $1,565 (lower quartile is $1,267, upper quartile is $1,932)
Median rent asked for vacant for-rent units in 2022: $2,106
Median gross rent in Baldwin Park, CA in 2022: $1,740
Housing units in Baldwin Park with a mortgage: 7,174 (544 second mortgage, 47 home equity loan, 288 both second mortgage and home equity loan)
Houses without a mortgage: 49
Median household income for houses/condos with a mortgage: $84,118
Median household income for apartments without a mortgage: $53,891
Median monthly housing costs: $1,702
Compare current foreclosures in Baldwin Park, CA:
| Photo | Address | Area | Beds / Baths | Price | Details |
|---|---|---|---|---|---|

|
#1
Millbury Ave
Baldwin Park, CA 91706
|
1,632 sq. feet
|
2 baths 4 beds |
$850,000
|
show details |

|
#2
Park Ave
Baldwin Park, CA 91706
|
2,452 sq. feet
|
4 baths 7 beds |
show details | |

|
#3
Van Wig Ave
Baldwin Park, CA 91706
|
1,330 sq. feet
|
2 baths 3 beds |
show details | |

|
#4
Wimmer Ave
Baldwin Park, CA 91706
|
765 sq. feet
|
1 baths 2 beds |
show details | |

|
#5
Chelsfield St
Baldwin Park, CA 91706
|
1,160 sq. feet
|
1 baths 2 beds |
show details | |

|
#6
Benham Ave
Baldwin Park, CA 91706
|
1,240 sq. feet
|
1 baths 3 beds |
show details | |

|
#7
Hornbrook Ave
Baldwin Park, CA 91706
|
2,067 sq. feet
|
2 baths 3 beds |
show details | |

|
#8
Earl Ave
Baldwin Park, CA 91706
|
1,057 sq. feet
|
2 baths 3 beds |
show details | |

|
#9
Merced Ave
Baldwin Park, CA 91706
|
1,412 sq. feet
|
2 baths 3 beds |
show details | |

|
#10
Wimmer Ave
Baldwin Park, CA 91706
|
855 sq. feet
|
1 baths 2 beds |
show details |
| Photo | Address | Area | Beds / Baths | Price | Details |
|---|---|---|---|---|---|

|
#11
Maine Ave
Baldwin Park, CA 91706
|
1,125 sq. feet
|
1 baths 3 beds |
show details | |

|
#12
Fountain Villas Ct
Baldwin Park, CA 91706
|
1,330 sq. feet
|
2 baths 3 beds |
show details | |

|
#13
Ramona Blvd
Baldwin Park, CA 91706
|
1,680 sq. feet
|
2 baths 4 beds |
show details | |

|
#14
Lozano Dr
Baldwin Park, CA 91706
|
2,030 sq. feet
|
3 baths 4 beds |
show details | |

|
#15
Francisquito Av E
Baldwin Park, CA 91706
|
1,342 sq. feet
|
3 baths 3 beds |
show details | |

|
#16
Francisquito Ave
Baldwin Park, CA 91706
|
1,135 sq. feet
|
2 baths 3 beds |
show details | |

|
#17
Kenmore Ave
Baldwin Park, CA 91706
|
1,248 sq. feet
|
2 baths 3 beds |
show details | |

|
#18
Waco St
Baldwin Park, CA 91706
|
1,386 sq. feet
|
2 baths 3 beds |
show details | |

|
#19
Wimmer Ave
Baldwin Park, CA 91706
|
855 sq. feet
|
1 baths 2 beds |
show details | |

|
#20
Channing St
Baldwin Park, CA 91706
|
1,128 sq. feet
|
2 baths 3 beds |
show details |
| Photo | Address | Area | Beds / Baths | Price | Details |
|---|---|---|---|---|---|

|
#21
Dalewood St
Baldwin Park, CA 91706
|
1,509 sq. feet
|
3 baths 4 beds |
show details | |

|
#22
Filhurst Ave
Baldwin Park, CA 91706
|
1,120 sq. feet
|
1 baths 3 beds |
show details | |

|
#23
Robinette Ave
Baldwin Park, CA 91706
|
982 sq. feet
|
3 baths 6 beds |
show details | |

|
#24
Cosbey Ave
Baldwin Park, CA 91706
|
1,146 sq. feet
|
2 baths 3 beds |
show details | |

|
#25
Vineland Ave
Baldwin Park, CA 91706
|
1,078 sq. feet
|
2 baths 3 beds |
show details | |

|
#26
Merced Ave
Baldwin Park, CA 91706
|
2,340 sq. feet
|
3 baths 4 beds |
show details | |

|
#27
Hammond St
Baldwin Park, CA 91706
|
- sq. feet
|
- baths - beds |
show details | |

|
#28
Maine Ave Apt H
Baldwin Park, CA 91706
|
- sq. feet
|
- baths - beds |
show details | |

|
#29
Vineland Ave Apt 13
Baldwin Park, CA 91706
|
- sq. feet
|
- baths - beds |
show details | |

|
#30
Vineland Ave
Baldwin Park, CA 91706
|
- sq. feet
|
- baths - beds |
show details |
| Photo | Address | Area | Beds / Baths | Price | Details |
|---|---|---|---|---|---|

|
#31
Francisco Ave, Apt E
Baldwin Park, CA 91706
|
- sq. feet
|
- baths - beds |
show details | |

|
#32
Clark St Apt 308
Baldwin Park, CA 91706
|
- sq. feet
|
- baths - beds |
show details | |

|
#33
Grace Ave
Baldwin Park, CA 91706
|
- sq. feet
|
- baths - beds |
show details | |

|
#34
Puente Ave, Trlr 47
Baldwin Park, CA 91706
|
- sq. feet
|
- baths - beds |
show details | |

|
#35
Puente Ave, Trlr 3
Baldwin Park, CA 91706
|
- sq. feet
|
- baths - beds |
show details | |

|
#36
Cloverleaf Dr
Baldwin Park, CA 91706
|
- sq. feet
|
- baths - beds |
show details | |

|
Check over 1 million property listings on Foreclosure.com!
|
browse all offers | |||


Median year apartment built: 1969
Household type by relationship:
Households: 69,450- Male householders: 9,915 (1,275 living alone), Female householders: 8,863 (1,136 living alone)
8,776 spouses (8,659 opposite-sex spouses), 2,189 unmarried partners, (1,983 opposite-sex unmarried partners), 23,218 children (21,935 natural, 476 adopted, 807 stepchildren), 3,025 grandchildren, 2,411 brothers or sisters, 4,097 parents, 0 foster children, 4,636 other relatives, 1,765 non-relatives
- In group quarters: 555
Size of family households: 3,682 2-persons, 3,284 3-persons, 3,569 4-persons, 2,784 5-persons, 1,681 6-persons, 991 7-or-more-persons.
Size of nonfamily households: 2,411 1-person, 256 2-persons, 65 3-persons, 55 4-persons.
6,276 married couples with children.
4,481 single-parent households (2,394 men, 2,087 women).
19.9% of residents of Baldwin Park speak English at home.
59.8% of residents speak Spanish at home (57% speak English very well, 14% speak English well, 16% speak English not well, 14% don't speak English at all).
0.1% of residents speak other Indo-European language at home (35% speak English very well, 37% speak English well, 28% speak English not well).
19.0% of residents speak Asian or Pacific Island language at home (37% speak English very well, 23% speak English well, 26% speak English not well, 14% don't speak English at all).
0.2% of residents speak other language at home (53% speak English very well, 24% speak English well, 24% speak English not well).
Foreign born population: 29,304 (42.2%)
(53.0% of them are naturalized citizens)
| Here: | 5.2 |
| State: | 6.0 |
| Here: | 4.5 |
| State: | 3.9 |

- Bedrooms in owner-occupied houses and condos in Baldwin Park, California
- 198no bedroom
- 4351 bedroom
- 2,2592 bedrooms
- 5,3973 bedrooms
- 1,8154 bedrooms
- 1835+ bedrooms

- Bedrooms in renter-occupied apartments in Baldwin Park, California
- 622no bedroom
- 1,1111 bedroom
- 3,1482 bedrooms
- 2,6783 bedrooms
- 7094 bedrooms
- 2235+ bedrooms

- Cars and other vehicles available in Baldwin Park in owner-occupied houses/condos
- 345no vehicle
- 1,9491 vehicle
- 3,2902 vehicles
- 2,2783 vehicles
- 1,4574 vehicles
- 9685+ vehicles

- Cars and other vehicles available in Baldwin Park in renter-occupied apartments
- 286no vehicle
- 2,1061 vehicle
- 3,0302 vehicles
- 1,8623 vehicles
- 9584 vehicles
- 2495+ vehicles

- Rooms in owner-occupied houses in Baldwin Park, California
- 1401 room
- 1022 rooms
- 7293 rooms
- 2,0534 rooms
- 3,2005 rooms
- 2,9356 rooms
- 5777 rooms
- 5078 rooms
- 449+ rooms

- Rooms in renter-occupied apartments in Baldwin Park, California
- 3271 room
- 1632 rooms
- 1,3733 rooms
- 2,2354 rooms
- 3,0555 rooms
- 3536 rooms
- 6567 rooms
- 1918 rooms
- 1389+ rooms


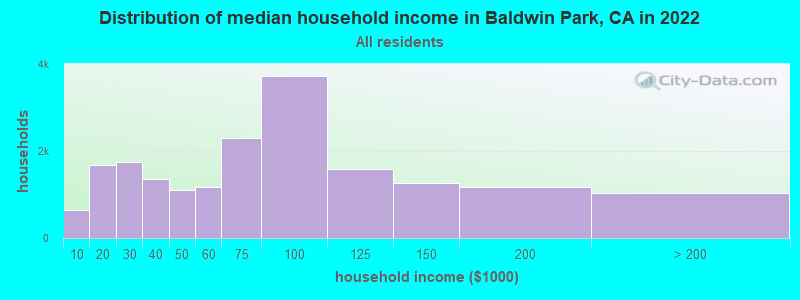
Baldwin Park, CA household income distribution

- 653Less than $10,000
- 1,670$10,000 to $19,999
- 1,753$20,000 to $29,999
- 1,359$30,000 to $39,999
- 1,104$40,000 to $49,999
- 1,167$50,000 to $59,999
- 2,309$60,000 to $74,999
- 3,715$75,000 to $99,999
- 1,586$100,000 to $124,999
- 1,261$125,000 to $149,999
- 1,165$150,000 to $199,999
- 1,036$200,000 or more
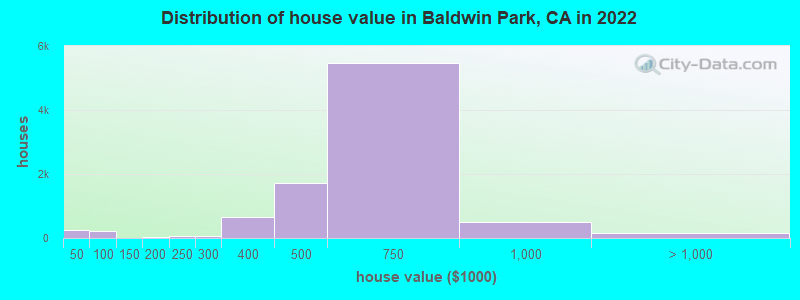
Home value of owner - occupied houses in 2022 in Baldwin Park, CA
-
- 166Less than $10,000
- 3$15,000 to $19,999
- 27$20,000 to $24,999
- 5$25,000 to $29,999
- 11$30,000 to $34,999
- 32$40,000 to $49,999
- 54$50,000 to $59,999
- 45$60,000 to $69,999
- 22$70,000 to $79,999
- 60$80,000 to $89,999
- 19$90,000 to $99,999
- 9$150,000 to $174,999
- 32$175,000 to $199,999
- 48$200,000 to $249,999
- 68$250,000 to $299,999
- 664$300,000 to $399,999
- 1,726$400,000 to $499,999
- 5,461$500,000 to $749,999
- 504$750,000 to $999,999
- 85$1,000,000 to $1,499,999
- 62$1,500,000 to $1,999,999
- 4$2,000,000 or more
Rent paid by renters in 2022 in Baldwin Park, CA
-
- 36Less than $100
- 109$200 to $249
- 75$250 to $299
- 48$300 to $349
- 63$400 to $449
- 27$450 to $499
- 65$500 to $549
- 23$550 to $599
- 12$600 to $649
- 35$650 to $699
- 13$700 to $749
- 10$750 to $799
- 117$800 to $899
- 218$900 to $999
- 781$1,000 to $1,249
- 1,212$1,250 to $1,499
- 3,019$1,500 to $1,999
- 998$2,000 to $2,499
- 239$2,500 to $2,999
- 79$3,000 to $3,499
- 11$3,500 or more
- 353No cash rent

Percentage of workers working in this county: 89.5%
Number of people working at home: 1,998 (6.0% of all workers)
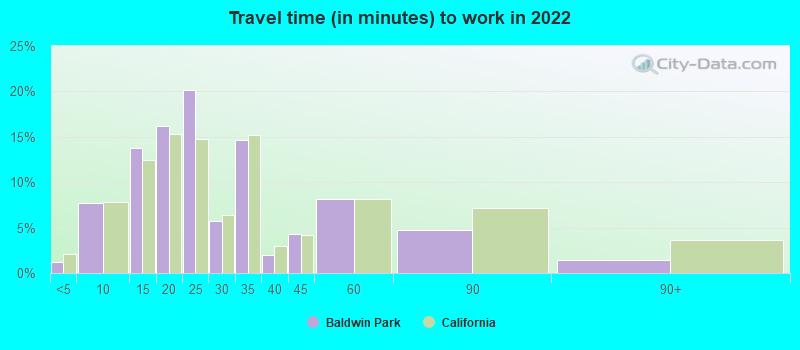
Travel time to work (commute)
- Less than 5 minutes: 247
- 5 to 9 minutes: 1,737
- 10 to 14 minutes: 4,869
- 15 to 19 minutes: 6,290
- 20 to 24 minutes: 3,779
- 25 to 29 minutes: 1,593
- 30 to 34 minutes: 4,035
- 35 to 39 minutes: 284
- 40 to 44 minutes: 1,344
- 45 to 59 minutes: 2,454
- 60 to 89 minutes: 2,751
- 90 or more minutes: 683
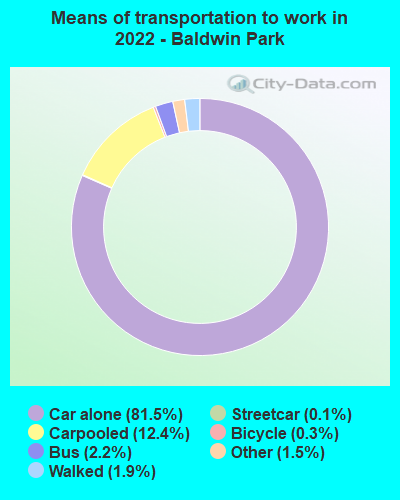
Means of transportation to work:
- Drove a car alone: 15,515 (71.8%)
- Carpooled: 2,612 (12.1%)
- Bus: 380 (1.8%)
- Subway or elevated rail: 18 (0.1%)
- Light rail, streetcar or trolley: 5 (0.0%)
- Taxi: 315 (1.5%)
- Bicycle: 62 (0.3%)
- Walked: 389 (1.8%)
- Worked at home: 1,998 (9.2%)
- Unemployment by race in 2022
- Unemployment rate for White non-Hispanic residents
- 0.5%Males
- 1.9%Females
- Unemployment rate for Black residents
- 3.4%Males
- 36.4%Females
- Unemployment rate for American Indian and Alaska Native residents
- 2.9%Males
- 5.8%Females
- Unemployment rate for Asian residents
- 4.6%Males
- 9.3%Females
- Unemployment rate for other race residents
- 4.1%Males
- 3.8%Females
- Unemployment rate for two or more race residents
- 3.6%Males
- 4.0%Females
- Unemployment rate for Hispanic or Latino residents
- 5.1%Males
- 4.8%Females

- Year of entry for the foreign-born population in Baldwin Park, California
- 3,9522010 or later
- 5,9102000 to 2009
- 6,9911990 to 1999
- 11,8291980 to 1989
- 9,2701970 to 1979
- 3,494Before 1970
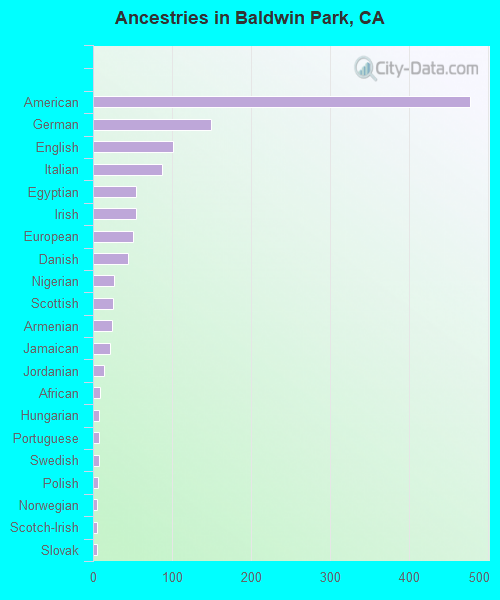
First ancestries reported:
- American: 478 (0.9%)
- German: 149 (0.3%)
- English: 101 (0.2%)
- Italian: 88 (0.2%)
- Egyptian: 55 (0.1%)
- Irish: 55 (0.1%)
- European: 51 (0.10%)
- Danish: 44 (0.09%)
- Nigerian: 26 (0.05%)
- Scottish: 25 (0.05%)
- Armenian: 24 (0.05%)
- Jamaican: 22 (0.04%)
- Jordanian: 14 (0.03%)
- African: 9 (0.02%)
- Hungarian: 8 (0.02%)
- Portuguese: 8 (0.02%)
- Swedish: 7 (0.01%)
- Polish: 6 (0.01%)
- Norwegian: 5 (0.01%)
- Scotch-Irish: 5 (0.01%)
- Slovak: 5 (0.01%)
- Scandinavian: 3 (0.01%)
Most common places of birth for foreign-born residents (%):
| Baldwin Park: | 50.3% (15,600) |
| California: | 37.2% (3,881,193) |
| Baldwin Park: | 12.1% (3,756) |
| California: | 6.6% (684,672) |
| Baldwin Park: | 9.7% (3,006) |
| California: | 4.9% (512,335) |
| Baldwin Park: | 6.7% (2,089) |
| California: | 7.8% (818,297) |
| Baldwin Park: | 5.7% (1,779) |
| California: | 4.2% (440,287) |
| Baldwin Park: | 3.0% (946) |
| California: | 2.8% (290,436) |
| Baldwin Park: | 1.7% (541) |
| California: | 0.6% (58,161) |
| Baldwin Park: | 1.6% (493) |
| California: | 1.7% (176,274) |
Place of birth for U.S.-born residents:
- This state: 37,618
- Other state: 1,746
- Northeast: 117
- Midwest: 184
- South: 851
- West: 594
96.1% of Baldwin Park residents lived in the same house 1 years ago.
Out of people who lived in different houses, 44.3% lived in this county.
Out of people who lived in different counties, 51.5% lived in California.
| Baldwin Park: | 96.1% |
| State average: | 88.9% |
Education attainment for males 25 years and older:
- No schooling: 2,011
- Nursery to 4th grade: 390
- 5th and 6th grade: 1,183
- 7th and 8th grade: 839
- 9th grade: 267
- 10th grade: 238
- 11th grade: 230
- 12th grade, no diploma: 1,833
- High school graduate (or equivalency): 7,399
- Less than 1 year of college: 510
- Some college more than 1 year, no degree: 2,592
- Associate degree: 1,191
- Bachelor's degree: 2,443
- Master's degree: 462
- Professional school degree: 134
- Doctorate degree: 97

Education attainment for females 25 years and older:
- No schooling: 2,427
- Nursery to 4th grade: 794
- 5th and 6th grade: 1,972
- 7th and 8th grade: 395
- 9th grade: 323
- 10th grade: 217
- 11th grade: 481
- 12th grade, no diploma: 981
- High school graduate (or equivalency): 6,740
- Less than 1 year of college: 769
- Some college more than 1 year, no degree: 3,927
- Associate degree: 1,181
- Bachelor's degree: 2,605
- Master's degree: 386
- Professional school degree: 263
- Doctorate degree: 44


Housing units in structures:
- One, detached: 13,016
- One, attached: 1,767
- Two: 140
- 3 or 4: 907
- 5 to 9: 290
- 10 to 19: 338
- 20 to 49: 1,346
- 50 or more: 951
- Mobile homes: 410
Median worth of mobile homes: $71,450
House/condo owner moved in on average 16 years ago
Renter moved in on average 8 years ago

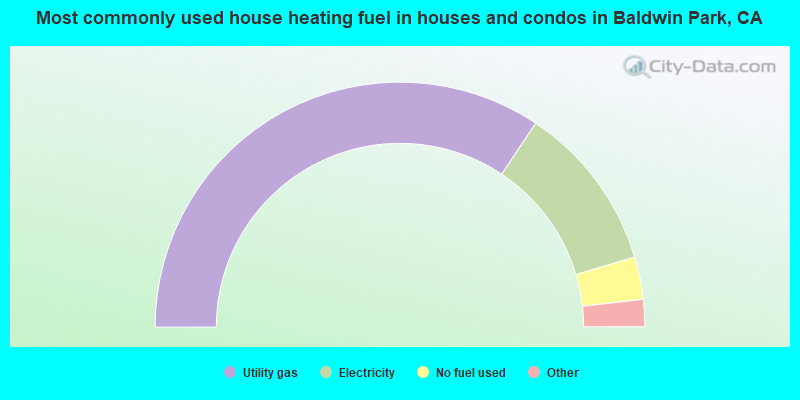
- 68.7%Utility gas
- 22.1%Electricity
- 5.6%No fuel used
- 1.9%Bottled, tank, or LP gas
- 1.1%Solar energy
- 0.4%Fuel oil, kerosene, etc.
- 0.1%Wood
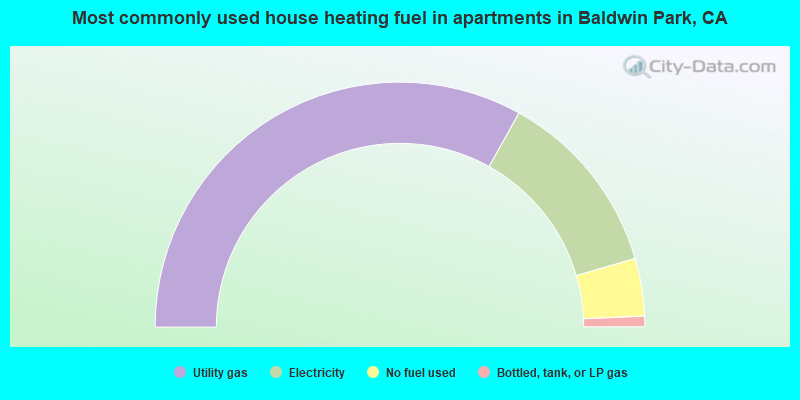
- 66.1%Utility gas
- 24.8%Electricity
- 7.6%No fuel used
- 1.4%Bottled, tank, or LP gas
Private vs. public school enrollment:
| Here: | 2.1% |
| California: | 10.5% |
| Here: | 2.4% |
| California: | 8.5% |
| Here: | 21.5% |
| California: | 15.9% |


