Baldwinville, MA (Massachusetts) Houses and Residents
| Baldwinville: | $292,856 |
| Massachusetts: | $534,700 |
Total population: 2,028 (Urban population: 1,488, Rural population: 371 (all nonfarm))
Houses: 882 (810 occupied: 715 owner occupied, 104 renter occupied)
| % of renters here: | 13% |
| State: | 38% |
Housing density: 356 houses/condos per square mile
Median price asked for vacant for-sale houses and condos in 2022 in this county: $182,682.
Median contract rent in 2022: $846 (lower quartile is $505, upper quartile is $1,049)
Median gross rent in Baldwinville, MA in 2022: $956
Housing units in Baldwinville with a mortgage: 535 (44 second mortgage, 0 home equity loan, 35 both second mortgage and home equity loan)
Houses without a mortgage: 267
Compare current foreclosures near Baldwinville, MA:
| Photo | Address | Area | Beds / Baths | Price | Details |
|---|---|---|---|---|---|

|
#1
Sunrise Dr
Baldwinville, MA 01436
|
- sq. feet
|
- baths - beds |
show details | |

|
#2
Baldwinville Rd
Baldwinville, MA 01436
|
- sq. feet
|
- baths - beds |
show details | |

|
#3
Elm St Apt A
Baldwinville, MA 01436
|
- sq. feet
|
- baths - beds |
show details | |

|
#4
Baldwin Dr
Baldwinville, MA 01436
|
- sq. feet
|
- baths - beds |
show details | |

|
#5
Pearl Hill Rd
Fitchburg, MA 01420
|
2,152 sq. feet
|
2 baths 3 beds |
$529,900
|
show details |

|
#6
Parker St
Gardner, MA 01440
|
1,980 sq. feet
|
2 baths 4 beds |
$469,900
|
show details |

|
#7
Iriquois Dr
Ashburnham, MA 01430
|
2,016 sq. feet
|
2 baths 3 beds |
$369,000
|
show details |

|
#8
Grove Ave
Leominster, MA 01453
|
3,097 sq. feet
|
1 baths 4 beds |
show details | |

|
#9
Garnet St
Fitchburg, MA 01420
|
6,112 sq. feet
|
5 baths 8 beds |
show details | |

|
#10
Pine Rd
Fitzwilliam, NH 03447
|
792 sq. feet
|
1 baths 2 beds |
show details |
| Photo | Address | Area | Beds / Baths | Price | Details |
|---|---|---|---|---|---|

|
#11
Russell Ave
Troy, NH 03465
|
2,046 sq. feet
|
1 baths 3 beds |
show details | |

|
#12
West Rd
Ashby, MA 01431
|
7,000 sq. feet
|
3 baths 10 beds |
show details | |

|
#13
N Main St, Unit A
Orange, MA 01364
|
598 sq. feet
|
1 baths 2 beds |
show details | |

|
#14
Ashburnham St
Fitchburg, MA 01420
|
2,095 sq. feet
|
1 baths 3 beds |
show details | |

|
#15
Maynard St
Orange, MA 01364
|
1,640 sq. feet
|
2 baths 3 beds |
show details | |

|
#16
Fairmount St
Fitchburg, MA 01420
|
1,456 sq. feet
|
1 baths 3 beds |
show details | |

|
#17
Lake Mattawa Rd
Orange, MA 01364
|
1,666 sq. feet
|
1 baths 3 beds |
show details | |

|
#18
Rindge Rd
Fitchburg, MA 01420
|
1,366 sq. feet
|
1 baths 3 beds |
show details | |

|
#19
Springhill Rd
Barre, MA 01005
|
1,075 sq. feet
|
1 baths 2 beds |
show details | |

|
#20
Shea St
Fitchburg, MA 01420
|
1,332 sq. feet
|
1 baths 2 beds |
show details |
| Photo | Address | Area | Beds / Baths | Price | Details |
|---|---|---|---|---|---|

|
#21
Gatehouse Rd
Westminster, MA 01473
|
1,118 sq. feet
|
1 baths 2 beds |
show details | |

|
#22
Clarendon St
Fitchburg, MA 01420
|
2,488 sq. feet
|
2 baths 4 beds |
show details | |

|
#23
Pratt St
Fitchburg, MA 01420
|
862 sq. feet
|
1 baths 2 beds |
show details | |

|
#24
Old Dana Rd
Barre, MA 01005
|
1,255 sq. feet
|
1 baths 3 beds |
show details | |

|
#25
Lionel Ave
Fitchburg, MA 01420
|
1,302 sq. feet
|
1 baths 3 beds |
show details | |

|
#26
Ashburnham St
Fitchburg, MA 01420
|
1,120 sq. feet
|
1 baths 3 beds |
show details | |

|
#27
Old New Ipswich Rd
Rindge, NH 03461
|
1,184 sq. feet
|
2 baths 3 beds |
show details | |

|
#28
Healdville Rd
Hubbardston, MA 01452
|
936 sq. feet
|
1 baths 2 beds |
show details | |

|
#29
Daniel Shays Hwy
Athol, MA 01331
|
1,736 sq. feet
|
2 baths 4 beds |
show details | |

|
#30
Lord Brook Rd
Rindge, NH 03461
|
1,920 sq. feet
|
1 baths 3 beds |
show details |
| Photo | Address | Area | Beds / Baths | Price | Details |
|---|---|---|---|---|---|

|
#31
Prescott Ln
Orange, MA 01364
|
2,064 sq. feet
|
2 baths 3 beds |
show details | |

|
#32
East Rd
Orange, MA 01364
|
960 sq. feet
|
1 baths 3 beds |
show details | |

|
#33
Rogers Ave
Orange, MA 01364
|
1,296 sq. feet
|
1 baths 3 beds |
show details | |

|
#34
White Pond Rd
Athol, MA 01331
|
2,340 sq. feet
|
2 baths 5 beds |
show details | |

|
#35
Rebanna Rd
Westminster, MA 01473
|
3,313 sq. feet
|
2 baths 4 beds |
show details | |

|
#36
E River St
Orange, MA 01364
|
1,332 sq. feet
|
1 baths 3 beds |
show details | |

|
#37
Taggart Cir
Rindge, NH 03461
|
1,488 sq. feet
|
1 baths 3 beds |
show details | |

|
#38
Crestview Ln
Westminster, MA 01473
|
1,100 sq. feet
|
1 baths 2 beds |
show details | |

|
#39
Fitzgerald Rd
Rindge, NH 03461
|
3,960 sq. feet
|
3 baths 4 beds |
show details | |

|
#40
Eddy St
Orange, MA 01364
|
1,116 sq. feet
|
1 baths 2 beds |
show details |
| Photo | Address | Area | Beds / Baths | Price | Details |
|---|---|---|---|---|---|

|
#41
Ashburnham St
Fitchburg, MA 01420
|
1,120 sq. feet
|
1 baths 3 beds |
show details | |

|
#42
Ashburnham St
Fitchburg, MA 01420
|
1,120 sq. feet
|
1 baths 3 beds |
show details | |

|
#43
Mallard Dr # 59
Fitchburg, MA 01420
|
1,093 sq. feet
|
1 baths 2 beds |
show details | |

|
#44
South St
Fitchburg, MA 01420
|
3,987 sq. feet
|
2 baths 7 beds |
show details | |

|
#45
South St
Fitchburg, MA 01420
|
1,934 sq. feet
|
2 baths 4 beds |
show details | |

|
#46
Kendall Hill Rd
Ashby, MA 01431
|
2,852 sq. feet
|
2 baths 4 beds |
show details | |

|
#47
Hall St
Leominster, MA 01453
|
3,724 sq. feet
|
3 baths 5 beds |
show details | |

|
#48
Patton St
Fitchburg, MA 01420
|
1,271 sq. feet
|
1 baths 3 beds |
show details | |

|
#49
White St
Lunenburg, MA 01462
|
1,158 sq. feet
|
1 baths 2 beds |
show details | |

|
Check over 1 million property listings on Foreclosure.com!
|
browse all offers | |||

Latest news about housing in Baldwinville, MA collected exclusively by city-data.com from local newspapers, TV, and radio stations

 | Biggest population gain during COVID: Plymouth!? check how your town did (26 replies) |
| Hubbardston vs Templeton MA (5 replies) |
| Affordable country areas between Templeton and Fitchburg, Mass (25 replies) |

Median year apartment built: 1947
Household type by relationship:
Households: 2,296- Male householders: 447 (73 living alone), Female householders: 357 (149 living alone)
307 spouses (284 opposite-sex spouses), 211 unmarried partners, (211 opposite-sex unmarried partners), 843 children (700 natural, 0 adopted, 143 stepchildren), 12 grandchildren, 0 brothers or sisters, 0 parents, 0 foster children, 0 other relatives, 29 non-relatives
- In group quarters: 87
Size of family households: 186 2-persons, 51 3-persons, 58 4-persons, 182 5-persons, 17 7-or-more-persons.
Size of nonfamily households: 230 1-person, 78 2-persons.
300 married couples with children.
524 single-parent households (501 men, 23 women).
97.4% of residents of Baldwinville speak English at home.
0.5% of residents speak Spanish at home (100% speak English very well).
1.1% of residents speak other Indo-European language at home (100% speak English very well).
Foreign born population: 45 (2.0%)
(48.9% of them are naturalized citizens)
| Here: | 6.5 |
| State: | 6.5 |
| Here: | 3.4 |
| State: | 4.0 |

- Bedrooms in owner-occupied houses and condos in Baldwinville, Massachusetts
- 0no bedroom
- 01 bedroom
- 1632 bedrooms
- 2543 bedrooms
- 2474 bedrooms
- 525+ bedrooms

- Bedrooms in renter-occupied apartments in Baldwinville, Massachusetts
- 0no bedroom
- 661 bedroom
- 392 bedrooms
- 03 bedrooms
- 04 bedrooms
- 05+ bedrooms

- Cars and other vehicles available in Baldwinville in owner-occupied houses/condos
- 10no vehicle
- 3901 vehicle
- 2592 vehicles
- 393 vehicles
- 174 vehicles
- 05+ vehicles

- Cars and other vehicles available in Baldwinville in renter-occupied apartments
- 12no vehicle
- 681 vehicle
- 252 vehicles
- 03 vehicles
- 04 vehicles
- 05+ vehicles

- Rooms in owner-occupied houses in Baldwinville, Massachusetts
- 01 room
- 02 rooms
- 03 rooms
- 884 rooms
- 1245 rooms
- 1376 rooms
- 787 rooms
- 1638 rooms
- 1269+ rooms

- Rooms in renter-occupied apartments in Baldwinville, Massachusetts
- 01 room
- 02 rooms
- 663 rooms
- 254 rooms
- 145 rooms
- 06 rooms
- 07 rooms
- 08 rooms
- 09+ rooms


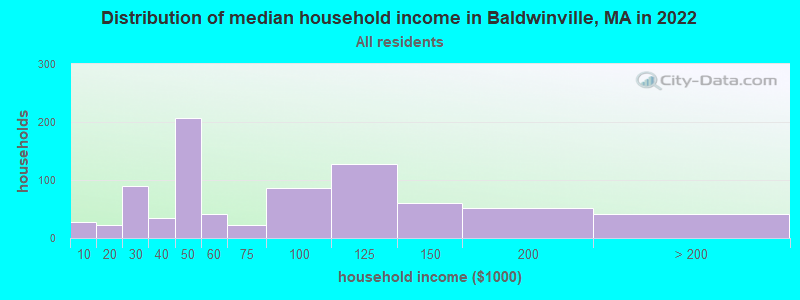
Baldwinville, MA household income distribution

- 27Less than $10,000
- 22$10,000 to $19,999
- 89$20,000 to $29,999
- 35$30,000 to $39,999
- 207$40,000 to $49,999
- 41$50,000 to $59,999
- 22$60,000 to $74,999
- 87$75,000 to $99,999
- 127$100,000 to $124,999
- 61$125,000 to $149,999
- 51$150,000 to $199,999
- 42$200,000 or more
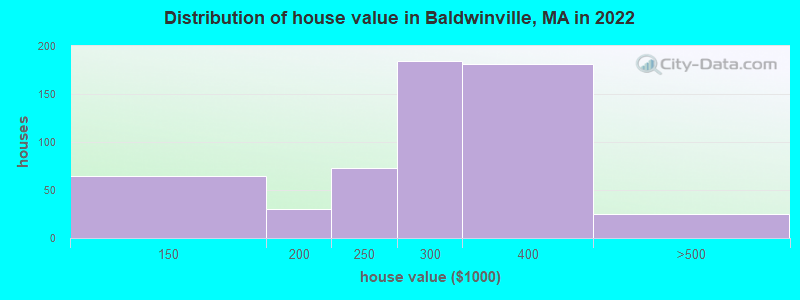
Home value of owner - occupied houses in 2022 in Baldwinville, MA
-
- 25$100,000 to $124,999
- 39$125,000 to $149,999
- 11$150,000 to $174,999
- 18$175,000 to $199,999
- 72$200,000 to $249,999
- 184$250,000 to $299,999
- 181$300,000 to $399,999
- 24$400,000 to $499,999
Rent paid by renters in 2022 in Baldwinville, MA
-
- 19$350 to $399
- 11$450 to $499
- 13$600 to $649
- 14$800 to $899
- 15$900 to $999
- 27$1,000 to $1,249


Percentage of workers working in this county: 83.6%
Number of people working at home: 118 (16.5% of all workers)
Travel time to work (commute)
- Less than 5 minutes: 16
- 5 to 9 minutes: 27
- 10 to 14 minutes: 158
- 15 to 19 minutes: 40
- 20 to 24 minutes: 24
- 25 to 29 minutes: 61
- 30 to 34 minutes: 65
- 35 to 39 minutes: 0
- 40 to 44 minutes: 14
- 45 to 59 minutes: 104
- 60 to 89 minutes: 74
- 90 or more minutes: 9
Means of transportation to work:
- Drove a car alone: 681 (84.5%)
- Carpooled: 64 (7.9%)
- Walked: 12 (1.5%)
- Other means: 34 (4.2%)
- Worked at home: 15 (1.9%)

- Unemployment by race in 2022
- Unemployment rate for White non-Hispanic residents
- 32.3%Males
- 4.5%Females

- Year of entry for the foreign-born population in Baldwinville, Massachusetts
- 272010 or later
- 02000 to 2009
- 11990 to 1999
- 01980 to 1989
- 111970 to 1979
- 6Before 1970

First ancestries reported:
- American: 680 (64.2%)
- French Canadian: 58 (5.5%)
- Irish: 54 (5.1%)
- Scotch-Irish: 44 (4.2%)
- Polish: 39 (3.7%)
- French: 29 (2.7%)
- Swedish: 15 (1.4%)
- British: 14 (1.3%)
- Italian: 13 (1.2%)
Most common places of birth for foreign-born residents (%):
| Baldwinville: | 37.8% (17) |
| Massachusetts: | 1.0% (12,709) |
| Baldwinville: | 37.8% (17) |
| Massachusetts: | 2.3% (28,158) |
Place of birth for U.S.-born residents:
- This state: 1,896
- Other state: 324
- Northeast: 148
- Midwest: 19
- South: 49
- West: 106
96.0% of Baldwinville residents lived in the same house 1 years ago.
Out of people who lived in different houses, 48.8% lived in this county.
| Baldwinville: | 96.0% |
| State average: | 87.7% |
Education attainment for males 25 years and older:
- No schooling: 0
- Nursery to 4th grade: 0
- 5th and 6th grade: 0
- 7th and 8th grade: 180
- 9th grade: 7
- 10th grade: 0
- 11th grade: 31
- 12th grade, no diploma: 39
- High school graduate (or equivalency): 204
- Less than 1 year of college: 25
- Some college more than 1 year, no degree: 93
- Associate degree: 32
- Bachelor's degree: 86
- Master's degree: 47
- Professional school degree: 16
- Doctorate degree: 0

Education attainment for females 25 years and older:
- No schooling: 12
- Nursery to 4th grade: 0
- 5th and 6th grade: 0
- 7th and 8th grade: 0
- 9th grade: 0
- 10th grade: 0
- 11th grade: 15
- 12th grade, no diploma: 18
- High school graduate (or equivalency): 158
- Less than 1 year of college: 75
- Some college more than 1 year, no degree: 106
- Associate degree: 97
- Bachelor's degree: 186
- Master's degree: 68
- Professional school degree: 0
- Doctorate degree: 0


Housing units in structures:
- One, detached: 625
- One, attached: 78
- Two: 92
- 3 or 4: 53
- 5 to 9: 12
- 20 to 49: 20
House/condo owner moved in on average 14 years ago
Renter moved in on average 7 years ago


- 60.8%Fuel oil, kerosene, etc.
- 27.8%Wood
- 5.4%Utility gas
- 3.6%Bottled, tank, or LP gas
- 2.4%Other fuel
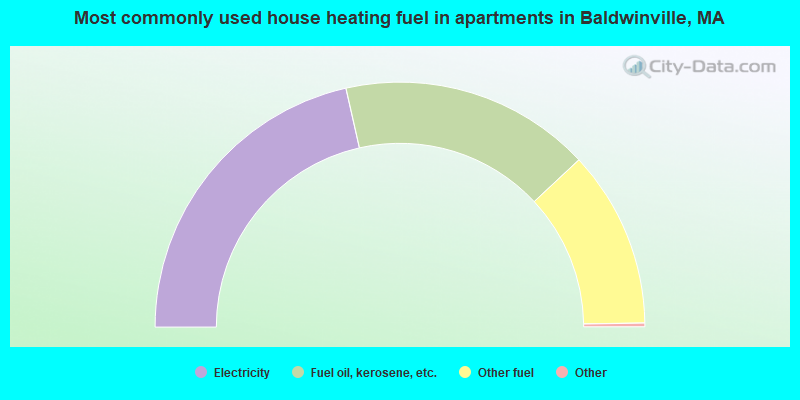
- 43.1%Electricity
- 33.3%Fuel oil, kerosene, etc.
- 23.5%Other fuel
Private vs. public school enrollment:
| Here: | 18.2% |
| Massachusetts: | 10.3% |
| Here: | 2.3% |
| Massachusetts: | 51.2% |


