Jump to a detailed profile or search site with Google Custom Search

Banning, CA (California) Houses and Residents

Estimated median house or condo value in 2022: $356,709 (it was $97,300 in 2000)
Banning:

$356,709
California:

$715,900
Lower value quartile - upper value quartile: $254,126 - $421,072

Mean price in 2022:

Detached houses: $412,760
Here:

$412,760
State:

$988,808

Townhouses or other attached units: $257,921
Here:

$257,921
State:

$838,546

Mobile homes: $66,298
Here:

$66,298
State:

$184,506

Total population: 30,769 (Urban population: 22,735, Rural population: 708 (all nonfarm))

Houses: 12,214 (11,281 occupied: 8,094 owner occupied, 3,262 renter occupied)

% of renters here:

29%
State:

44%

Housing density: 530 houses/condos per square mile

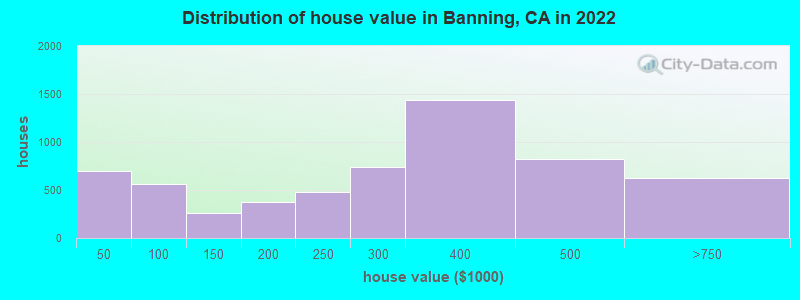
Median price asked for vacant for-sale houses and condos in 2022: $531,186.

Median contract rent in 2022: $1,186 (lower quartile is $842, upper quartile is $1,610)


Median rent asked for vacant for-rent units in 2022: $2,794


Median gross rent in Banning, CA in 2022: $1,446

Housing units in Banning with a mortgage: 4,045 (174 second mortgage, 0 home equity loan, 166 both second mortgage and home equity loan)
Houses without a mortgage: 108

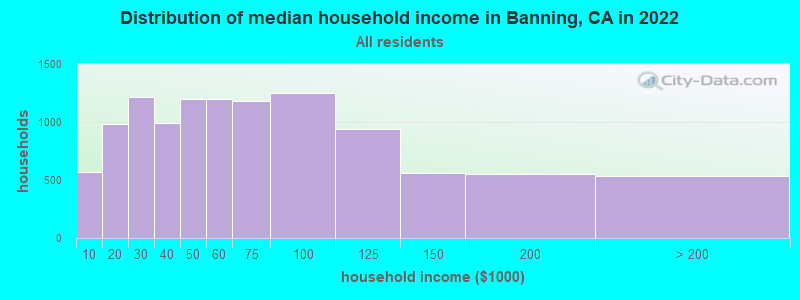
Median household income for houses/condos with a mortgage: $74,188

Median household income for apartments without a mortgage: $49,391

Median monthly housing costs: $1,198

Compare current foreclosures in Banning, CA:

Check out more offers in Banning, CA.
Powered by Foreclosure.com

Settings
X
Data:
Loading data...
Based on 2000-2022 data
Loading data...

123
Hide US histogram

Latest news about housing in Banning, CA collected exclusively by city-data.com from local newspapers, TV, and radio stations

Banning, California Age and Sex of Residents
Median year house/condo built: 1983

Median year apartment built: 1978

Household type by relationship:

Households: 30,476
  • Male householders: 5,296 (1,078 living alone), Female householders: 5,975 (1,863 living alone)
  • 5,003 spouses (4,949 opposite-sex spouses), 746 unmarried partners, (721 opposite-sex unmarried partners), 8,915 children (8,456 natural, 256 adopted, 201 stepchildren), 1,514 grandchildren, 363 brothers or sisters, 523 parents, 0 foster children, 1,090 other relatives, 714 non-relatives
  • In group quarters: 332

Size of family households: 3,614 2-persons, 1,505 3-persons, 1,379 4-persons, 623 5-persons, 395 6-persons, 235 7-or-more-persons.

Size of nonfamily households: 2,851 1-person, 600 2-persons, 74 3-persons.

2,736 married couples with children.
2,501 single-parent households (701 men, 1,800 women).

62.0% of residents of Banning speak English at home.
31.6% of residents speak Spanish at home (68% speak English very well, 17% speak English well, 12% speak English not well, 2% don't speak English at all).
2.6% of residents speak other Indo-European language at home (67% speak English very well, 12% speak English well, 21% speak English not well).
3.4% of residents speak Asian or Pacific Island language at home (42% speak English very well, 35% speak English well, 22% speak English not well, 1% don't speak English at all).
0.5% of residents speak other language at home (73% speak English very well, 27% speak English well).

Foreign born population: 5,703 (18.7%)
(52.6% of them are naturalized citizens)

Median number of rooms in houses and condos:
Here:

5.1
State:

6.0

Median number of rooms in apartments
Here:

4.4
State:

3.9

Owner-occupied Renter-occupied
Bedrooms in owner-occupied houses and condos in Banning, California
  • Bedrooms in owner-occupied houses and condos in Banning, California
  • 45no bedroom
  • 961 bedroom
  • 4,0582 bedrooms
  • 2,8593 bedrooms
  • 9034 bedrooms
  • 1325+ bedrooms
Bedrooms in renter-occupied apartments in Banning, California
  • Bedrooms in renter-occupied apartments in Banning, California
  • 148no bedroom
  • 4351 bedroom
  • 1,5642 bedrooms
  • 8543 bedrooms
  • 1864 bedrooms
  • 775+ bedrooms
Owner-occupied Renter-occupied
Cars and other vehicles available in Banning in owner-occupied houses/condos
  • Cars and other vehicles available in Banning in owner-occupied houses/condos
  • 416no vehicle
  • 3,0471 vehicle
  • 2,7492 vehicles
  • 1,1983 vehicles
  • 4154 vehicles
  • 2705+ vehicles
Cars and other vehicles available in Banning in renter-occupied apartments
  • Cars and other vehicles available in Banning in renter-occupied apartments
  • 384no vehicle
  • 1,2601 vehicle
  • 1,1482 vehicles
  • 2863 vehicles
  • 1414 vehicles
  • 445+ vehicles
Owner-occupied Renter-occupied
Rooms in owner-occupied houses in Banning, California
  • Rooms in owner-occupied houses in Banning, California
  • 181 room
  • 662 rooms
  • 2363 rooms
  • 1,9024 rooms
  • 2,4355 rooms
  • 1,5436 rooms
  • 1,0147 rooms
  • 6028 rooms
  • 2789+ rooms
Rooms in renter-occupied apartments in Banning, California
  • Rooms in renter-occupied apartments in Banning, California
  • 1371 room
  • 1672 rooms
  • 5093 rooms
  • 8814 rooms
  • 6865 rooms
  • 3636 rooms
  • 1357 rooms
  • 2478 rooms
  • 1359+ rooms
Year house built
Median 2022 house/condo value by year built
Median house/condo value by year householder moved into unit
Breakdown of mean house values by ages of householders
Owners and renters by unit type in Banning, CA
  • Banning, CA household income distribution

  • Distribution of median household income in Banning, CA in 2022
  • 566Less than $10,000
  • 987$10,000 to $19,999
  • 1,218$20,000 to $29,999
  • 995$30,000 to $39,999
  • 1,198$40,000 to $49,999
  • 1,199$50,000 to $59,999
  • 1,178$60,000 to $74,999
  • 1,253$75,000 to $99,999
  • 942$100,000 to $124,999
  • 560$125,000 to $149,999
  • 549$150,000 to $199,999
  • 533$200,000 or more
  • Home value of owner - occupied houses in 2022 in Banning, CA

  • Distribution of house value in Banning, CA in 2022
  • 125Less than $10,000
  • 49$10,000 to $14,999
  • 66$15,000 to $19,999
  • 34$20,000 to $24,999
  • 126$25,000 to $29,999
  • 48$35,000 to $39,999
  • 244$40,000 to $49,999
  • 124$50,000 to $59,999
  • 39$60,000 to $69,999
  • 86$70,000 to $79,999
  • 15$80,000 to $89,999
  • 47$90,000 to $99,999
  • 230$100,000 to $124,999
  • 29$125,000 to $149,999
  • 235$150,000 to $174,999
  • 138$175,000 to $199,999
  • 477$200,000 to $249,999
  • 735$250,000 to $299,999
  • 1,436$300,000 to $399,999
  • 825$400,000 to $499,999
  • 597$500,000 to $749,999
  • 26$1,000,000 to $1,499,999
  • Rent paid by renters in 2022 in Banning, CA

  • Distribution of rent paid by renters in Banning, CA in 2022
  • 7$100 to $149
  • 160$200 to $249
  • 58$300 to $349
  • 55$350 to $399
  • 19$400 to $449
  • 17$450 to $499
  • 146$500 to $549
  • 38$550 to $599
  • 28$600 to $649
  • 27$650 to $699
  • 159$700 to $749
  • 43$750 to $799
  • 210$800 to $899
  • 187$900 to $999
  • 770$1,000 to $1,249
  • 337$1,250 to $1,499
  • 590$1,500 to $1,999
  • 132$2,000 to $2,499
  • 84$2,500 to $2,999
  • 48$3,500 or more
  • 90No cash rent
Time Leaving Home To Go To Work in 2022

Percentage of workers working in this county: 75.1%
Number of people working at home: 783 (7.1% of all workers)

Travel time (in minutes) to work in 2022

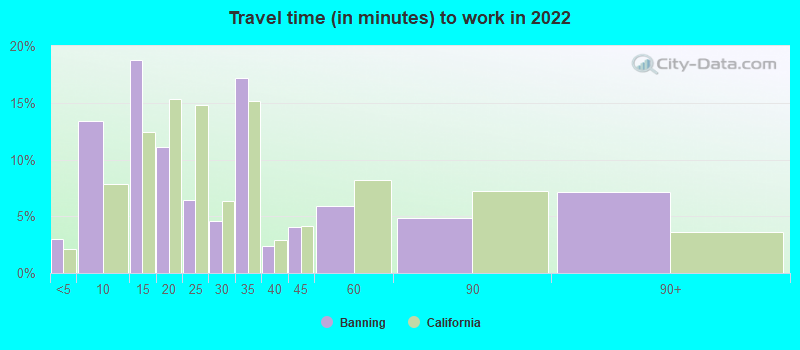
Travel time to work (commute)

  • Less than 5 minutes: 297
  • 5 to 9 minutes: 1,373
  • 10 to 14 minutes: 1,786
  • 15 to 19 minutes: 1,000
  • 20 to 24 minutes: 662
  • 25 to 29 minutes: 442
  • 30 to 34 minutes: 1,331
  • 35 to 39 minutes: 426
  • 40 to 44 minutes: 773
  • 45 to 59 minutes: 924
  • 60 to 89 minutes: 568
  • 90 or more minutes: 457
Means of transportation to work in 2022 - Banning

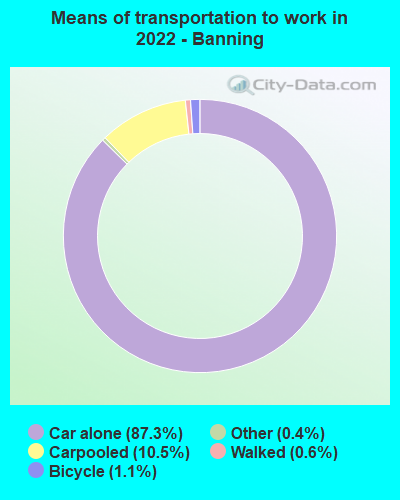
Means of transportation to work:

  • Drove a car alone: 6,426 (77.4%)
  • Carpooled: 839 (10.1%)
  • Bus: 5 (0.1%)
  • Taxi: 28 (0.3%)
  • Bicycle: 110 (1.3%)
  • Walked: 47 (0.6%)
  • Worked at home: 783 (9.4%)
Class of Workers in 2022
  • Unemployment by race in 2022
  • Unemployment rate for White non-Hispanic residents
  • 6.2%Males
  • 1.8%Females
  • Unemployment rate for Black residents
  • 1.3%Males
  • 19.3%Females
  • Unemployment rate for American Indian and Alaska Native residents
  • 15.5%Females
  • Unemployment rate for Asian residents
  • 15.7%Males
  • 3.2%Females
  • Unemployment rate for other race residents
  • 4.4%Males
  • 3.9%Females
  • Unemployment rate for two or more race residents
  • 7.2%Males
  • 5.9%Females
  • Unemployment rate for Hispanic or Latino residents
  • 6.7%Males
  • 7.0%Females
Year of entry for the foreign-born population in Banning, California
  • Year of entry for the foreign-born population in Banning, California
  • 7772010 or later
  • 1,4312000 to 2009
  • 1,0521990 to 1999
  • 8911980 to 1989
  • 5991970 to 1979
  • 745Before 1970
Ancestries in Banning, CA

First ancestries reported:

  • English: 1,587 (8.4%)
  • German: 729 (3.8%)
  • Italian: 509 (2.7%)
  • American: 454 (2.4%)
  • Irish: 441 (2.3%)
  • European: 229 (1.2%)
  • Polish: 179 (0.9%)
  • Scotch-Irish: 167 (0.9%)
  • Hungarian: 131 (0.7%)
  • Welsh: 110 (0.6%)
  • Norwegian: 83 (0.4%)
  • Scottish: 72 (0.4%)
  • Canadian: 66 (0.3%)
  • French: 55 (0.3%)
  • African: 51 (0.3%)
  • Eastern European: 46 (0.2%)
  • Danish: 30 (0.2%)
  • Lithuanian: 27 (0.1%)
  • Yugoslavian: 26 (0.1%)
  • British: 25 (0.1%)
  • Greek: 24 (0.1%)
  • Nigerian: 18 (0.09%)
  • Basque: 17 (0.09%)
  • Dutch: 14 (0.07%)
  • Swiss: 14 (0.07%)
  • Portuguese: 13 (0.07%)
  • Scandinavian: 12 (0.06%)
  • Czech: 10 (0.05%)
  • Egyptian: 9 (0.05%)
  • Slovak: 8 (0.04%)
  • Belizean: 8 (0.04%)
  • Czechoslovakian: 7 (0.04%)
  • Palestinian: 7 (0.04%)
  • Jamaican: 7 (0.04%)
  • Iranian: 7 (0.04%)
  • French Canadian: 6 (0.03%)
  • Finnish: 6 (0.03%)
  • Swedish: 4 (0.02%)

Most common places of birth for foreign-born residents (%):

Mexico
Banning:

57.8% (3,299)
California:

37.2% (3,881,193)

Philippines
Banning:

5.3% (303)
California:

7.8% (818,297)

Germany
Banning:

3.9% (223)
California:

0.7% (73,304)

England
Banning:

3.6% (206)
California:

0.6% (57,953)

Laos
Banning:

3.3% (188)
California:

0.5% (48,911)

Belarus
Banning:

2.9% (163)
California:

0.1% (11,157)

Korea
Banning:

2.4% (136)
California:

3.0% (315,248)

Colombia
Banning:

1.7% (96)
California:

0.5% (55,249)

Asia, n.e.c.
Banning:

1.5% (87)
California:

0.1% (11,122)

Hungary
Banning:

1.5% (86)
California:

0.1% (10,936)

Place of birth for U.S.-born residents:

  • This state: 19,223
  • Other state: 5,053
  • Northeast: 892
  • Midwest: 1,720
  • South: 1,345
  • West: 1,092

89.3% of Banning residents lived in the same house 1 years ago.
   Out of people who lived in different houses, 30.1% lived in this county.
   Out of people who lived in different counties, 97.6% lived in California.


Banning:

89.3%
State average:

88.9%

Education attainment for males 25 years and older:

  • No schooling: 445
  • Nursery to 4th grade: 69
  • 5th and 6th grade: 165
  • 7th and 8th grade: 159
  • 9th grade: 138
  • 10th grade: 194
  • 11th grade: 159
  • 12th grade, no diploma: 414
  • High school graduate (or equivalency): 3,064
  • Less than 1 year of college: 775
  • Some college more than 1 year, no degree: 1,527
  • Associate degree: 908
  • Bachelor's degree: 1,180
  • Master's degree: 601
  • Professional school degree: 92
  • Doctorate degree: 79
Educational Attainment for Males

Education attainment for females 25 years and older:

  • No schooling: 383
  • Nursery to 4th grade: 205
  • 5th and 6th grade: 186
  • 7th and 8th grade: 257
  • 9th grade: 138
  • 10th grade: 200
  • 11th grade: 202
  • 12th grade, no diploma: 451
  • High school graduate (or equivalency): 3,338
  • Less than 1 year of college: 999
  • Some college more than 1 year, no degree: 2,050
  • Associate degree: 1,175
  • Bachelor's degree: 1,093
  • Master's degree: 644
  • Professional school degree: 43
  • Doctorate degree: 6
Educational Attainment for Females
Banning marital status for males
Banning marital status for females

Housing units in structures:

  • One, detached: 8,779
  • One, attached: 783
  • Two: 60
  • 3 or 4: 239
  • 5 to 9: 239
  • 10 to 19: 82
  • 20 to 49: 60
  • 50 or more: 376
  • Mobile homes: 1,544
  • Boats, RVs, vans, etc.: 49

Median worth of mobile homes: $72,380

Housing units lacking complete plumbing facilities in 2022: 0.5%

Housing units lacking complete kitchen facilities in 2022: 1.6%

House/condo owner moved in on average 11 years ago

Renter moved in on average 5 years ago

Year householders moved into residence in Banning
Houses and condos Apartments
Most commonly used house heating fuel in houses and condos in Banning, CA
  • 82.3%Utility gas
  • 12.8%Electricity
  • 2.0%Wood
  • 1.2%No fuel used
  • 1.0%Solar energy
  • 0.7%Bottled, tank, or LP gas
Most commonly used house heating fuel in apartments in Banning, CA
  • 59.5%Utility gas
  • 35.4%Electricity
  • 3.5%Bottled, tank, or LP gas
  • 1.6%No fuel used

Private vs. public school enrollment:

Students in private schools in grades 1 to 8 (elementary and middle school): 128
Here:

4.0%
California:

10.5%

Students in private schools in grades 9 to 12 (high school): 56
Here:

3.4%
California:

8.5%

Students in private undergraduate colleges: 199
Here:

19.3%
California:

15.9%
School Enrollment by Level of School for Male Students
School Enrollment by Level of School for Female Students
Age and Sex of Sensory-Disabled Noninstitutionalized Residents
Age and Sex of Physically-Disabled Noninstitutionalized Residents
Age and Sex of Mentally-Disabled Noninstitutionalized Residents
Age and Sex of Self-Care Disabled Noninstitutionalized Residents
Age and Sex of Go-Outside-Home Disabled Noninstitutionalized Residents
Age and Sex of Noninstitutionalized Residents with Employment Disability