Barrington, IL (Illinois) Houses and Residents
| Barrington: | $557,954 |
| Illinois: | $251,600 |
Mean price in 2022:
Detached houses: $593,152
Here: $593,152 State: $310,164 Townhouses or other attached units: $323,217
Here: $323,217 State: $286,230 In 5-or-more-unit structures: $228,109
Here: $228,109 State: $318,887
Total population: 10,373 (Urban population: 10,018, Rural population: 0)
Houses: 4,488 (4,283 occupied: 3,400 owner occupied, 956 renter occupied)
| % of renters here: | 22% |
| State: | 33% |
Housing density: 976 houses/condos per square mile
Median price asked for vacant for-sale houses and condos in 2022: $712,919.
Median contract rent in 2022: $1,585
Median rent asked for vacant for-rent units in 2022: $4,110
Median gross rent in Barrington, IL in 2022: $1,718
Housing units in Barrington with a mortgage: 2,287 (306 second mortgage, 0 home equity loan, 261 both second mortgage and home equity loan)
Houses without a mortgage: 24
Median household income for houses/condos with a mortgage: $206,420
Median household income for apartments without a mortgage: $97,762
Median monthly housing costs: $2,273
Compare current foreclosures in Barrington, IL:
| Photo | Address | Area | Beds / Baths | Price | Details |
|---|---|---|---|---|---|

|
#1
Wisconsin Ave
Barrington, IL 60010
|
1,297 sq. feet
|
2 baths 3 beds |
$489,900
|
show details |

|
#2
Fairway Cir
Barrington, IL 60010
|
1,610 sq. feet
|
2 baths 3 beds |
show details | |

|
#3
Pond Gate Dr
Barrington, IL 60010
|
4,996 sq. feet
|
2 baths 4 beds |
show details | |

|
#4
Upper Pond Rd
Barrington, IL 60010
|
2,820 sq. feet
|
3 baths 4 beds |
show details | |

|
#5
Old Barn Rd
Barrington, IL 60010
|
2,371 sq. feet
|
5 baths 4 beds |
show details | |

|
#6
Otis Rd
Barrington, IL 60010
|
5,900 sq. feet
|
9 baths 7 beds |
show details | |

|
#7
Magnuson Ct
Barrington, IL 60010
|
5,832 sq. feet
|
3 baths - beds |
show details | |

|
#8
Stone Marsh Ln
Barrington, IL 60010
|
2,644 sq. feet
|
2 baths - beds |
show details | |

|
#9
Boulder Ln
Barrington, IL 60010
|
1,780 sq. feet
|
2 baths - beds |
show details | |

|
#10
W Main St
Barrington, IL 60010
|
1,024 sq. feet
|
1 baths - beds |
show details |
| Photo | Address | Area | Beds / Baths | Price | Details |
|---|---|---|---|---|---|

|
#11
Prestwick Pl
Barrington, IL 60010
|
1,965 sq. feet
|
1 baths - beds |
show details | |

|
#12
Old Sutton Rd
Barrington, IL 60010
|
4,376 sq. feet
|
3 baths - beds |
show details | |

|
#13
Lakepoint Dr
Barrington, IL 60010
|
3,201 sq. feet
|
3 baths - beds |
show details | |

|
#14
Eton Dr
Barrington, IL 60010
|
1,954 sq. feet
|
2 baths - beds |
show details | |

|
#15
N Il Route 59
Barrington, IL 60010
|
1,454 sq. feet
|
1 baths - beds |
show details | |

|
#16
Brighton Cir
Barrington, IL 60010
|
- sq. feet
|
2 baths 3 beds |
show details | |

|
#17
S Hough St
Barrington, IL 60010
|
915 sq. feet
|
1 baths - beds |
show details | |

|
#18
Cumnor Ave
Barrington, IL 60010
|
1,862 sq. feet
|
2 baths - beds |
show details | |

|
#19
Sunny Ln
Barrington, IL 60010
|
1,903 sq. feet
|
2 baths - beds |
show details | |

|
#20
W Lake St
Barrington, IL 60010
|
2,546 sq. feet
|
2 baths - beds |
show details |
| Photo | Address | Area | Beds / Baths | Price | Details |
|---|---|---|---|---|---|

|
#21
Hawley Woods Rd
Barrington, IL 60010
|
8,896 sq. feet
|
7 baths - beds |
show details | |

|
#22
N Taylor Ln
Barrington, IL 60010
|
4,152 sq. feet
|
3 baths - beds |
show details | |

|
#23
W Hillside Ave
Barrington, IL 60010
|
- sq. feet
|
- baths - beds |
show details | |

|
#24
Algonquin Rd
Barrington, IL 60010
|
- sq. feet
|
- baths - beds |
show details | |

|
#25
Algonquin Rd
Barrington, IL 60010
|
- sq. feet
|
- baths - beds |
show details | |

|
#26
N Rainbow Rd
Barrington, IL 60010
|
- sq. feet
|
- baths - beds |
show details | |

|
#27
Merchant Ct
Barrington, IL 60010
|
- sq. feet
|
- baths - beds |
show details | |

|
#28
Terra Vita Ct
Barrington, IL 60010
|
- sq. feet
|
- baths - beds |
show details | |

|
#29
W Russell St Apt 211
Barrington, IL 60010
|
- sq. feet
|
- baths - beds |
show details | |

|
#30
W County Line Rd
Barrington, IL 60010
|
- sq. feet
|
- baths - beds |
show details |
| Photo | Address | Area | Beds / Baths | Price | Details |
|---|---|---|---|---|---|

|
#31
N Hager Ave
Barrington, IL 60010
|
- sq. feet
|
- baths - beds |
show details | |

|
#32
W Lindbergh Dr
Barrington, IL 60010
|
- sq. feet
|
- baths - beds |
show details | |

|
#33
Barrington Bourne
Barrington, IL 60010
|
- sq. feet
|
- baths 3 beds |
show details | |

|
#34
Otis Rd
Barrington, IL 60010
|
- sq. feet
|
- baths - beds |
show details | |

|
#35
Farnsworth Cir
Barrington, IL 60010
|
- sq. feet
|
- baths - beds |
show details | |

|
#36
Elgin Rd
Barrington, IL 60010
|
- sq. feet
|
- baths - beds |
show details | |

|
#37
E Main St
Barrington, IL 60010
|
- sq. feet
|
- baths - beds |
show details | |

|
#38
Oak Ridge Rd # A
Barrington, IL 60010
|
- sq. feet
|
- baths - beds |
show details | |

|
#39
Algonquin Rd
Barrington, IL 60010
|
- sq. feet
|
- baths - beds |
show details | |

|
#40
Barrington Bourne
Barrington, IL 60010
|
- sq. feet
|
- baths - beds |
show details |
| Photo | Address | Area | Beds / Baths | Price | Details |
|---|---|---|---|---|---|

|
Check over 1 million property listings on Foreclosure.com!
|
browse all offers | |||
| Photo | Address | Area | Beds / Baths | Price | Details |
|---|

Latest news about housing in Barrington, IL collected exclusively by city-data.com from local newspapers, TV, and radio stations

 | Dilapidated homes in South Barrington? (55 replies) |
| Downtown Naperville - Lots of homes for sale...? (20 replies) |
| Chicago Suburbs With The Most Beautiful Houses (26 replies) |
| Barrington Lake Apartments, Hoffman Estates (2 replies) |
| Fremd vs Naperville vs Barrington vs St Charles vs Stevenson (28 replies) |
| Barrington, IL lifestyle for my young family? (22 replies) |

Median year apartment built: 1978
Household type by relationship:
Households: 10,994- Male householders: 2,137 (413 living alone), Female householders: 2,032 (590 living alone)
2,620 spouses (2,612 opposite-sex spouses), 76 unmarried partners, (76 opposite-sex unmarried partners), 3,763 children (3,663 natural, 0 adopted, 99 stepchildren), 5 grandchildren, 31 brothers or sisters, 76 parents, 0 foster children, 21 other relatives, 18 non-relatives
- In group quarters: 210
Size of family households: 1,496 2-persons, 539 3-persons, 793 4-persons, 276 5-persons, 78 6-persons, 16 7-or-more-persons.
Size of nonfamily households: 1,078 1-person, 37 2-persons.
2,422 married couples with children.
592 single-parent households (151 men, 441 women).
85.5% of residents of Barrington speak English at home.
1.7% of residents speak Spanish at home (89% speak English very well, 11% speak English well).
4.9% of residents speak other Indo-European language at home (85% speak English very well, 5% speak English well, 7% speak English not well, 3% don't speak English at all).
7.8% of residents speak Asian or Pacific Island language at home (50% speak English very well, 11% speak English well, 32% speak English not well, 8% don't speak English at all).
0.1% of residents speak other language at home (100% speak English very well).
Foreign born population: 1,335 (12.1%)
(49.7% of them are naturalized citizens)
| Here: | 10.0 |
| State: | 6.4 |
| Here: | 3.9 |
| State: | 4.1 |

- Bedrooms in owner-occupied houses and condos in Barrington, Illinois
- 0no bedroom
- 891 bedroom
- 5132 bedrooms
- 6833 bedrooms
- 1,6214 bedrooms
- 4945+ bedrooms

- Bedrooms in renter-occupied apartments in Barrington, Illinois
- 0no bedroom
- 4201 bedroom
- 3182 bedrooms
- 1053 bedrooms
- 1044 bedrooms
- 95+ bedrooms

- Cars and other vehicles available in Barrington in owner-occupied houses/condos
- 37no vehicle
- 9171 vehicle
- 1,8922 vehicles
- 4083 vehicles
- 1404 vehicles
- 75+ vehicles

- Cars and other vehicles available in Barrington in renter-occupied apartments
- 261no vehicle
- 4571 vehicle
- 2302 vehicles
- 83 vehicles
- 04 vehicles
- 05+ vehicles

- Rooms in owner-occupied houses in Barrington, Illinois
- 01 room
- 02 rooms
- 793 rooms
- 1154 rooms
- 3235 rooms
- 2966 rooms
- 2807 rooms
- 5238 rooms
- 1,7849+ rooms

- Rooms in renter-occupied apartments in Barrington, Illinois
- 01 room
- 1322 rooms
- 2243 rooms
- 2384 rooms
- 1485 rooms
- 256 rooms
- 987 rooms
- 928 rooms
- 09+ rooms


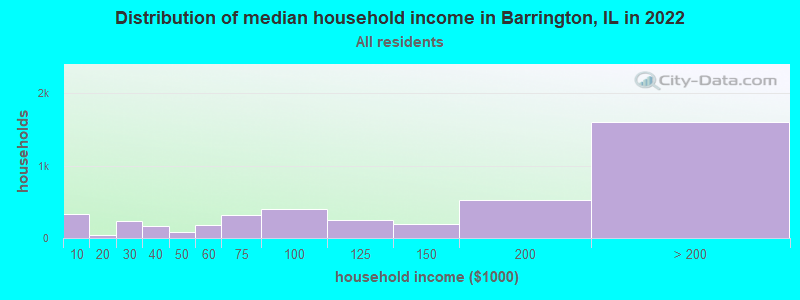
Barrington, IL household income distribution

- 331Less than $10,000
- 37$10,000 to $19,999
- 230$20,000 to $29,999
- 164$30,000 to $39,999
- 87$40,000 to $49,999
- 183$50,000 to $59,999
- 320$60,000 to $74,999
- 396$75,000 to $99,999
- 244$100,000 to $124,999
- 192$125,000 to $149,999
- 520$150,000 to $199,999
- 1,601$200,000 or more
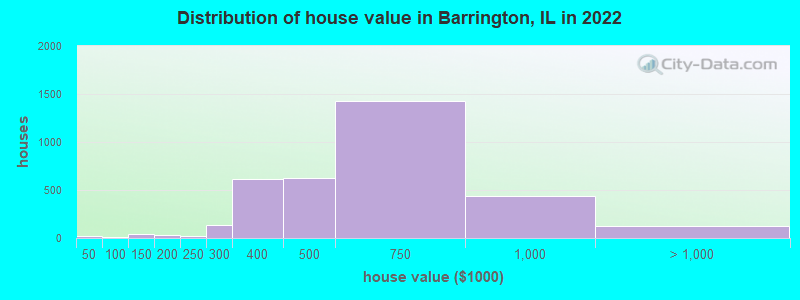
Home value of owner - occupied houses in 2022 in Barrington, IL
-
- 15$30,000 to $34,999
- 7$70,000 to $79,999
- 23$100,000 to $124,999
- 20$125,000 to $149,999
- 11$150,000 to $174,999
- 22$175,000 to $199,999
- 23$200,000 to $249,999
- 133$250,000 to $299,999
- 619$300,000 to $399,999
- 619$400,000 to $499,999
- 1,430$500,000 to $749,999
- 435$750,000 to $999,999
- 116$1,000,000 to $1,499,999
- 9$1,500,000 to $1,999,999
Rent paid by renters in 2022 in Barrington, IL
-
- 53Less than $100
- 39$100 to $149
- 75$200 to $249
- 17$250 to $299
- 17$350 to $399
- 4$550 to $599
- 14$600 to $649
- 23$900 to $999
- 68$1,000 to $1,249
- 79$1,250 to $1,499
- 222$1,500 to $1,999
- 33$2,000 to $2,499
- 35$2,500 to $2,999
- 45$3,000 to $3,499
- 217$3,500 or more
- 26No cash rent


Percentage of workers working in this county: 60.4%
Number of people working at home: 1,675 (35.5% of all workers)
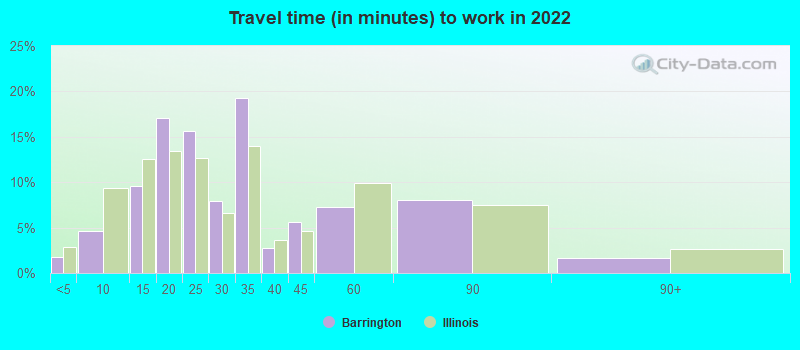
Travel time to work (commute)
- Less than 5 minutes: 158
- 5 to 9 minutes: 215
- 10 to 14 minutes: 283
- 15 to 19 minutes: 481
- 20 to 24 minutes: 296
- 25 to 29 minutes: 204
- 30 to 34 minutes: 571
- 35 to 39 minutes: 72
- 40 to 44 minutes: 62
- 45 to 59 minutes: 512
- 60 to 89 minutes: 292
- 90 or more minutes: 131
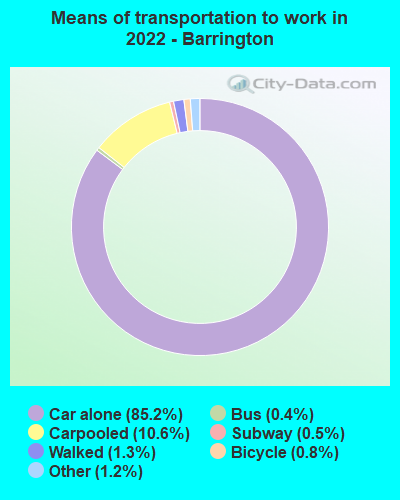
Means of transportation to work:
- Drove a car alone: 6,994 (72.0%)
- Carpooled: 936 (9.6%)
- Bus: 27 (0.3%)
- Long-distance train or commuter rail: 29 (0.3%)
- Taxi: 96 (1.0%)
- Bicycle: 69 (0.7%)
- Walked: 108 (1.1%)
- Worked at home: 1,675 (17.3%)

- Unemployment by race in 2022
- Unemployment rate for White non-Hispanic residents
- 2.9%Males
- 3.7%Females

- Year of entry for the foreign-born population in Barrington, Illinois
- 4362010 or later
- 3452000 to 2009
- 2221990 to 1999
- 761980 to 1989
- 831970 to 1979
- 238Before 1970

First ancestries reported:
- German: 686 (15.7%)
- Polish: 486 (11.1%)
- Irish: 463 (10.6%)
- American: 287 (6.6%)
- Italian: 213 (4.9%)
- English: 182 (4.2%)
- Greek: 92 (2.1%)
- Russian: 86 (2.0%)
- Icelander: 85 (1.9%)
- European: 72 (1.6%)
- Dutch: 71 (1.6%)
- Lithuanian: 49 (1.1%)
- Danish: 47 (1.1%)
- Czech: 43 (1.0%)
- Scottish: 39 (0.9%)
- Eastern European: 37 (0.8%)
- Swedish: 34 (0.8%)
- Scotch-Irish: 32 (0.7%)
- Ukrainian: 31 (0.7%)
- Scandinavian: 29 (0.7%)
- Norwegian: 28 (0.6%)
- Canadian: 26 (0.6%)
- British: 22 (0.5%)
- South African: 19 (0.4%)
- Belgian: 15 (0.3%)
- Carpatho Rusyn: 13 (0.3%)
- Jamaican: 11 (0.3%)
- Slovak: 9 (0.2%)
- French: 9 (0.2%)
- Finnish: 9 (0.2%)
- Northern European: 8 (0.2%)
- Hungarian: 8 (0.2%)
- Armenian: 7 (0.2%)
Most common places of birth for foreign-born residents (%):
| Barrington: | 26.1% (348) |
| Illinois: | 9.2% (166,409) |
| Barrington: | 15.1% (202) |
| Illinois: | 4.1% (74,364) |
| Barrington: | 8.7% (116) |
| Illinois: | 2.2% (40,393) |
| Barrington: | 5.6% (75) |
| Illinois: | 6.9% (124,474) |
| Barrington: | 5.1% (68) |
| Illinois: | 5.2% (93,003) |
| Barrington: | 4.8% (64) |
| Illinois: | 0.5% (9,671) |
| Barrington: | 3.3% (44) |
| Illinois: | 0.2% (2,988) |
| Barrington: | 2.7% (36) |
| Illinois: | 0.5% (8,168) |
| Barrington: | 2.6% (35) |
| Illinois: | 1.1% (19,306) |
| Barrington: | 2.5% (34) |
| Illinois: | 0.4% (6,611) |
| Barrington: | 2.4% (32) |
| Illinois: | 0.9% (16,308) |
| Barrington: | 2.2% (30) |
| Illinois: | 0.5% (8,235) |
Place of birth for U.S.-born residents:
- This state: 6,514
- Other state: 3,059
- Northeast: 728
- Midwest: 1,464
- South: 474
- West: 429
91.0% of Barrington residents lived in the same house 1 years ago.
Out of people who lived in different houses, 22.9% lived in this county.
Out of people who lived in different counties, 78.1% lived in Illinois.
| Barrington: | 91.0% |
| State average: | 88.3% |
Education attainment for males 25 years and older:
- No schooling: 14
- Nursery to 4th grade: 12
- 5th and 6th grade: 0
- 7th and 8th grade: 0
- 9th grade: 0
- 10th grade: 0
- 11th grade: 7
- 12th grade, no diploma: 76
- High school graduate (or equivalency): 123
- Less than 1 year of college: 44
- Some college more than 1 year, no degree: 378
- Associate degree: 112
- Bachelor's degree: 1,572
- Master's degree: 817
- Professional school degree: 196
- Doctorate degree: 72

Education attainment for females 25 years and older:
- No schooling: 16
- Nursery to 4th grade: 0
- 5th and 6th grade: 0
- 7th and 8th grade: 14
- 9th grade: 14
- 10th grade: 18
- 11th grade: 7
- 12th grade, no diploma: 65
- High school graduate (or equivalency): 320
- Less than 1 year of college: 149
- Some college more than 1 year, no degree: 462
- Associate degree: 156
- Bachelor's degree: 1,811
- Master's degree: 829
- Professional school degree: 186
- Doctorate degree: 40


Housing units in structures:
- One, detached: 3,148
- One, attached: 406
- 3 or 4: 58
- 5 to 9: 74
- 10 to 19: 78
- 20 to 49: 202
- 50 or more: 519
Housing units lacking complete kitchen facilities in 2022: 0.2%
House/condo owner moved in on average 8 years ago
Renter moved in on average 3 years ago

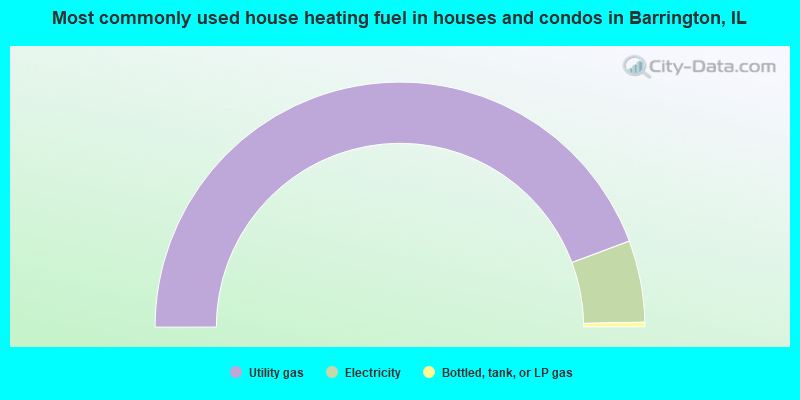
- 88.6%Utility gas
- 10.8%Electricity
- 0.6%Bottled, tank, or LP gas
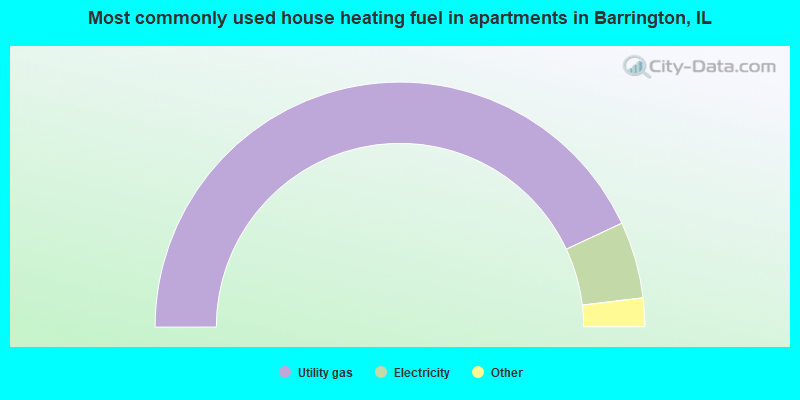
- 86.1%Utility gas
- 10.1%Electricity
- 2.4%No fuel used
- 1.4%Other fuel
Private vs. public school enrollment:
| Here: | 12.0% |
| Illinois: | 13.3% |
| Here: | 0.0% |
| Illinois: | 9.9% |
| Here: | 71.9% |
| Illinois: | 27.4% |


