Bartonville, IL (Illinois) Houses and Residents
| Bartonville: | $134,564 |
| Illinois: | $251,600 |
Mean price in 2022:
Detached houses: $167,723
Here: $167,723 State: $310,164 Townhouses or other attached units: $210,714
Here: $210,714 State: $286,230
Total population: 6,423 (Urban population: 5,870, Rural population: 287 (all nonfarm))
Houses: 2,715 (2,460 occupied: 2,120 owner occupied, 411 renter occupied)
| % of renters here: | 16% |
| State: | 33% |
Housing density: 338 houses/condos per square mile
Median price asked for vacant for-sale houses and condos in 2022: $133,422.
Median contract rent in 2022: $704 (lower quartile is $561, upper quartile is $866)
Median rent asked for vacant for-rent units in 2022: $2,631
Median gross rent in Bartonville, IL in 2022: $870
Housing units in Bartonville with a mortgage: 1,212 (128 second mortgage, 14 home equity loan, 86 both second mortgage and home equity loan)
Houses without a mortgage: 34
Median household income for houses/condos with a mortgage: $68,478
Median household income for apartments without a mortgage: $71,430
Median monthly housing costs: $902
Compare current foreclosures near Bartonville, IL:
| Photo | Address | Area | Beds / Baths | Price | Details |
|---|---|---|---|---|---|

|
#1
N Molleck Dr # 5
Peoria, IL 61604
|
952 sq. feet
|
2 baths 2 beds |
$129,000
|
show details |

|
#2
W Brookside Dr
Peoria, IL 61615
|
2,391 sq. feet
|
2 baths 3 beds |
$241,000
|
show details |

|
#3
Herman St
Pekin, IL 61554
|
915 sq. feet
|
1 baths 2 beds |
$135,000
|
show details |

|
#4
2nd St
Pekin, IL 61554
|
1,058 sq. feet
|
1 baths 3 beds |
$127,000
|
show details |

|
#5
State St
Pekin, IL 61554
|
1,652 sq. feet
|
1 baths 6 beds |
$29,900
|
show details |

|
#6
N Highland St
Creve Coeur, IL 61610
|
750 sq. feet
|
1 baths 1 beds |
$24,900
|
show details |

|
#7
Hickory Point Rd
Metamora, IL 61548
|
- sq. feet
|
1 baths 2 beds |
$114,900
|
show details |

|
#8
N 18th St
Pekin, IL 61554
|
1,548 sq. feet
|
1 baths 3 beds |
show details | |

|
#9
W Garden St
Peoria, IL 61605
|
950 sq. feet
|
1 baths 5 beds |
show details | |

|
#10
N Brooklyn Pl
Dunlap, IL 61525
|
1,756 sq. feet
|
2 baths 2 beds |
show details |
| Photo | Address | Area | Beds / Baths | Price | Details |
|---|---|---|---|---|---|

|
#11
Ave
Peoria, IL 61603
|
756 sq. feet
|
1 baths 3 beds |
show details | |

|
#12
S Hanna City Glasford Rd
Hanna City, IL 61536
|
1,162 sq. feet
|
1 baths 2 beds |
show details | |

|
#13
E Madison St
Morton, IL 61550
|
1,638 sq. feet
|
1 baths 3 beds |
show details | |

|
#14
Meadow Ave
East Peoria, IL 61611
|
- sq. feet
|
1 baths 2 beds |
show details | |

|
#15
W Corrington Ave
Peoria, IL 61604
|
1,504 sq. feet
|
2 baths 3 beds |
show details | |

|
#16
Peoria St
Washington, IL 61571
|
1,518 sq. feet
|
1 baths 3 beds |
show details | |

|
#17
Sun Valley Ct
East Peoria, IL 61611
|
1,060 sq. feet
|
1 baths 3 beds |
show details | |

|
#18
N Oxford Pl
Peoria, IL 61614
|
1,844 sq. feet
|
2 baths 3 beds |
show details | |

|
#19
Fischer Rd
Creve Coeur, IL 61610
|
1,444 sq. feet
|
1 baths 3 beds |
show details | |

|
#20
Court Dr
Washington, IL 61571
|
1,760 sq. feet
|
1 baths 3 beds |
show details |
| Photo | Address | Area | Beds / Baths | Price | Details |
|---|---|---|---|---|---|

|
#21
W Detweiller Dr
Peoria, IL 61615
|
2,379 sq. feet
|
3 baths 3 beds |
show details | |

|
#22
N Safford Dr
Peoria, IL 61615
|
912 sq. feet
|
1 baths 2 beds |
show details | |

|
#23
N Bourland Ave
Peoria, IL 61604
|
792 sq. feet
|
1 baths 2 beds |
show details | |

|
#24
S Stewart St
Creve Coeur, IL 61610
|
1,152 sq. feet
|
1 baths 3 beds |
show details | |

|
#25
S Trivoli Rd
Trivoli, IL 61569
|
2,060 sq. feet
|
1 baths 3 beds |
show details | |

|
#26
W Albany Ave
Peoria, IL 61604
|
1,014 sq. feet
|
1 baths 3 beds |
show details | |

|
#27
W Meadows Pl
Peoria, IL 61604
|
818 sq. feet
|
1 baths 2 beds |
show details | |

|
#28
W Thrush Ave
Peoria, IL 61604
|
1,142 sq. feet
|
2 baths 3 beds |
show details | |

|
#29
Cypress St
Pekin, IL 61554
|
1,008 sq. feet
|
1 baths 3 beds |
show details | |

|
#30
S 7th St
Pekin, IL 61554
|
2,040 sq. feet
|
3 baths 3 beds |
show details |
| Photo | Address | Area | Beds / Baths | Price | Details |
|---|---|---|---|---|---|

|
#31
Jim Ct
East Peoria, IL 61611
|
1,788 sq. feet
|
1 baths 3 beds |
show details | |

|
#32
Franklin St
Pekin, IL 61554
|
1,254 sq. feet
|
2 baths 3 beds |
show details | |

|
#33
W Shenandoah Dr
Peoria, IL 61614
|
1,332 sq. feet
|
2 baths 2 beds |
show details | |

|
#34
N Harper Ter
Peoria, IL 61604
|
1,388 sq. feet
|
2 baths 3 beds |
show details | |

|
#35
Royal Ave
Pekin, IL 61554
|
1,324 sq. feet
|
1 baths 3 beds |
show details | |

|
#36
N Mcarthur Dr
Pekin, IL 61554
|
2,057 sq. feet
|
1 baths 4 beds |
show details | |

|
#37
N Saint Michael Ave
Peoria, IL 61615
|
1,653 sq. feet
|
2 baths 4 beds |
show details | |

|
#38
W Southport Rd
Peoria, IL 61615
|
1,006 sq. feet
|
1 baths 2 beds |
show details | |

|
#39
Kaskaskia Rd
Pekin, IL 61554
|
2,292 sq. feet
|
2 baths 3 beds |
show details | |

|
#40
E Corrington Ave
Peoria, IL 61603
|
2,218 sq. feet
|
1 baths 4 beds |
show details |
| Photo | Address | Area | Beds / Baths | Price | Details |
|---|---|---|---|---|---|

|
#41
W Heading Ave
Peoria, IL 61604
|
1,040 sq. feet
|
2 baths 3 beds |
show details | |

|
#42
S Granville Ave
Peoria, IL 61607
|
2,412 sq. feet
|
2 baths 4 beds |
show details | |

|
#43
E Willcox Ave
Peoria, IL 61603
|
844 sq. feet
|
1 baths 2 beds |
show details | |

|
#44
Ricketts Ave
Peoria, IL 61607
|
1,952 sq. feet
|
3 baths 3 beds |
show details | |

|
#45
Parkfield Dr
Pekin, IL 61554
|
2,123 sq. feet
|
2 baths 3 beds |
show details | |

|
#46
Bellair Drive
Liverpool, IL 61543
|
616 sq. feet
|
1 baths 2 beds |
show details | |

|
#47
S Cedar St
Washington, IL 61571
|
1,264 sq. feet
|
1 baths 3 beds |
show details | |

|
#48
N Galena Rd
Peoria Heights, IL 61616
|
2,494 sq. feet
|
3 baths 3 beds |
show details | |

|
#49
Illinois St
Pekin, IL 61554
|
1,008 sq. feet
|
1 baths 2 beds |
show details | |

|
Check over 1 million property listings on Foreclosure.com!
|
browse all offers | |||

Latest news about housing in Bartonville, IL collected exclusively by city-data.com from local newspapers, TV, and radio stations

 | Safe apartments and places to live in Peoria, IL (19 replies) |
| Moving to Peoria. Apartment suggestions? (3 replies) |
| Moving to Peoria for Caterpillar, where to rent? (15 replies) |
| Potential Relocation - Job in Pekin - Where to Rent/Peoria Pekin Area? (3 replies) |
| Peoria Schools (2 replies) |
| Moving from the Desert to Peoria! (8 replies) |

Median year apartment built: 1964
Household type by relationship:
Households: 5,859- Male householders: 1,321 (410 living alone), Female householders: 1,101 (350 living alone)
1,160 spouses (1,160 opposite-sex spouses), 280 unmarried partners, (280 opposite-sex unmarried partners), 1,672 children (1,608 natural, 9 adopted, 54 stepchildren), 127 grandchildren, 16 brothers or sisters, 24 parents, 11 foster children, 110 other relatives, 32 non-relatives
Size of family households: 664 2-persons, 287 3-persons, 361 4-persons, 149 5-persons, 37 6-persons, 53 7-or-more-persons.
Size of nonfamily households: 784 1-person, 189 2-persons, 5 3-persons.
1,101 married couples with children.
193 single-parent households (36 men, 157 women).
97.1% of residents of Bartonville speak English at home.
0.5% of residents speak Spanish at home (100% speak English very well).
1.8% of residents speak Asian or Pacific Island language at home (100% speak English very well).
Foreign born population: 18 (0.3%)
(61.1% of them are naturalized citizens)
| Here: | 6.5 |
| State: | 6.4 |
| Here: | 4.5 |
| State: | 4.1 |

- Bedrooms in owner-occupied houses and condos in Bartonville, Illinois
- 4no bedroom
- 271 bedroom
- 4952 bedrooms
- 1,3563 bedrooms
- 2314 bedrooms
- 85+ bedrooms

- Bedrooms in renter-occupied apartments in Bartonville, Illinois
- 10no bedroom
- 601 bedroom
- 2612 bedrooms
- 803 bedrooms
- 04 bedrooms
- 05+ bedrooms

- Cars and other vehicles available in Bartonville in owner-occupied houses/condos
- 33no vehicle
- 6841 vehicle
- 9502 vehicles
- 2713 vehicles
- 1834 vehicles
- 05+ vehicles

- Cars and other vehicles available in Bartonville in renter-occupied apartments
- 71no vehicle
- 1341 vehicle
- 1582 vehicles
- 483 vehicles
- 04 vehicles
- 05+ vehicles

- Rooms in owner-occupied houses in Bartonville, Illinois
- 41 room
- 02 rooms
- 03 rooms
- 1964 rooms
- 5125 rooms
- 4626 rooms
- 5287 rooms
- 2208 rooms
- 1999+ rooms

- Rooms in renter-occupied apartments in Bartonville, Illinois
- 51 room
- 02 rooms
- 483 rooms
- 1544 rooms
- 1035 rooms
- 576 rooms
- 397 rooms
- 08 rooms
- 59+ rooms


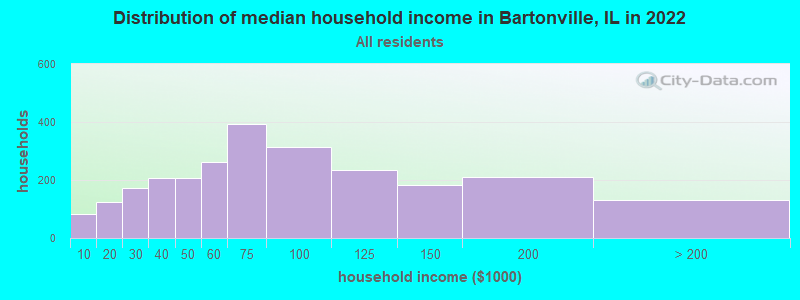
Bartonville, IL household income distribution

- 84Less than $10,000
- 123$10,000 to $19,999
- 174$20,000 to $29,999
- 207$30,000 to $39,999
- 207$40,000 to $49,999
- 263$50,000 to $59,999
- 394$60,000 to $74,999
- 314$75,000 to $99,999
- 235$100,000 to $124,999
- 183$125,000 to $149,999
- 209$150,000 to $199,999
- 130$200,000 or more
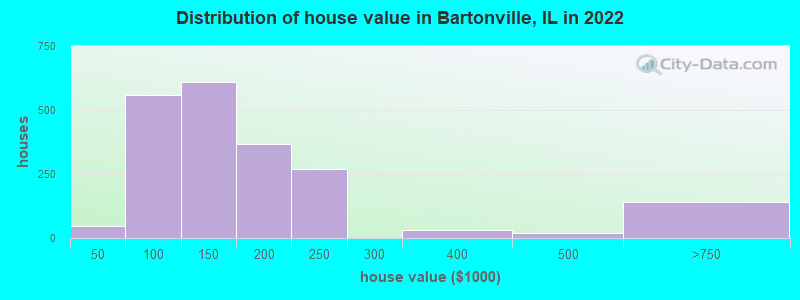
Home value of owner - occupied houses in 2022 in Bartonville, IL
-
- 15Less than $10,000
- 29$40,000 to $49,999
- 35$50,000 to $59,999
- 99$60,000 to $69,999
- 102$70,000 to $79,999
- 77$80,000 to $89,999
- 211$90,000 to $99,999
- 350$100,000 to $124,999
- 259$125,000 to $149,999
- 220$150,000 to $174,999
- 148$175,000 to $199,999
- 270$200,000 to $249,999
- 32$300,000 to $399,999
- 20$400,000 to $499,999
- 142$500,000 to $749,999
Rent paid by renters in 2022 in Bartonville, IL
-
- 2$400 to $449
- 14$450 to $499
- 47$500 to $549
- 48$550 to $599
- 27$600 to $649
- 7$650 to $699
- 31$700 to $749
- 26$750 to $799
- 62$800 to $899
- 42$900 to $999
- 17$1,000 to $1,249
- 31No cash rent


Percentage of workers working in this county: 80.4%
Number of people working at home: 213 (7.1% of all workers)
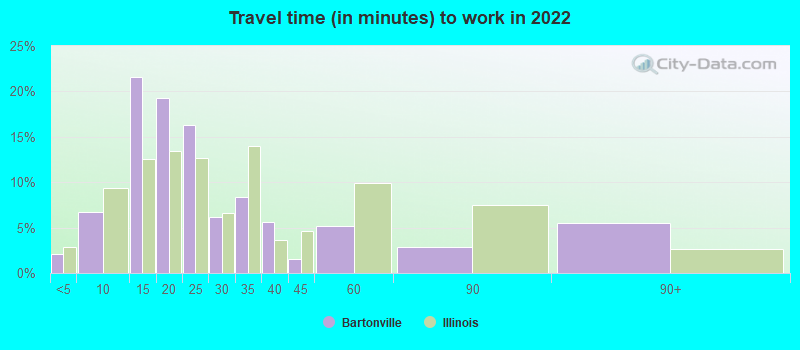
Travel time to work (commute)
- Less than 5 minutes: 155
- 5 to 9 minutes: 173
- 10 to 14 minutes: 286
- 15 to 19 minutes: 770
- 20 to 24 minutes: 766
- 25 to 29 minutes: 210
- 30 to 34 minutes: 131
- 35 to 39 minutes: 0
- 40 to 44 minutes: 38
- 45 to 59 minutes: 121
- 60 to 89 minutes: 35
- 90 or more minutes: 50
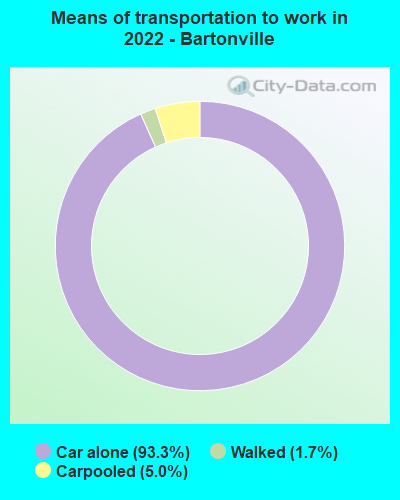
Means of transportation to work:
- Drove a car alone: 2,711 (84.2%)
- Carpooled: 167 (5.2%)
- Walked: 47 (1.5%)
- Worked at home: 231 (7.2%)

- Unemployment by race in 2022
- Unemployment rate for White non-Hispanic residents
- 2.8%Males
- 0.4%Females
- Unemployment rate for two or more race residents
- 16.4%Females

- Year of entry for the foreign-born population in Bartonville, Illinois
- 72010 or later
- 02000 to 2009
- 01990 to 1999
- 51980 to 1989
- 101970 to 1979
- 41Before 1970

First ancestries reported:
- German: 864 (40.6%)
- American: 221 (10.4%)
- English: 145 (6.8%)
- Irish: 92 (4.3%)
- Italian: 89 (4.2%)
- Scandinavian: 76 (3.6%)
- European: 70 (3.3%)
- Scottish: 46 (2.2%)
- Welsh: 43 (2.0%)
- Polish: 26 (1.2%)
- Greek: 18 (0.8%)
- Swedish: 18 (0.8%)
- French: 17 (0.8%)
- Norwegian: 11 (0.5%)
- Czech: 10 (0.5%)
- British: 8 (0.4%)
- Israeli: 5 (0.2%)
- Eastern European: 3 (0.1%)
Most common places of birth for foreign-born residents (%):
| Bartonville: | 65.2% (15) |
| Illinois: | 0.6% (10,943) |
| Bartonville: | 21.7% (5) |
| Illinois: | 1.1% (19,306) |
Place of birth for U.S.-born residents:
- This state: 5,064
- Other state: 801
- Northeast: 129
- Midwest: 228
- South: 312
- West: 113
93.1% of Bartonville residents lived in the same house 1 years ago.
Out of people who lived in different houses, 22.9% lived in this county.
Out of people who lived in different counties, 85.4% lived in Illinois.
| Bartonville: | 93.1% |
| State average: | 88.3% |
Education attainment for males 25 years and older:
- No schooling: 0
- Nursery to 4th grade: 0
- 5th and 6th grade: 0
- 7th and 8th grade: 9
- 9th grade: 23
- 10th grade: 39
- 11th grade: 13
- 12th grade, no diploma: 58
- High school graduate (or equivalency): 840
- Less than 1 year of college: 226
- Some college more than 1 year, no degree: 415
- Associate degree: 144
- Bachelor's degree: 261
- Master's degree: 68
- Professional school degree: 0
- Doctorate degree: 0

Education attainment for females 25 years and older:
- No schooling: 4
- Nursery to 4th grade: 0
- 5th and 6th grade: 0
- 7th and 8th grade: 8
- 9th grade: 0
- 10th grade: 40
- 11th grade: 20
- 12th grade, no diploma: 54
- High school graduate (or equivalency): 761
- Less than 1 year of college: 210
- Some college more than 1 year, no degree: 157
- Associate degree: 254
- Bachelor's degree: 214
- Master's degree: 274
- Professional school degree: 17
- Doctorate degree: 0


Housing units in structures:
- One, detached: 2,467
- One, attached: 106
- Two: 42
- 3 or 4: 38
- 5 to 9: 53
- 10 to 19: 4
Housing units lacking complete kitchen facilities in 2022: 1.3%
House/condo owner moved in on average 9 years ago
Renter moved in on average 2 years ago

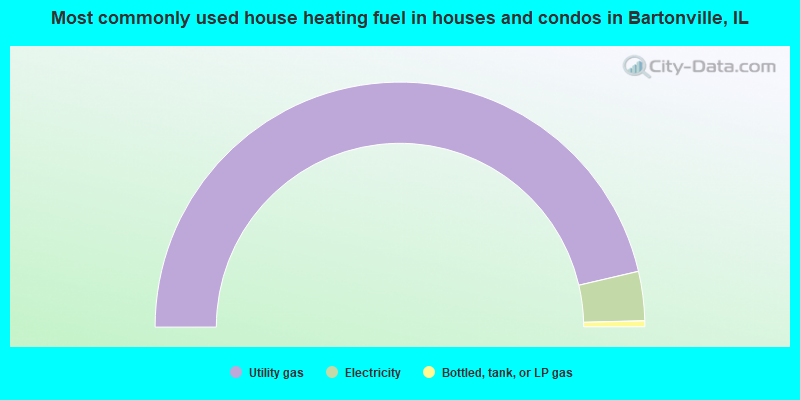
- 92.7%Utility gas
- 6.5%Electricity
- 0.8%Bottled, tank, or LP gas
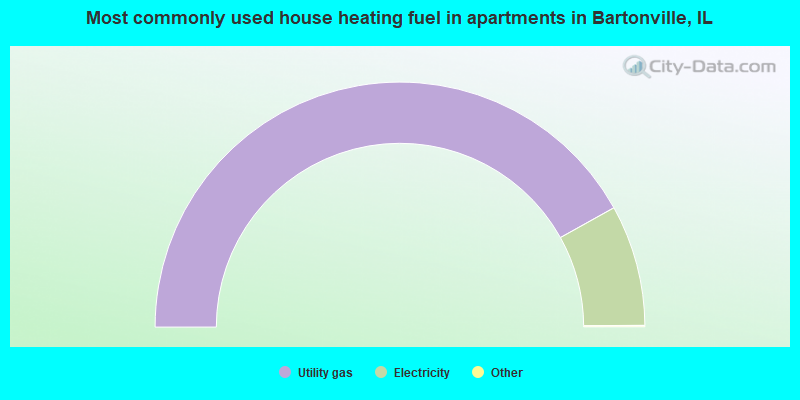
- 84.0%Utility gas
- 16.0%Electricity
Private vs. public school enrollment:
| Here: | 13.8% |
| Illinois: | 13.3% |
| Here: | 10.8% |
| Illinois: | 9.9% |
| Here: | 11.7% |
| Illinois: | 27.4% |


