Batavia, OH (Ohio) Houses and Residents
| Batavia: | $189,542 |
| Ohio: | $204,100 |
Total population: 1,645 (Urban population: 1,644, Rural population: 0)
Houses: 901 (856 occupied: 443 owner occupied, 415 renter occupied)
| % of renters here: | 48% |
| State: | 33% |
Housing density: 616 houses/condos per square mile
Median price asked for vacant for-sale houses and condos in 2022 in this county: $287,617.
Median contract rent in 2022: $720 (lower quartile is $577, upper quartile is $870)
Median rent asked for vacant for-rent units in 2022: $388
Median gross rent in Batavia, OH in 2022: $933
Housing units in Batavia with a mortgage: 280 (25 second mortgage, 0 home equity loan, 23 both second mortgage and home equity loan)
Houses without a mortgage: 5
Median household income for houses/condos with a mortgage: $69,181
Median household income for apartments without a mortgage: $89,128
Median monthly housing costs: $887
Compare current foreclosures in Batavia, OH:
| Photo | Address | Area | Beds / Baths | Price | Details |
|---|---|---|---|---|---|

|
#1
Minning Dr
Batavia, OH 45103
|
3,361 sq. feet
|
3 baths 4 beds |
show details | |

|
#2
Village Glen Dr
Batavia, OH 45103
|
2,006 sq. feet
|
2 baths 4 beds |
show details | |

|
#3
Boundry St
Batavia, OH 45103
|
1,254 sq. feet
|
2 baths 3 beds |
show details | |

|
#4
Marbe Ln
Batavia, OH 45103
|
1,344 sq. feet
|
1 baths 3 beds |
show details | |

|
#5
Brookview Dr
Batavia, OH 45103
|
1,520 sq. feet
|
1 baths 3 beds |
show details | |

|
#6
Old State Route 32
Batavia, OH 45103
|
1,848 sq. feet
|
2 baths 3 beds |
show details | |

|
#7
Baas Rd
Batavia, OH 45103
|
1,224 sq. feet
|
1 baths 3 beds |
show details | |

|
#8
Chapel Woods Dr
Batavia, OH 45103
|
2,427 sq. feet
|
3 baths 4 beds |
show details | |

|
#9
Siesta Dr
Batavia, OH 45103
|
1,386 sq. feet
|
2 baths 3 beds |
show details | |

|
#10
Springfield Ct
Batavia, OH 45103
|
1,992 sq. feet
|
2 baths 3 beds |
show details |
| Photo | Address | Area | Beds / Baths | Price | Details |
|---|---|---|---|---|---|

|
#11
Brookview Dr
Batavia, OH 45103
|
1,508 sq. feet
|
1 baths 3 beds |
show details | |

|
#12
Blackberry Ln
Batavia, OH 45103
|
1,826 sq. feet
|
2 baths 4 beds |
show details | |

|
#13
Pleasant Acres Dr
Batavia, OH 45103
|
1,548 sq. feet
|
1 baths 3 beds |
show details | |

|
#14
North St
Batavia, OH 45103
|
2,100 sq. feet
|
2 baths 4 beds |
show details | |

|
#15
Shephard Rd
Batavia, OH 45103
|
768 sq. feet
|
1 baths 2 beds |
show details | |

|
#16
Nature Run Rd
Batavia, OH 45103
|
1,508 sq. feet
|
2 baths 3 beds |
show details | |

|
#17
Muirridge Ct
Batavia, OH 45103
|
1,684 sq. feet
|
2 baths 3 beds |
show details | |

|
#18
Hanley Ln
Batavia, OH 45103
|
1,632 sq. feet
|
2 baths 3 beds |
show details | |

|
#19
N Ellis Rd
Batavia, OH 45103
|
1,795 sq. feet
|
1 baths 2 beds |
show details | |

|
#20
Jackson Pike
Batavia, OH 45103
|
634 sq. feet
|
1 baths 2 beds |
show details |
| Photo | Address | Area | Beds / Baths | Price | Details |
|---|---|---|---|---|---|

|
#21
Spring St
Batavia, OH 45103
|
1,367 sq. feet
|
1 baths 3 beds |
show details | |

|
#22
Cedar Run Ct
Batavia, OH 45103
|
1,966 sq. feet
|
2 baths 4 beds |
show details | |

|
#23
Charles St
Batavia, OH 45103
|
1,053 sq. feet
|
1 baths 2 beds |
show details | |

|
#24
State Route 132
Batavia, OH 45103
|
1,268 sq. feet
|
1 baths 3 beds |
show details | |

|
#25
Stratford Ct
Batavia, OH 45103
|
2,836 sq. feet
|
2 baths 3 beds |
show details | |

|
#26
E Charles St
Batavia, OH 45103
|
1,053 sq. feet
|
1 baths 2 beds |
show details | |

|
#27
Northridge Dr
Batavia, OH 45103
|
960 sq. feet
|
1 baths 2 beds |
show details | |

|
#28
Gary Ln
Batavia, OH 45103
|
936 sq. feet
|
1 baths 3 beds |
show details | |

|
#29
Riddle Rd
Batavia, OH 45103
|
1,055 sq. feet
|
1 baths 3 beds |
show details | |

|
#30
Fayard Dr
Batavia, OH 45103
|
1,818 sq. feet
|
2 baths 4 beds |
show details |
| Photo | Address | Area | Beds / Baths | Price | Details |
|---|---|---|---|---|---|

|
#31
Marbe Ln
Batavia, OH 45103
|
840 sq. feet
|
1 baths 2 beds |
show details | |

|
#32
Meadow Knoll Ct
Batavia, OH 45103
|
1,986 sq. feet
|
2 baths 4 beds |
show details | |

|
#33
Heitman Ln
Batavia, OH 45103
|
1,176 sq. feet
|
1 baths 2 beds |
show details | |

|
#34
Muirwood Ln
Batavia, OH 45103
|
1,568 sq. feet
|
1 baths 3 beds |
show details | |

|
#35
Arborwood Ct
Batavia, OH 45103
|
2,794 sq. feet
|
2 baths 4 beds |
show details | |

|
#36
Stonelick Hills Dr
Batavia, OH 45103
|
4,088 sq. feet
|
3 baths 4 beds |
show details | |

|
#37
Forest Meadow Dr
Batavia, OH 45103
|
- sq. feet
|
- baths - beds |
show details | |

|
#38
Gary Ln
Batavia, OH 45103
|
- sq. feet
|
- baths - beds |
show details | |

|
#39
Redleaf Dr
Batavia, OH 45103
|
- sq. feet
|
- baths - beds |
show details | |

|
#40
Belfast Owensville Rd
Batavia, OH 45103
|
- sq. feet
|
- baths - beds |
show details |
| Photo | Address | Area | Beds / Baths | Price | Details |
|---|---|---|---|---|---|

|
#41
Stonelick Woods Dr
Batavia, OH 45103
|
- sq. feet
|
- baths - beds |
show details | |

|
#42
Eastwood Dr Apt 5206
Batavia, OH 45103
|
- sq. feet
|
- baths - beds |
show details | |

|
#43
N Broadway St
Batavia, OH 45103
|
- sq. feet
|
- baths - beds |
show details | |

|
#44
W Meadow Dr
Batavia, OH 45103
|
- sq. feet
|
- baths - beds |
show details | |

|
#45
Northridge Dr # A
Batavia, OH 45103
|
- sq. feet
|
- baths - beds |
show details | |

|
#46
N Bay Ct
Batavia, OH 45103
|
- sq. feet
|
- baths - beds |
show details | |

|
#47
Chesterfield Ln
Batavia, OH 45103
|
- sq. feet
|
- baths - beds |
show details | |

|
#48
Long Lake Dr Apt 9211
Batavia, OH 45103
|
- sq. feet
|
- baths - beds |
show details | |

|
#49
Forest Meadow Dr
Batavia, OH 45103
|
- sq. feet
|
- baths - beds |
show details | |

|
Check over 1 million property listings on Foreclosure.com!
|
browse all offers | |||

Latest news about housing in Batavia, OH collected exclusively by city-data.com from local newspapers, TV, and radio stations

 | Advice on Mobile Home vs Renting (7 replies) |
| questions about rent a house in cincy (2 replies) |
| Ohio's most Hallmark-like small town (20 replies) |
| How is the suburb of Batavia? (36 replies) |
| Affordable suburb with good schools (6 replies) |
| Neighborhoods/apartments to live in (7 replies) |

Median year apartment built: 1968
Household type by relationship:
Households: 2,630- Male householders: 385 (69 living alone), Female householders: 461 (164 living alone)
347 spouses (314 opposite-sex spouses), 109 unmarried partners, (102 opposite-sex unmarried partners), 571 children (553 natural, 0 adopted, 18 stepchildren), 111 grandchildren, 89 brothers or sisters, 7 parents, 0 foster children, 2 other relatives, 109 non-relatives
- In group quarters: 437
Size of family households: 212 2-persons, 118 3-persons, 85 4-persons, 37 5-persons, 29 6-persons, 47 7-or-more-persons.
Size of nonfamily households: 245 1-person, 61 2-persons, 6 5-persons.
166 married couples with children.
246 single-parent households (99 men, 147 women).
97.4% of residents of Batavia speak English at home.
0.9% of residents speak Spanish at home (22% speak English very well, 39% speak English well, 39% speak English not well).
0.5% of residents speak other Indo-European language at home (92% speak English very well, 8% speak English not well).
0.5% of residents speak other language at home (50% speak English very well, 50% speak English well).
Foreign born population: 7 (0.3%)
(57.1% of them are naturalized citizens)
| Here: | 6.4 |
| State: | 6.7 |
| Here: | 4.2 |
| State: | 4.4 |

- Bedrooms in owner-occupied houses and condos in Batavia, Ohio
- 0no bedroom
- 271 bedroom
- 1152 bedrooms
- 2213 bedrooms
- 634 bedrooms
- 175+ bedrooms

- Bedrooms in renter-occupied apartments in Batavia, Ohio
- 0no bedroom
- 1081 bedroom
- 1772 bedrooms
- 513 bedrooms
- 794 bedrooms
- 05+ bedrooms

- Cars and other vehicles available in Batavia in owner-occupied houses/condos
- 3no vehicle
- 811 vehicle
- 2152 vehicles
- 993 vehicles
- 274 vehicles
- 185+ vehicles

- Cars and other vehicles available in Batavia in renter-occupied apartments
- 66no vehicle
- 2571 vehicle
- 752 vehicles
- 183 vehicles
- 04 vehicles
- 05+ vehicles

- Rooms in owner-occupied houses in Batavia, Ohio
- 01 room
- 02 rooms
- 163 rooms
- 154 rooms
- 925 rooms
- 1226 rooms
- 567 rooms
- 758 rooms
- 679+ rooms

- Rooms in renter-occupied apartments in Batavia, Ohio
- 01 room
- 372 rooms
- 733 rooms
- 1384 rooms
- 445 rooms
- 546 rooms
- 237 rooms
- 398 rooms
- 89+ rooms


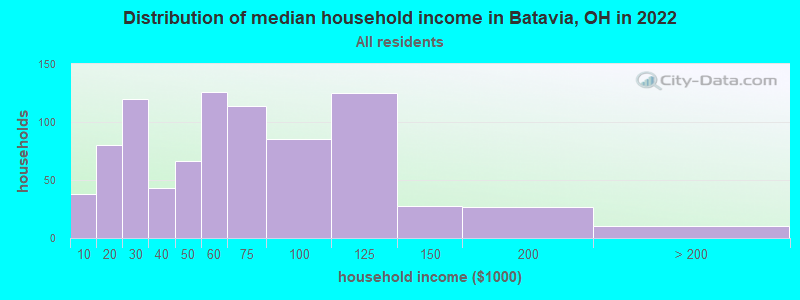
Batavia, OH household income distribution

- 38Less than $10,000
- 80$10,000 to $19,999
- 120$20,000 to $29,999
- 43$30,000 to $39,999
- 66$40,000 to $49,999
- 126$50,000 to $59,999
- 114$60,000 to $74,999
- 85$75,000 to $99,999
- 125$100,000 to $124,999
- 28$125,000 to $149,999
- 27$150,000 to $199,999
- 10$200,000 or more
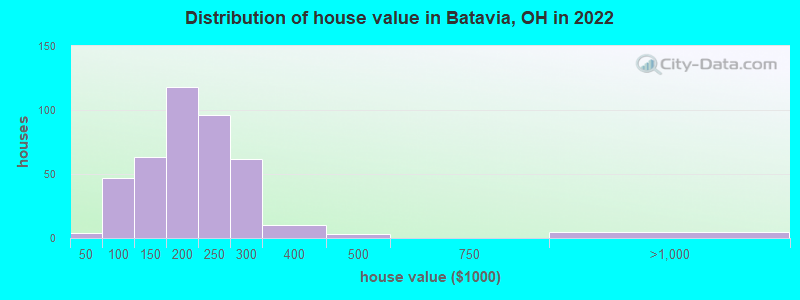
Home value of owner - occupied houses in 2022 in Batavia, OH
-
- 4Less than $10,000
- 3$50,000 to $59,999
- 15$60,000 to $69,999
- 11$70,000 to $79,999
- 13$80,000 to $89,999
- 2$90,000 to $99,999
- 34$100,000 to $124,999
- 28$125,000 to $149,999
- 89$150,000 to $174,999
- 28$175,000 to $199,999
- 96$200,000 to $249,999
- 62$250,000 to $299,999
- 10$300,000 to $399,999
- 2$400,000 to $499,999
- 4$750,000 to $999,999
Rent paid by renters in 2022 in Batavia, OH
-
- 3$100 to $149
- 4$200 to $249
- 2$250 to $299
- 40$300 to $349
- 2$350 to $399
- 15$400 to $449
- 4$450 to $499
- 10$500 to $549
- 13$550 to $599
- 25$600 to $649
- 63$650 to $699
- 9$700 to $749
- 19$750 to $799
- 72$800 to $899
- 34$900 to $999
- 19$1,000 to $1,249
- 2$1,250 to $1,499
- 4No cash rent


Percentage of workers working in this county: 62.3%
Number of people working at home: 125 (14.8% of all workers)
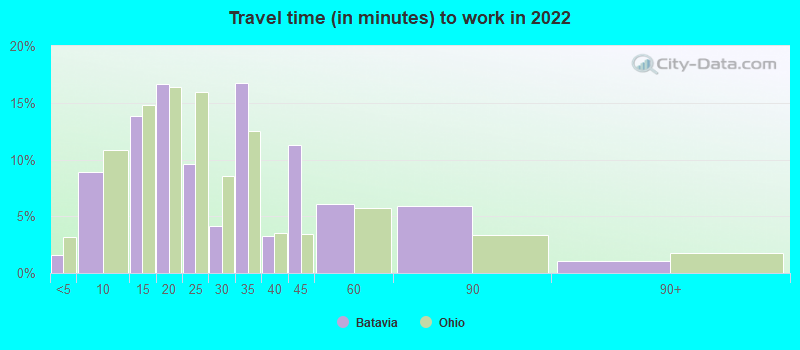
Travel time to work (commute)
- Less than 5 minutes: 44
- 5 to 9 minutes: 145
- 10 to 14 minutes: 31
- 15 to 19 minutes: 85
- 20 to 24 minutes: 76
- 25 to 29 minutes: 39
- 30 to 34 minutes: 89
- 35 to 39 minutes: 39
- 40 to 44 minutes: 22
- 45 to 59 minutes: 111
- 60 to 89 minutes: 30
- 90 or more minutes: 0

Means of transportation to work:
- Drove a car alone: 2,923 (79.7%)
- Carpooled: 373 (10.2%)
- Taxi: 16 (0.4%)
- Walked: 139 (3.8%)
- Worked at home: 125 (3.4%)

- Unemployment by race in 2022
- Unemployment rate for White non-Hispanic residents
- 24.0%Males
- 3.3%Females

- Year of entry for the foreign-born population in Batavia, Ohio
- 02010 or later
- 32000 to 2009
- 01990 to 1999
- 01980 to 1989
- 01970 to 1979
- 4Before 1970
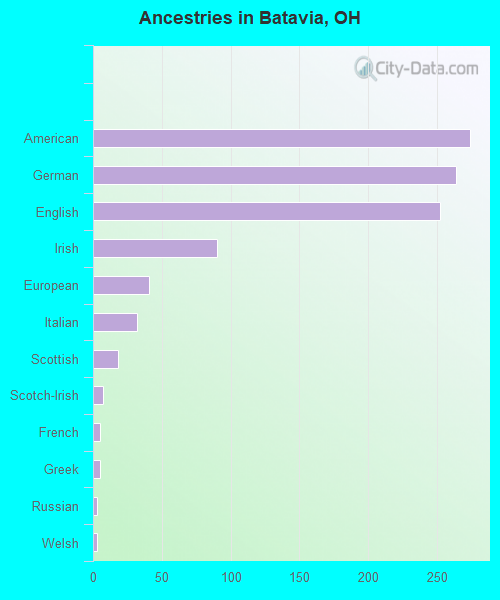
First ancestries reported:
- American: 274 (23.9%)
- German: 264 (23.0%)
- English: 252 (22.0%)
- Irish: 90 (7.9%)
- European: 41 (3.6%)
- Italian: 32 (2.8%)
- Scottish: 18 (1.6%)
- Scotch-Irish: 7 (0.6%)
- French: 5 (0.4%)
- Greek: 5 (0.4%)
- Russian: 3 (0.3%)
- Welsh: 3 (0.3%)
- Dutch: 2 (0.2%)
- Polish: 2 (0.2%)
- Czech: 1 (0.09%)
- African: 1 (0.09%)
Most common places of birth for foreign-born residents (%):
| Batavia: | 42.9% (3) |
| Ohio: | 1.5% (8,452) |
| Batavia: | 42.9% (3) |
| Ohio: | 2.2% (12,846) |
Place of birth for U.S.-born residents:
- This state: 1,911
- Other state: 696
- Northeast: 60
- Midwest: 219
- South: 381
- West: 38
79.2% of Batavia residents lived in the same house 1 years ago.
Out of people who lived in different houses, 40.7% lived in this county.
Out of people who lived in different counties, 81.6% lived in Ohio.
| Batavia: | 79.2% |
| State average: | 87.8% |
Education attainment for males 25 years and older:
- No schooling: 70
- Nursery to 4th grade: 0
- 5th and 6th grade: 0
- 7th and 8th grade: 16
- 9th grade: 8
- 10th grade: 18
- 11th grade: 35
- 12th grade, no diploma: 28
- High school graduate (or equivalency): 542
- Less than 1 year of college: 25
- Some college more than 1 year, no degree: 78
- Associate degree: 36
- Bachelor's degree: 100
- Master's degree: 40
- Professional school degree: 3
- Doctorate degree: 0

Education attainment for females 25 years and older:
- No schooling: 20
- Nursery to 4th grade: 9
- 5th and 6th grade: 4
- 7th and 8th grade: 10
- 9th grade: 14
- 10th grade: 11
- 11th grade: 28
- 12th grade, no diploma: 14
- High school graduate (or equivalency): 436
- Less than 1 year of college: 63
- Some college more than 1 year, no degree: 165
- Associate degree: 51
- Bachelor's degree: 65
- Master's degree: 35
- Professional school degree: 3
- Doctorate degree: 3


Housing units in structures:
- One, detached: 618
- One, attached: 28
- Two: 7
- 3 or 4: 79
- 5 to 9: 51
- 10 to 19: 50
- 20 to 49: 62
- 50 or more: 4
Housing units lacking complete kitchen facilities in 2022: 2.7%
House/condo owner moved in on average 13 years ago
Renter moved in on average 5 years ago

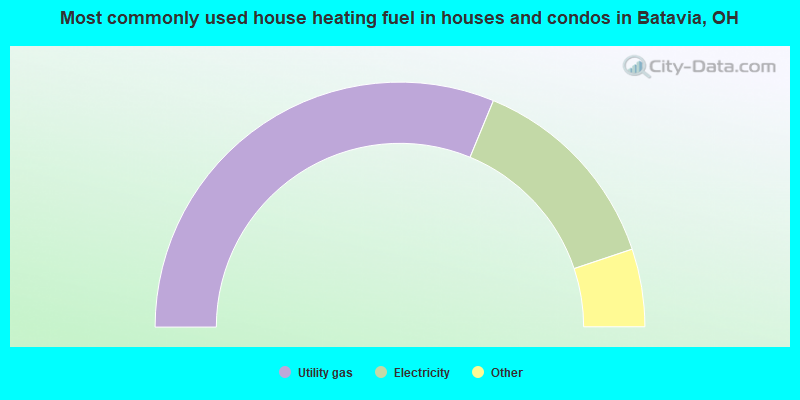
- 62.6%Utility gas
- 27.3%Electricity
- 3.9%Fuel oil, kerosene, etc.
- 3.2%Bottled, tank, or LP gas
- 2.1%Wood
- 0.9%No fuel used
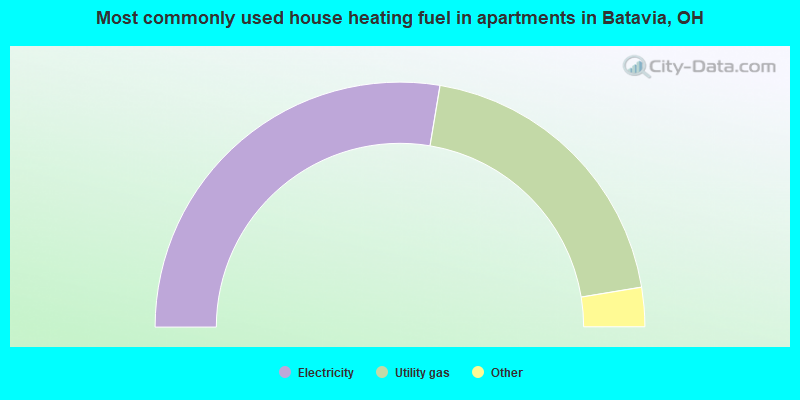
- 55.4%Electricity
- 39.7%Utility gas
- 2.2%No fuel used
- 1.5%Fuel oil, kerosene, etc.
- 1.2%Other fuel
Private vs. public school enrollment:
| Here: | 17.5% |
| Ohio: | 16.0% |
| Here: | 24.5% |
| Ohio: | 13.1% |
| Here: | 0.0% |
| Ohio: | 22.3% |


