Bay Shore, NY (New York) Houses and Residents
Estimated median house or condo value in 2022: $494,555 (it was $147,400 in 2000 )
Bay Shore:
$494,555New York:
$400,400
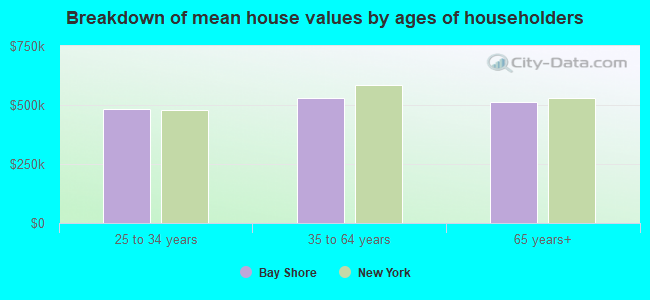
Lower value quartile - upper value quartile: $375,876 - $579,526Mean price in 2022: Detached houses: $513,052 Here:
$513,052State:
$476,719
Townhouses or other attached units: $429,971 Here:
$429,971State:
$699,270
In 2-unit structures: $356,427 Here:
$356,427State:
$713,077
In 3-to-4-unit structures: $668,410 Here:
$668,410State:
$764,568
In 5-or-more-unit structures: $586,897 Here:
$586,897State:
$912,009
Mobile homes: $326,637 Here:
$326,637State:
$88,925
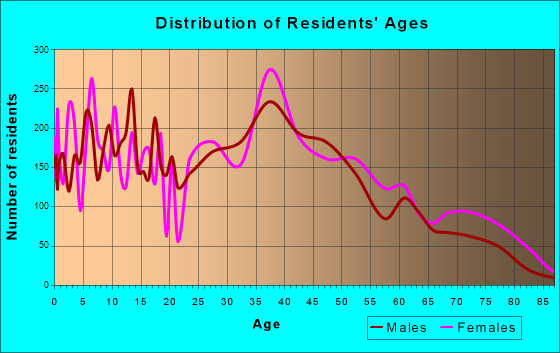
Total population: 26,337 (Urban population: 23,852, Rural population: 0)
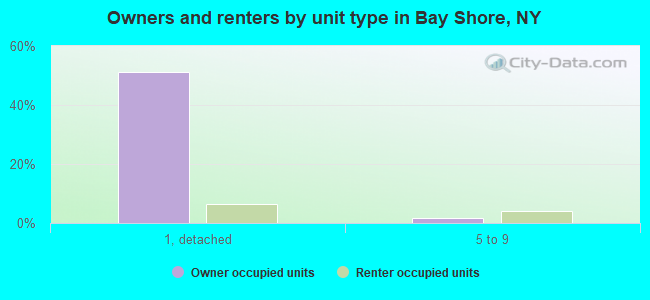
Houses: 10,159 (9,685 occupied: 6,339 owner occupied, 3,341 renter occupied )
% of renters here:
35%State:
46%
Housing density: 1,927 houses/condos per square mile
Median price asked for vacant for-sale houses and condos in 2022: $719,338.
Median contract rent in 2022: $1,837 (lower quartile is $1,276, upper quartile is over $2,000)
Median rent asked for vacant for-rent units in 2022: $3,441
Median gross rent in Bay Shore, NY in 2022: $1,942
Housing units in Bay Shore with a mortgage: 4,508 (474 second mortgage, 0 home equity loan, 355 both second mortgage and home equity loan )Houses without a mortgage: 101
Median household income for houses/condos with a mortgage: $149,589
Median household income for apartments without a mortgage: $92,679
Median monthly housing costs: $2,249
Data:
Median house or condo value ($)
Median house or condo value ($ change since 2000)
Median house or condo value ($) - White
Median house or condo value ($) - Black or African American
Median house or condo value ($) - Asian
Median house or condo value ($) - Hispanic or Latino
Median house or condo value ($) - American Indian and Alaska Native
Median house or condo value ($) - Multirace
Median house or condo value ($) - Other Race
Median price asked for mobile homes ($)
Household density (households per square mile)
Mean house or condo value by units in structure - 1, detached ($)
Mean house or condo value by units in structure - 1, attached ($)
Mean house or condo value by units in structure - 2 ($)
Mean house or condo value by units in structure by units in structure - 3 or 4 ($)
Mean house or condo value by units in structure - 5 or more ($)
Mean house or condo value by units in structure - Boat, RV, van, etc. ($)
Mean house or condo value by units in structure - Mobile home ($)
Median contract rent ($)
Median contract rent - Lower quartile ($)
Median contract rent - Upper quartile ($)
Median gross rent ($)
Urban houses (%)
Rural houses (%)
Houses occupied (%)
Houses occupied (% change since 2000)
Houses owner occupied (%)
Houses owner occupied (% change since 2000)
Houses renter occupied (%)
Houses renter occupied (% change since 2000)
Vacant housing units - For rent (%)
Vacant housing units - For rent (% change since 2000)
Vacant housing units - For sale only (%)
Vacant housing units - For sale only (% change since 2000)
Vacant housing units - Rented or sold, not occupied (%)
Vacant housing units - Rented or sold, not occupied (% change since 2000)
Vacant housing units - For seasonal, recreational, or occasional use (%)
Vacant housing units - For seasonal, recreational, or occasional use (% change since 2000)
Vacant housing units - For migrant workers (%)
Vacant housing units - For migrant workers (% change since 2000)
Vacant housing units - Other vacant (%)
Vacant housing units - Other vacant (% change since 2000)
Median monthly housing costs ($)
Median household income for houses/condos with a mortgage ($)
Median household income for houses/condos without a mortgage ($)
Median household income ($)
Median household income ($) - White
Median household income ($) - Black or African American
Median household income ($) - Asian
Median household income ($) - Hispanic or Latino
Median household income ($) - American Indian and Alaska Native
Median household income ($) - Multirace
Median household income ($) - Other Race
Mortgage status - with mortgage (%)
Mortgage status - with second mortgage (%)
Mortgage status - with home equity loan (%)
Mortgage status - with both second mortgage and home equity loan (%)
Mortgage status - without a mortgage (%)
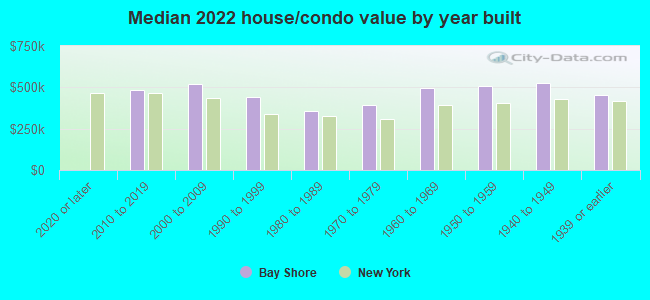
Median year house/condo built
Median year apartment built
Household type by relationship - Male householder living alone (%)
Household type by relationship - Male householder not living alone (%)
Household type by relationship - Female householder living alone (%)
Household type by relationship - Female householder not living alone (%)
Household type by relationship - Opposite-Sex spouse (%)
Household type by relationship - Same-Sex spouse (%)
Household type by relationship - Opposite-Sex unmarried partner (%)
Household type by relationship - Same-Sex unmarried partner (%)
Household type by relationship - In group quarters (%)
Size of family households - 2-person household (%)
Size of family households - 3-person household (%)
Size of family households - 4-person household (%)
Size of family households - 5-person household (%)
Size of family households - 6-person household (%)
Size of family households - 7-or-more-person household (%)
Size of nonfamily households - 1-person household (%)
Size of nonfamily households - 2-person household (%)
Size of nonfamily households - 3-person household (%)
Size of nonfamily households - 4-person household (%)
Size of nonfamily households - 5-person household (%)
Size of nonfamily households - 6-person household (%)
Size of nonfamily households - 7-or-moreperson household (%)
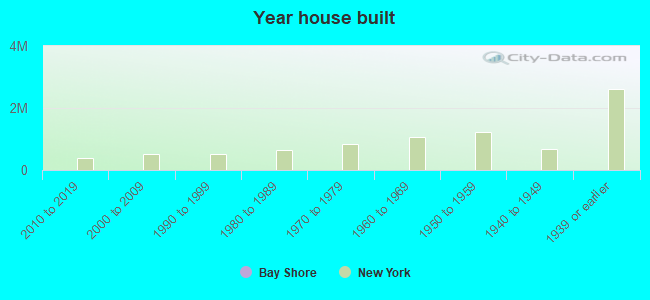
Year house built - Built 2010 or later (%)
Year house built - Built 2000 to 2009 (%)
Year house built - Built 1990 to 1999 (%)
Year house built - Built 1980 to 1989 (%)
Year house built - Built 1970 to 1979 (%)
Year house built - Built 1960 to 1969 (%)
Year house built - Built 1950 to 1959 (%)
Year house built - Built 1940 to 1949 (%)
Year house built - Built 1939 or earlier (%)
Median number of rooms in houses and condos
Median number of rooms in apartments
Median number of bedrooms in owner occupied houses
Mean number of bedrooms in owner occupied houses
Median number of bedrooms in renter occupied houses
Mean number of bedrooms in renter occupied houses
Median number of vehichles in owner occupied houses
Mean number of vehichles in owner occupied houses
Median number of vehichles in renter occupied houses
Mean number of vehichles in renter occupied houses
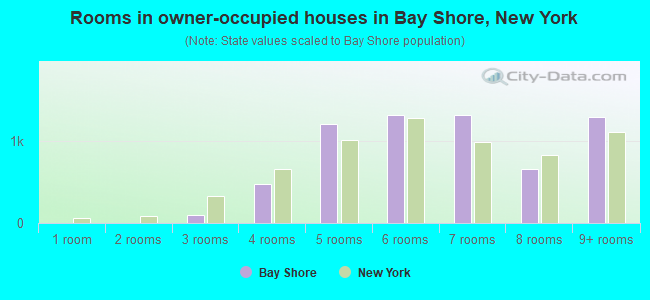
Rooms in owner-occupied houses - 1 room (%)
Rooms in owner-occupied houses - 2 rooms (%)
Rooms in owner-occupied houses - 3 rooms (%)
Rooms in owner-occupied houses - 4 rooms (%)
Rooms in owner-occupied houses - 5 rooms (%)
Rooms in owner-occupied houses - 6 rooms (%)
Rooms in owner-occupied houses - 7 rooms (%)
Rooms in owner-occupied houses - 8 rooms (%)
Rooms in owner-occupied houses - 9+ rooms (%)
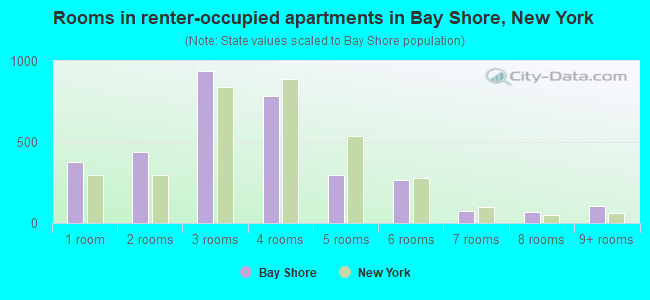
Rooms in renter-occupied houses - 1 room (%)
Rooms in renter-occupied houses - 2 rooms (%)
Rooms in renter-occupied houses - 3 rooms (%)
Rooms in renter-occupied houses - 4 rooms (%)
Rooms in renter-occupied houses - 5 rooms (%)
Rooms in renter-occupied houses - 6 rooms (%)
Rooms in renter-occupied houses - 7 rooms (%)
Rooms in renter-occupied houses - 8 rooms (%)
Rooms in renter-occupied houses - 9+ rooms (%)
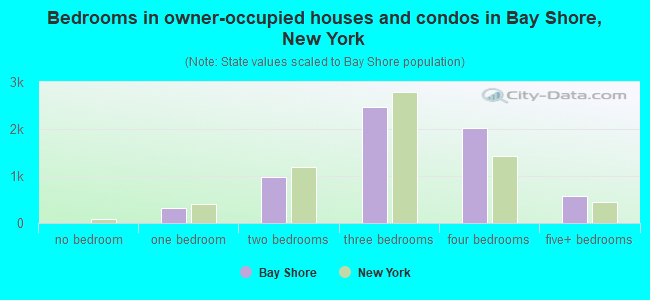
Bedrooms in owner-occupied houses - no bedrooms (%)
Bedrooms in owner-occupied houses - 1 bedroom (%)
Bedrooms in owner-occupied houses - 2 bedrooms (%)
Bedrooms in owner-occupied houses - 3 bedrooms (%)
Bedrooms in owner-occupied houses - 4 bedrooms (%)
Bedrooms in owner-occupied houses - 5+ bedrooms (%)
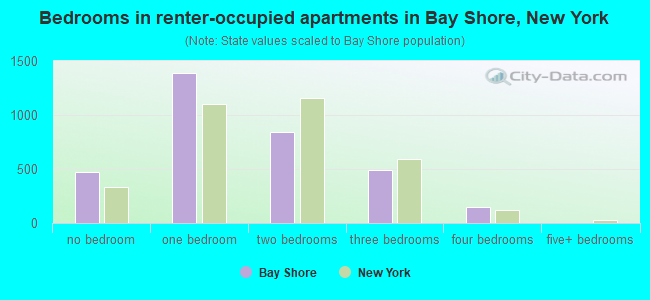
Bedrooms in renter-occupied houses - no bedrooms (%)
Bedrooms in renter-occupied houses - 1 bedroom (%)
Bedrooms in renter-occupied houses - 2 bedrooms (%)
Bedrooms in renter-occupied houses - 3 bedrooms (%)
Bedrooms in renter-occupied houses - 4 bedrooms (%)
Bedrooms in renter-occupied houses - 5+ bedrooms (%)
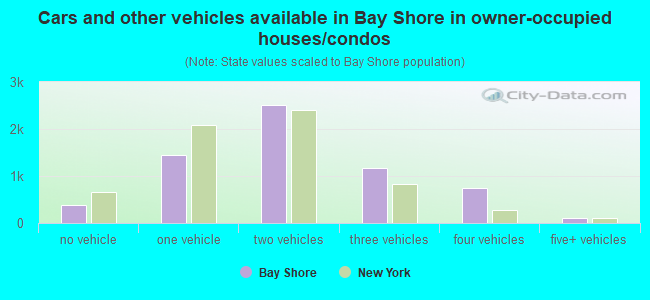
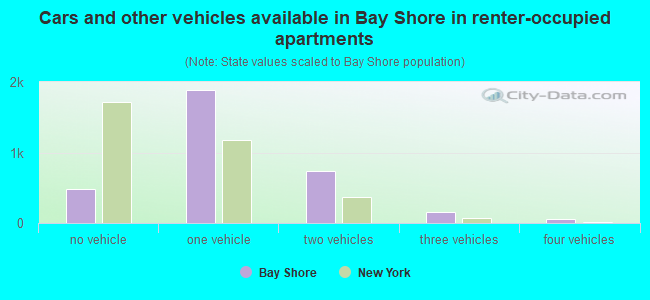
Vehicles available in owner-occupied houses - no vehicle available (%)
Vehicles available in owner-occupied houses - 1 vehicle available(%)
Vehicles available in owner-occupied houses - 2 Vehicles available (%)
Vehicles available in owner-occupied houses - 3 Vehicles available (%)
Vehicles available in owner-occupied houses - 4 Vehicles available (%)
Vehicles available in owner-occupied houses - 5+ Vehicles available (%)
Vehicles available in renter-occupied houses - no vehicle available (%)
Vehicles available in renter-occupied houses - 1 vehicle available (%)
Vehicles available in renter-occupied houses - 2 Vehicles available (%)
Vehicles available in renter-occupied houses - 3 Vehicles available (%)
Vehicles available in renter-occupied houses - 4 Vehicles available (%)
Vehicles available in renter-occupied houses - 5+ Vehicles available (%)
Housing units in structures - 1, detached (%)
Housing units in structures - 1, attached (%)
Housing units in structures - 2 (%)
Housing units in structures - 3 or 4 (%)
Housing units in structures - 5 to 9 (%)
Housing units in structures - 10 to 19 (%)
Housing units in structures - 20 to 49 (%)
Housing units in structures - 50 or more (%)
Housing units in structures - Mobile home (%)
Housing units in structures - Boat, RV, van, etc. (%)
Housing units in structures - Owners - 1, detached (%)
Housing units in structures - Owners - 1, attached (%)
Housing units in structures - Owners - 2 (%)
Housing units in structures - Owners - 3 or 4 (%)
Housing units in structures - Owners - 5 to 9 (%)
Housing units in structures - Owners - 10 to 19 (%)
Housing units in structures - Owners - 20 to 49 (%)
Housing units in structures - Owners - 50 or more (%)
Housing units in structures - Owners - Mobile home (%)
Housing units in structures - Owners - Boat, RV, van, etc. (%)
Housing units in structures - Renters - 1, detached (%)
Housing units in structures - Renters - 1, attached (%)
Housing units in structures - Renters - 2 (%)
Housing units in structures - Renters - 3 or 4 (%)
Housing units in structures - Renters - 5 to 9 (%)
Housing units in structures - Renters - 10 to 19 (%)
Housing units in structures - Renters - 20 to 49 (%)
Housing units in structures - Renters - 50 or more (%)
Housing units in structures - Renters - Mobile home (%)
Housing units in structures - Renters - Boat, RV, van, etc. (%)
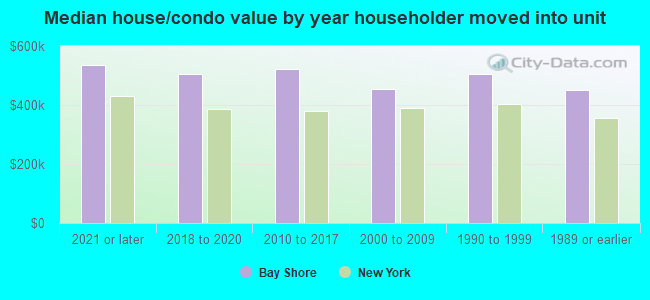
House/condo owner moved in on average (years ago)
Renter moved in on average (years ago)
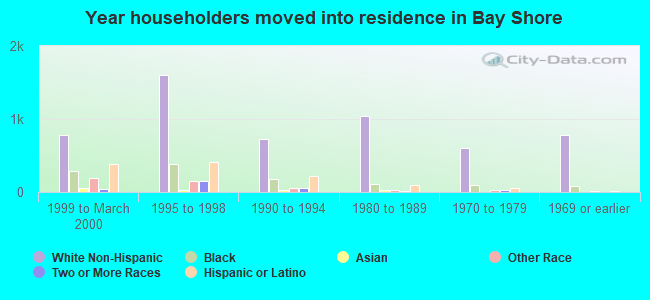
Year householder moved into unit - Moved in 1999 to March 2000 (%)
Year householder moved into unit - Moved in 1999 to March 2000 (%) - White
Year householder moved into unit - Moved in 1999 to March 2000 (%) - Black or African American
Year householder moved into unit - Moved in 1999 to March 2000 (%) - Asian
Year householder moved into unit - Moved in 1999 to March 2000 (%) - Hispanic or Latino
Year householder moved into unit - Moved in 1999 to March 2000 (%) - American Indian and Alaska Native
Year householder moved into unit - Moved in 1999 to March 2000 (%) - Multirace
Year householder moved into unit - Moved in 1999 to March 2000 (%) - Other Race
Year householder moved into unit - Moved in 1995 to 1998 (%)
Year householder moved into unit - Moved in 1995 to 1998 (%) - White
Year householder moved into unit - Moved in 1995 to 1998 (%) - Black or African American
Year householder moved into unit - Moved in 1995 to 1998 (%) - Asian
Year householder moved into unit - Moved in 1995 to 1998 (%) - Hispanic or Latino
Year householder moved into unit - Moved in 1995 to 1998 (%) - American Indian and Alaska Native
Year householder moved into unit - Moved in 1995 to 1998 (%) - Multirace
Year householder moved into unit - Moved in 1995 to 1998 (%) - Other Race
Year householder moved into unit - Moved in 1990 to 1994 (%)
Year householder moved into unit - Moved in 1990 to 1994 (%) - White
Year householder moved into unit - Moved in 1990 to 1994 (%) - Black or African American
Year householder moved into unit - Moved in 1990 to 1994 (%) - Asian
Year householder moved into unit - Moved in 1990 to 1994 (%) - Hispanic or Latino
Year householder moved into unit - Moved in 1990 to 1994 (%) - American Indian and Alaska Native
Year householder moved into unit - Moved in 1990 to 1994 (%) - Multirace
Year householder moved into unit - Moved in 1990 to 1994 (%) - Other Race
Year householder moved into unit - Moved in 1980 to 1989 (%)
Year householder moved into unit - Moved in 1980 to 1989 (%) - White
Year householder moved into unit - Moved in 1980 to 1989 (%) - Black or African American
Year householder moved into unit - Moved in 1980 to 1989 (%) - Asian
Year householder moved into unit - Moved in 1980 to 1989 (%) - Hispanic or Latino
Year householder moved into unit - Moved in 1980 to 1989 (%) - American Indian and Alaska Native
Year householder moved into unit - Moved in 1980 to 1989 (%) - Multirace
Year householder moved into unit - Moved in 1980 to 1989 (%) - Other Race
Year householder moved into unit - Moved in 1970 to 1979 (%)
Year householder moved into unit - Moved in 1970 to 1979 (%) - White
Year householder moved into unit - Moved in 1970 to 1979 (%) - Black or African American
Year householder moved into unit - Moved in 1970 to 1979 (%) - Asian
Year householder moved into unit - Moved in 1970 to 1979 (%) - Hispanic or Latino
Year householder moved into unit - Moved in 1970 to 1979 (%) - American Indian and Alaska Native
Year householder moved into unit - Moved in 1970 to 1979 (%) - Multirace
Year householder moved into unit - Moved in 1970 to 1979 (%) - Other Race
Year householder moved into unit - Moved in 1969 or earlier (%)
Year householder moved into unit - Moved in 1969 or earlier (%) - White
Year householder moved into unit - Moved in 1969 or earlier (%) - Black or African American
Year householder moved into unit - Moved in 1969 or earlier (%) - Asian
Year householder moved into unit - Moved in 1969 or earlier (%) - Hispanic or Latino
Year householder moved into unit - Moved in 1969 or earlier (%) - American Indian and Alaska Native
Year householder moved into unit - Moved in 1969 or earlier (%) - Multirace
Year householder moved into unit - Moved in 1969 or earlier (%) - Other Race
Housing units lacking complete plumbing facilities (%)
Housing units lacking complete kitchen facilities (%)
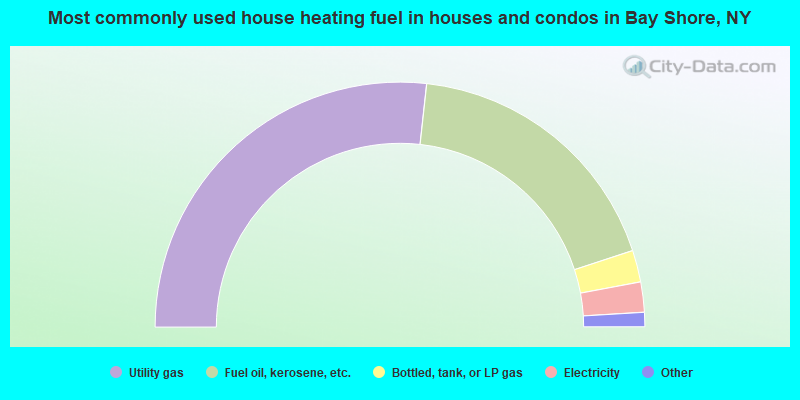
House heating fuel used in houses and condos - Utility gas (%)
House heating fuel used in houses and condos - Bottled, tank, or LP gas (%)
House heating fuel used in houses and condos - Electricity (%)
House heating fuel used in houses and condos - Fuel oil, kerosene, etc. (%)
House heating fuel used in houses and condos - Coal or coke (%)
House heating fuel used in houses and condos - Wood (%)
House heating fuel used in houses and condos - Solar energy (%)
House heating fuel used in houses and condos - Other fuel (%)
House heating fuel used in houses and condos - No fuel used (%)
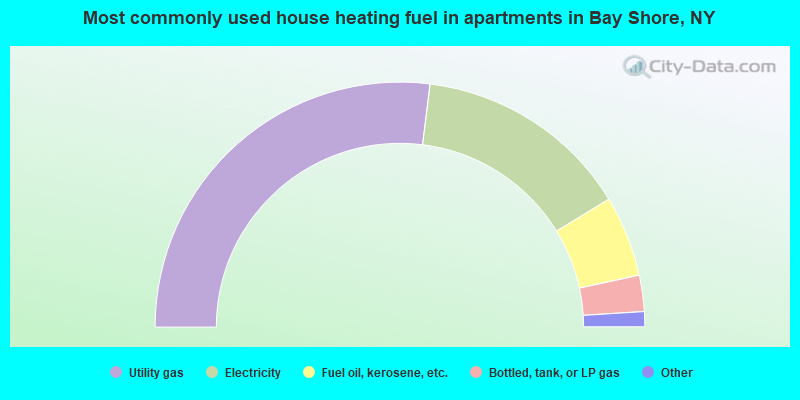
House heating fuel used in apartments - Utility gas (%)
House heating fuel used in apartments - Bottled, tank, or LP gas (%)
House heating fuel used in apartments - Electricity (%)
House heating fuel used in apartments - Fuel oil, kerosene, etc. (%)
House heating fuel used in apartments - Coal or coke (%)
House heating fuel used in apartments - Wood (%)
House heating fuel used in apartments - Solar energy (%)
House heating fuel used in apartments - Other fuel (%)
House heating fuel used in apartments - No fuel used (%)
Median year house/condo built: 1961Median year apartment built: 1972Household type by relationship:
Households: 30,572
Male householders: 4,037 (956 living alone ), Female householders: 5,625 (1,920 living alone )4,404 spouses (4,286 opposite-sex spouses ), 653 unmarried partners , (649 opposite-sex unmarried partners ), 9,585 children (9,106 natural , 81 adopted , 397 stepchildren ), 982 grandchildren , 888 brothers or sisters , 818 parents , 0 foster children , 2,167 other relatives , 1,108 non-relatives In group quarters: 300
Size of family households: 1,802 2-persons , 1,653 3-persons , 1,188 4-persons , 1,010 5-persons , 240 6-persons , 416 7-or-more-persons .
Size of nonfamily households: 2,899 1-person , 338 2-persons , 35 3-persons , 15 4-persons .
3,989 married couples with children. single-parent households (98 men , 1,315 women ).
62.1% of residents of Bay Shore speak English at home. of residents speak Spanish at home (48% speak English very well , 27% speak English well , 16% speak English not well , 8% don't speak English at all ).of residents speak other Indo-European language at home (69% speak English very well , 28% speak English well , 1% speak English not well , 1% don't speak English at all ).of residents speak Asian or Pacific Island language at home (75% speak English very well , 21% speak English well , 4% speak English not well ).of residents speak other language at home (100% speak English very well ).
Foreign born population: 9,068 (29.7%)of them are naturalized citizens )
Median number of rooms in houses and condos:
Median number of rooms in apartments
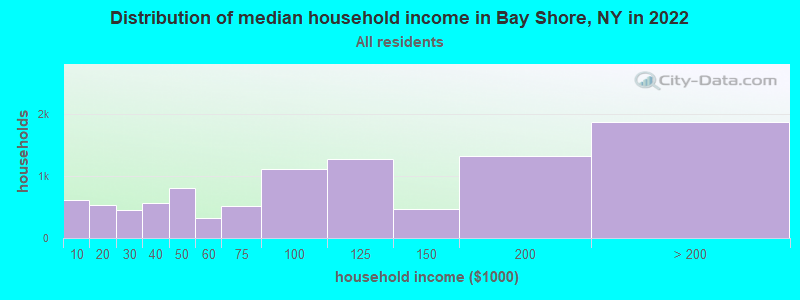
Bay Shore, NY household income distribution 606 Less than $10,000529 $10,000 to $19,999447 $20,000 to $29,999565 $30,000 to $39,999807 $40,000 to $49,999323 $50,000 to $59,999508 $60,000 to $74,9991,112 $75,000 to $99,9991,277 $100,000 to $124,999471 $125,000 to $149,9991,326 $150,000 to $199,9991,865 $200,000 or more
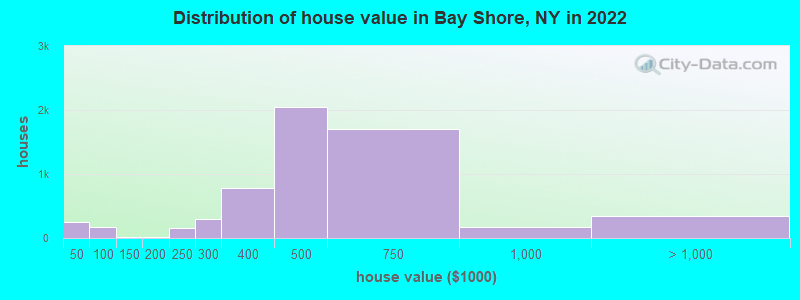
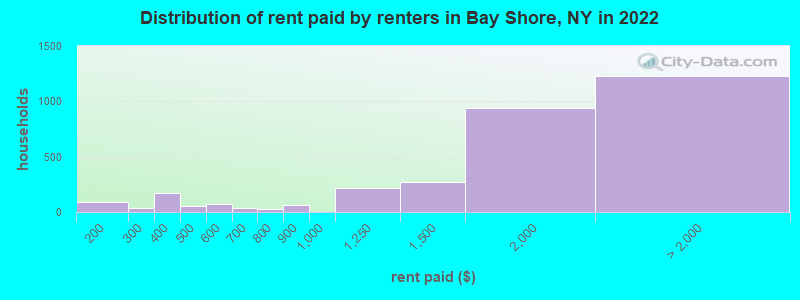
Home value of owner - occupied houses in 2022 in Bay Shore, NY 126 Less than $10,0007 $15,000 to $19,99999 $35,000 to $39,99912 $40,000 to $49,999105 $50,000 to $59,99913 $60,000 to $69,99948 $80,000 to $89,9998 $100,000 to $124,9996 $125,000 to $149,99920 $175,000 to $199,999155 $200,000 to $249,999302 $250,000 to $299,999783 $300,000 to $399,9992,048 $400,000 to $499,9991,703 $500,000 to $749,999172 $750,000 to $999,999136 $1,000,000 to $1,499,99995 $1,500,000 to $1,999,999112 $2,000,000 or moreRent paid by renters in 2022 in Bay Shore, NY 86 $150 to $19922 $200 to $24916 $250 to $299137 $300 to $34938 $350 to $39951 $400 to $4492 $450 to $49947 $500 to $54920 $550 to $59939 $600 to $64922 $700 to $74960 $800 to $899213 $1,000 to $1,249269 $1,250 to $1,499939 $1,500 to $1,999912 $2,000 to $2,499127 $2,500 to $2,9995 $3,000 to $3,499167 $3,500 or more16 No cash rent
Percentage of workers working in this county: 76.0%Number of people working at home: 1,439 (9.7% of all workers )
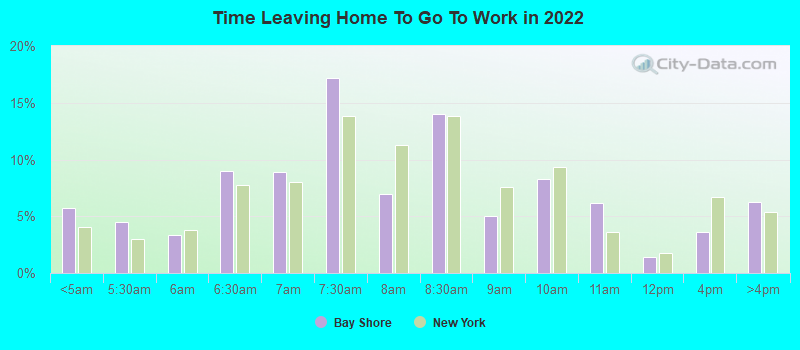
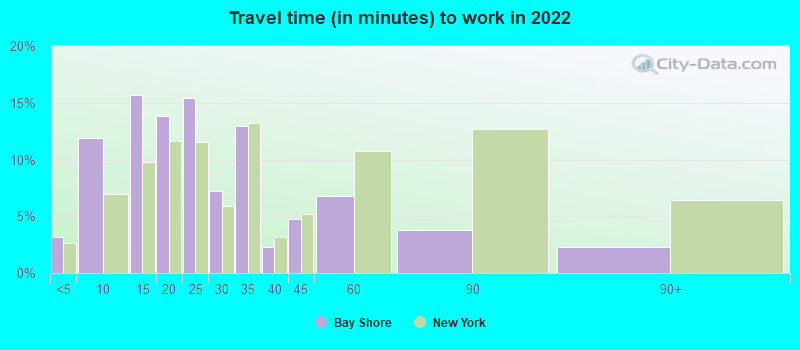
Travel time to work (commute)
Less than 5 minutes: 4685 to 9 minutes: 1,56710 to 14 minutes: 1,50815 to 19 minutes: 2,38120 to 24 minutes: 1,90225 to 29 minutes: 74330 to 34 minutes: 1,48935 to 39 minutes: 23840 to 44 minutes: 43845 to 59 minutes: 72460 to 89 minutes: 93390 or more minutes: 983
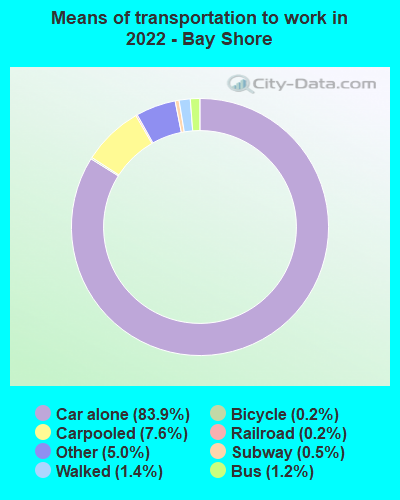
Means of transportation to work:
Drove a car alone: 12,396 (74.2%)Carpooled: 1,293 (7.7%)Bus : 157 (0.9%)Subway or elevated rail : 6 (0.0%)Long-distance train or commuter rail : 83 (0.5%)Light rail, streetcar or trolley : 26 (0.2%)Taxi: 919 (5.5%)Bicycle: 18 (0.1%)Walked: 213 (1.3%)Worked at home: 1,439 (8.6%)
Unemployment by race in 2022
Unemployment rate for White non-Hispanic residents 3.7% Males2.6% FemalesUnemployment rate for Black residents 3.7% MalesUnemployment rate for other race residents 0.8% Males4.5% FemalesUnemployment rate for two or more race residents 4.7% Males3.9% FemalesUnemployment rate for Hispanic or Latino residents 1.9% Males7.2% Females
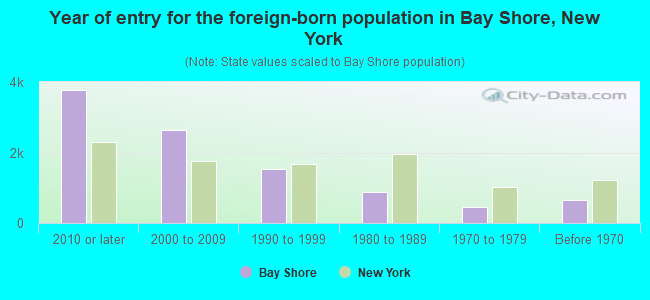
Year of entry for the foreign-born population in Bay Shore, New York
3,780 2010 or later 2,634 2000 to 2009 1,530 1990 to 1999 886 1980 to 1989 465 1970 to 1979 639 Before 1970
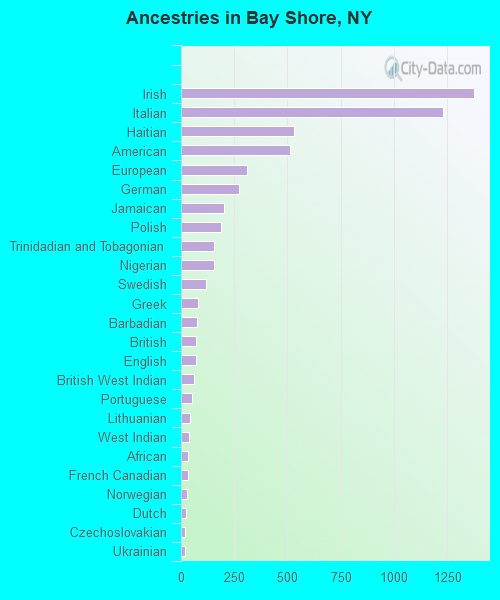
First ancestries reported:
Irish: 1,378 (10.5%)
Italian: 1,229 (9.4%)
Haitian: 531 (4.0%)
American: 514 (3.9%)
European: 308 (2.3%)
German: 274 (2.1%)
Jamaican: 201 (1.5%)
Polish: 189 (1.4%)
Trinidadian and Tobagonian: 157 (1.2%)
Nigerian: 153 (1.2%)
Swedish: 116 (0.9%)
Greek: 82 (0.6%)
Barbadian: 77 (0.6%)
British: 71 (0.5%)
English: 71 (0.5%)
British West Indian: 61 (0.5%)
Portuguese: 52 (0.4%)
Lithuanian: 43 (0.3%)
West Indian: 37 (0.3%)
African: 34 (0.3%)
French Canadian: 33 (0.3%)
Norwegian: 28 (0.2%)
Dutch: 24 (0.2%)
Czechoslovakian: 20 (0.2%)
Ukrainian: 19 (0.1%)
Welsh: 18 (0.1%)
Eastern European: 12 (0.09%)
Scotch-Irish: 11 (0.08%)
Hungarian: 9 (0.07%)
Armenian: 7 (0.05%)
French: 6 (0.05%)
Russian: 1 (0.01%)
Afghan: 1 (0.01%) Most common places of birth for foreign-born residents (%): Pakistan Bay Shore:
19.5% (1,634)New York:
1.4% (62,442)
Dominican Republic Bay Shore:
14.3% (1,198)New York:
11.1% (501,040)
Colombia Bay Shore:
11.4% (956)New York:
2.5% (111,920)
Peru Bay Shore:
6.8% (571)New York:
1.2% (54,759)
El Salvador Bay Shore:
6.1% (513)New York:
2.4% (108,067)
Honduras Bay Shore:
5.8% (488)New York:
1.2% (55,571)
Ecuador Bay Shore:
5.8% (483)New York:
3.9% (177,448)
Haiti Bay Shore:
5.0% (420)New York:
2.8% (126,936)
Ireland Bay Shore:
3.0% (255)New York:
0.6% (26,772)
Trinidad and Tobago Bay Shore:
1.8% (153)New York:
2.0% (91,428)
Philippines Bay Shore:
1.7% (140)New York:
2.0% (91,070)
Spain Bay Shore:
1.6% (132)New York:
0.3% (14,949)
Place of birth for U.S.-born residents:
This state: 18,975Other state: 1,664Northeast: 698Midwest: 236South: 456West: 262 85.3% of Bay Shore residents lived in the same house 1 years ago.
Out of people who lived in different houses, 41.8% lived in this county.
Out of people who lived in different counties, 94.4% lived in New York.
Bay Shore:
85.3%State average:
89.6%
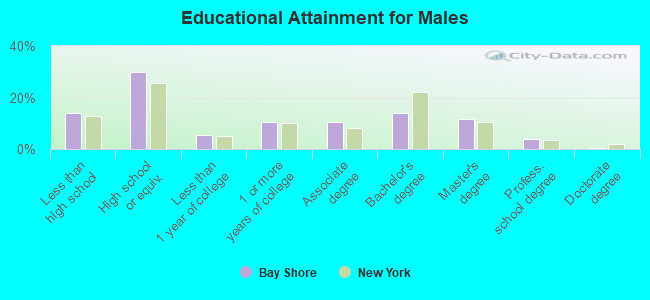
Education attainment for males 25 years and older:
No schooling: 286Nursery to 4th grade: 425th and 6th grade: 187th and 8th grade: 2039th grade: 10610th grade: 8011th grade: 21912th grade, no diploma: 388High school graduate (or equivalency): 2,900Less than 1 year of college: 510Some college more than 1 year, no degree: 993Associate degree: 1,009Bachelor's degree: 1,335Master's degree: 1,126Professional school degree: 367Doctorate degree: 56
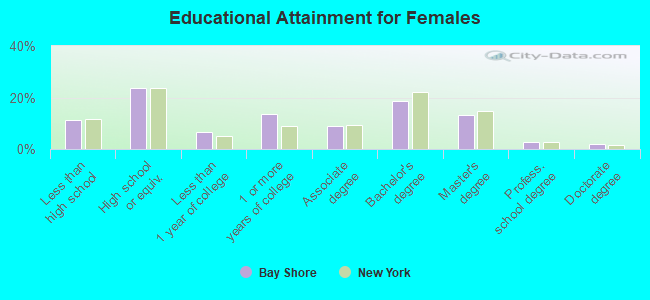
Education attainment for females 25 years and older:
No schooling: 199Nursery to 4th grade: 325th and 6th grade: 1547th and 8th grade: 1519th grade: 2610th grade: 8811th grade: 10312th grade, no diploma: 417High school graduate (or equivalency): 2,497Less than 1 year of college: 702Some college more than 1 year, no degree: 1,425Associate degree: 939Bachelor's degree: 1,973Master's degree: 1,387Professional school degree: 290Doctorate degree: 190
Housing units in structures:
One, detached: 5,803One, attached: 1,100Two: 2883 or 4: 1,0785 to 9: 49610 to 19: 43820 to 49: 14250 or more: 648Mobile homes: 162Housing units lacking complete plumbing facilities in 2022: 0.9%Housing units lacking complete kitchen facilities in 2022: 4.3%House/condo owner moved in on average 12 years ago
Renter moved in on average 3 years ago
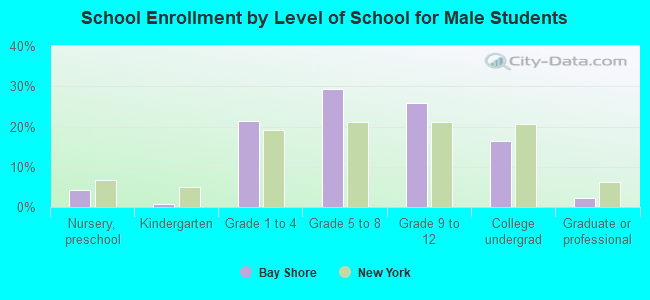
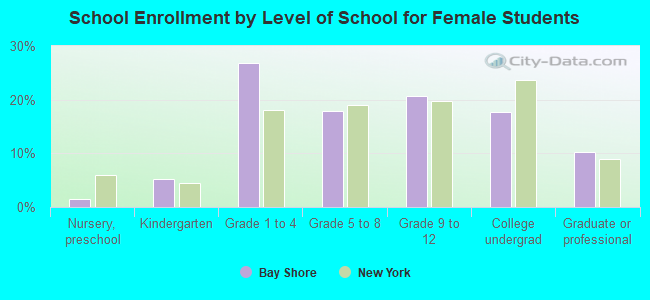
Private vs. public school enrollment:
Students in private schools in grades 1 to 8 (elementary and middle school): 126 Students in private schools in grades 9 to 12 (high school): 137 Students in private undergraduate colleges: 474