Bayview, CA (California) Houses and Residents
| Bayview: | $253,694 |
| California: | $715,900 |
Total population: 2,510 (Urban population: 2,355 (all inside urban clusters), Rural population: 0)
Houses: 1,104 (1,104 occupied: 778 owner occupied, 363 renter occupied)
| % of renters here: | 32% |
| State: | 44% |
Housing density: 1,499 houses/condos per square mile
Median price asked for vacant for-sale houses and condos in 2022 in this county: $398,519.
Median contract rent in 2022: $1,002 (lower quartile is $727, upper quartile is $1,225)
Median rent asked for vacant for-rent units in 2022: $565
Median gross rent in Bayview, CA in 2022: $1,148
Housing units in Bayview with a mortgage: 204 (7 second mortgage, 9 home equity loan, 0 both second mortgage and home equity loan)
Houses without a mortgage: 0
Median household income for houses/condos with a mortgage: $83,501
Median household income for apartments without a mortgage: $30,012
Median monthly housing costs: $778
Compare current foreclosures near Bayview, CA:
| Photo | Address | Area | Beds / Baths | Price | Details |
|---|---|---|---|---|---|

|
#1
Tami Dr
Fortuna, CA 95540
|
1,254 sq. feet
|
2 baths 4 beds |
show details | |

|
#2
Darin Dr
Arcata, CA 95521
|
720 sq. feet
|
1 baths 2 beds |
show details | |

|
#3
Lincoln St
Eureka, CA 95501
|
875 sq. feet
|
1 baths 3 beds |
show details | |

|
#4
Rohnerville Rd
Fortuna, CA 95540
|
- sq. feet
|
1 baths 2 beds |
show details | |

|
#5
Prairie Ave
Eureka, CA 95501
|
1,488 sq. feet
|
2 baths 3 beds |
show details | |

|
#6
Myrtle Ave
Eureka, CA 95501
|
2,817 sq. feet
|
3 baths 4 beds |
show details | |

|
#7
6th St
Fortuna, CA 95540
|
1,829 sq. feet
|
4 baths 6 beds |
show details | |

|
#8
Union St
Eureka, CA 95503
|
- sq. feet
|
2 baths 3 beds |
show details | |

|
#9
Little Fairfield St
Eureka, CA 95503
|
- sq. feet
|
2 baths 3 beds |
show details | |

|
#10
Alpha St
Eureka, CA 95503
|
- sq. feet
|
- baths - beds |
show details |
| Photo | Address | Area | Beds / Baths | Price | Details |
|---|---|---|---|---|---|

|
#11
N St
Fortuna, CA 95540
|
- sq. feet
|
- baths - beds |
show details | |

|
#12
Spear Ave
Arcata, CA 95521
|
- sq. feet
|
- baths - beds |
show details | |

|
#13
Beechwood Dr
Eureka, CA 95503
|
- sq. feet
|
- baths - beds |
show details | |

|
#14
Dean St Apt 11
Eureka, CA 95501
|
- sq. feet
|
- baths - beds |
show details | |

|
#15
18th St # D
Arcata, CA 95521
|
- sq. feet
|
- baths - beds |
show details | |

|
#16
Golf Course Rd
Bayside, CA 95524
|
- sq. feet
|
- baths - beds |
show details | |

|
#17
8th St # 128
Eureka, CA 95501
|
- sq. feet
|
- baths - beds |
show details | |

|
#18
Golden West Ct Apt C
Eureka, CA 95503
|
- sq. feet
|
- baths - beds |
show details | |

|
#19
Windy Rd
Mckinleyville, CA 95519
|
- sq. feet
|
- baths - beds |
show details | |

|
#20
Riverwalk Dr # 1
Fortuna, CA 95540
|
- sq. feet
|
- baths - beds |
show details |
| Photo | Address | Area | Beds / Baths | Price | Details |
|---|---|---|---|---|---|

|
#21
Larissa Cir
Mckinleyville, CA 95519
|
- sq. feet
|
- baths - beds |
show details | |

|
#22
California St
Eureka, CA 95501
|
- sq. feet
|
- baths - beds |
show details | |

|
#23
Main St
Ferndale, CA 95536
|
- sq. feet
|
- baths - beds |
show details | |

|
#24
Lawndale Dr
Fortuna, CA 95540
|
- sq. feet
|
- baths - beds |
show details | |

|
#25
Catherine Ct
Mckinleyville, CA 95519
|
- sq. feet
|
- baths - beds |
show details | |

|
#26
10th St
Fortuna, CA 95540
|
- sq. feet
|
- baths - beds |
show details | |

|
#27
Escarda Ct
Arcata, CA 95521
|
- sq. feet
|
- baths - beds |
show details | |

|
#28
Ronald Ave
Fortuna, CA 95540
|
- sq. feet
|
- baths - beds |
show details | |

|
#29
Mckinleyville Ave
Mckinleyville, CA 95519
|
- sq. feet
|
- baths - beds |
show details | |

|
#30
Kipling Dr
Eureka, CA 95503
|
- sq. feet
|
- baths - beds |
show details |
| Photo | Address | Area | Beds / Baths | Price | Details |
|---|---|---|---|---|---|

|
#31
Myrtle Ave
Eureka, CA 95503
|
- sq. feet
|
- baths - beds |
show details | |

|
#32
Cedar St
Eureka, CA 95503
|
- sq. feet
|
- baths - beds |
show details | |

|
#33
Highland Ave
Eureka, CA 95503
|
- sq. feet
|
- baths - beds |
show details | |

|
#34
D St
Eureka, CA 95503
|
- sq. feet
|
- baths - beds |
show details | |

|
#35
H St
Eureka, CA 95501
|
- sq. feet
|
- baths - beds |
show details | |

|
#36
Paradise Ln
Eureka, CA 95503
|
- sq. feet
|
- baths - beds |
show details | |

|
#37
Hodgson St
Eureka, CA 95503
|
- sq. feet
|
- baths - beds |
show details | |

|
#38
C St
Eureka, CA 95501
|
- sq. feet
|
- baths - beds |
show details | |

|
#39
Northridge Rd
Eureka, CA 95503
|
- sq. feet
|
- baths - beds |
show details | |

|
#40
Myrtle Ave
Eureka, CA 95503
|
- sq. feet
|
- baths - beds |
show details |
| Photo | Address | Area | Beds / Baths | Price | Details |
|---|---|---|---|---|---|

|
#41
J St
Eureka, CA 95501
|
- sq. feet
|
- baths - beds |
show details | |

|
#42
Mcfarlan St
Eureka, CA 95501
|
- sq. feet
|
- baths - beds |
show details | |

|
#43
16th St
Eureka, CA 95501
|
- sq. feet
|
- baths - beds |
show details | |

|
#44
15th St
Eureka, CA 95501
|
- sq. feet
|
- baths - beds |
show details | |

|
#45
Lincoln St
Eureka, CA 95501
|
- sq. feet
|
- baths - beds |
show details | |

|
#46
Wrigley Rd
Eureka, CA 95503
|
- sq. feet
|
- baths - beds |
show details | |

|
#47
Myrtle Ave Spc 22
Eureka, CA 95503
|
- sq. feet
|
- baths - beds |
show details | |

|
#48
Fieldbrook Rd
Mckinleyville, CA 95519
|
- sq. feet
|
- baths - beds |
show details | |

|
Check over 1 million property listings on Foreclosure.com!
|
browse all offers | |||

Latest news about housing in Bayview, CA collected exclusively by city-data.com from local newspapers, TV, and radio stations

 | The Bay Area Soiled/Homeless/Infested/Trashed Containment Thread (1266 replies) |
| Hunters Point/ Bayview (40 replies) |
| Anyone know Northridge Coop Homes in the Bayview? (3 replies) |
| SF/Bay Area Crime Thread (1410 replies) |
| What in the h*ll happened to Yreka? (39 replies) |
| SF Neighborhoods question (32 replies) |

Median year apartment built: 1967
Household type by relationship:
Households: 2,696- Male householders: 580 (144 living alone), Female householders: 506 (233 living alone)
428 spouses (419 opposite-sex spouses), 125 unmarried partners, (92 opposite-sex unmarried partners), 769 children (709 natural, 0 adopted, 60 stepchildren), 8 grandchildren, 55 brothers or sisters, 45 parents, 0 foster children, 41 other relatives, 120 non-relatives
- In group quarters: 13
Size of family households: 272 2-persons, 160 3-persons, 195 4-persons, 28 5-persons, 23 6-persons.
Size of nonfamily households: 392 1-person, 19 2-persons, 12 4-persons, 17 5-persons.
321 married couples with children.
332 single-parent households (172 men, 160 women).
87.4% of residents of Bayview speak English at home.
4.5% of residents speak Spanish at home (88% speak English very well, 12% don't speak English at all).
0.9% of residents speak other Indo-European language at home (45% speak English very well, 55% speak English not well).
6.5% of residents speak Asian or Pacific Island language at home (40% speak English very well, 38% speak English well, 22% speak English not well).
Foreign born population: 221 (8.2%)
(60.6% of them are naturalized citizens)
| Here: | 5.5 |
| State: | 6.0 |
| Here: | 4.0 |
| State: | 3.9 |

- Bedrooms in owner-occupied houses and condos in Bayview, California
- 84no bedroom
- 1281 bedroom
- 1422 bedrooms
- 2993 bedrooms
- 1054 bedrooms
- 205+ bedrooms

- Bedrooms in renter-occupied apartments in Bayview, California
- 11no bedroom
- 951 bedroom
- 1632 bedrooms
- 613 bedrooms
- 04 bedrooms
- 335+ bedrooms

- Cars and other vehicles available in Bayview in owner-occupied houses/condos
- 185no vehicle
- 1631 vehicle
- 2392 vehicles
- 763 vehicles
- 944 vehicles
- 225+ vehicles

- Cars and other vehicles available in Bayview in renter-occupied apartments
- 51no vehicle
- 1661 vehicle
- 1032 vehicles
- 313 vehicles
- 04 vehicles
- 135+ vehicles

- Rooms in owner-occupied houses in Bayview, California
- 841 room
- 1162 rooms
- 73 rooms
- 1454 rooms
- 305 rooms
- 1636 rooms
- 947 rooms
- 698 rooms
- 719+ rooms

- Rooms in renter-occupied apartments in Bayview, California
- 111 room
- 562 rooms
- 663 rooms
- 1064 rooms
- 295 rooms
- 276 rooms
- 137 rooms
- 348 rooms
- 219+ rooms


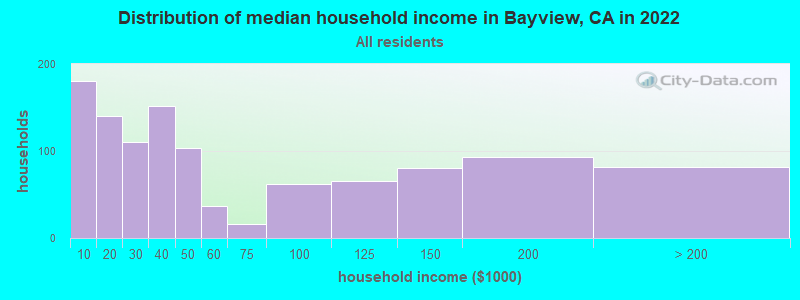
Bayview, CA household income distribution

- 180Less than $10,000
- 140$10,000 to $19,999
- 110$20,000 to $29,999
- 152$30,000 to $39,999
- 104$40,000 to $49,999
- 37$50,000 to $59,999
- 16$60,000 to $74,999
- 62$75,000 to $99,999
- 65$100,000 to $124,999
- 81$125,000 to $149,999
- 93$150,000 to $199,999
- 82$200,000 or more
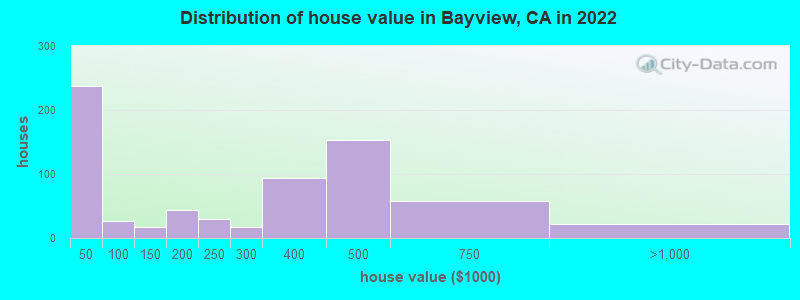
Home value of owner - occupied houses in 2022 in Bayview, CA
-
- 88Less than $10,000
- 56$10,000 to $14,999
- 92$30,000 to $34,999
- 27$50,000 to $59,999
- 17$125,000 to $149,999
- 44$150,000 to $174,999
- 29$200,000 to $249,999
- 16$250,000 to $299,999
- 93$300,000 to $399,999
- 153$400,000 to $499,999
- 58$500,000 to $749,999
- 21$750,000 to $999,999
Rent paid by renters in 2022 in Bayview, CA
-
- 27$350 to $399
- 4$400 to $449
- 16$650 to $699
- 75$700 to $749
- 13$800 to $899
- 50$900 to $999
- 104$1,000 to $1,249
- 6$1,250 to $1,499
- 53$1,500 to $1,999
- 28$2,000 to $2,499


Percentage of workers working in this county: 98.4%
Number of people working at home: 16 (1.5% of all workers)
Travel time to work (commute)
- Less than 5 minutes: 16
- 5 to 9 minutes: 211
- 10 to 14 minutes: 255
- 15 to 19 minutes: 391
- 20 to 24 minutes: 18
- 25 to 29 minutes: 14
- 30 to 34 minutes: 175
- 35 to 39 minutes: 0
- 40 to 44 minutes: 19
- 45 to 59 minutes: 11
- 60 to 89 minutes: 0
- 90 or more minutes: 11
Means of transportation to work:
- Drove a car alone: 681 (68.8%)
- Carpooled: 91 (9.2%)
- Bus or trolley bus: 16 (1.6%)
- Bicycle: 8 (0.8%)
- Walked: 133 (13.4%)
- Other means: 25 (2.5%)
- Worked at home: 36 (3.6%)

- Unemployment by race in 2022
- Unemployment rate for White non-Hispanic residents
- 5.0%Males
- 14.8%Females
- Unemployment rate for Asian residents
- 44.5%Females

- Year of entry for the foreign-born population in Bayview, California
- 792010 or later
- 02000 to 2009
- 771990 to 1999
- 221980 to 1989
- 161970 to 1979
- 59Before 1970
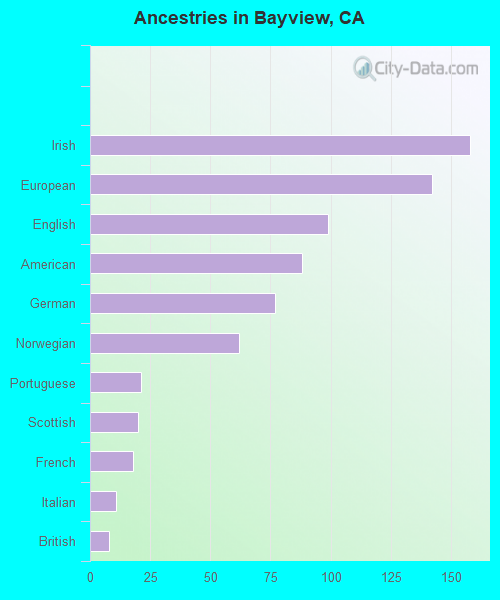
First ancestries reported:
- Irish: 158 (14.8%)
- European: 142 (13.3%)
- English: 99 (9.3%)
- American: 88 (8.2%)
- German: 77 (7.2%)
- Norwegian: 62 (5.8%)
- Portuguese: 21 (2.0%)
- Scottish: 20 (1.9%)
- French: 18 (1.7%)
- Italian: 11 (1.0%)
- British: 8 (0.7%)
Most common places of birth for foreign-born residents (%):
| Bayview: | 25.4% (53) |
| California: | 0.5% (48,911) |
| Bayview: | 24.9% (52) |
| California: | 7.8% (818,297) |
| Bayview: | 14.8% (31) |
| California: | 37.2% (3,881,193) |
| Bayview: | 12.4% (26) |
| California: | 1.2% (127,477) |
| Bayview: | 9.6% (20) |
| California: | 0.1% (8,659) |
| Bayview: | 9.6% (20) |
| California: | 0.2% (25,462) |
| Bayview: | 5.3% (11) |
| California: | 0.6% (57,953) |
| Bayview: | 3.8% (8) |
| California: | 0.1% (8,444) |
Place of birth for U.S.-born residents:
- This state: 2,031
- Other state: 431
- Northeast: 23
- Midwest: 139
- South: 135
- West: 136
83.6% of Bayview residents lived in the same house 1 years ago.
Out of people who lived in different houses, 31.0% lived in this county.
Out of people who lived in different counties, 68.1% lived in California.
| Bayview: | 83.6% |
| State average: | 88.9% |
Education attainment for males 25 years and older:
- No schooling: 0
- Nursery to 4th grade: 0
- 5th and 6th grade: 15
- 7th and 8th grade: 0
- 9th grade: 41
- 10th grade: 6
- 11th grade: 0
- 12th grade, no diploma: 15
- High school graduate (or equivalency): 363
- Less than 1 year of college: 130
- Some college more than 1 year, no degree: 163
- Associate degree: 8
- Bachelor's degree: 119
- Master's degree: 0
- Professional school degree: 12
- Doctorate degree: 0

Education attainment for females 25 years and older:
- No schooling: 0
- Nursery to 4th grade: 0
- 5th and 6th grade: 0
- 7th and 8th grade: 10
- 9th grade: 0
- 10th grade: 10
- 11th grade: 127
- 12th grade, no diploma: 71
- High school graduate (or equivalency): 209
- Less than 1 year of college: 77
- Some college more than 1 year, no degree: 106
- Associate degree: 64
- Bachelor's degree: 201
- Master's degree: 65
- Professional school degree: 12
- Doctorate degree: 18


Housing units in structures:
- One, detached: 571
- One, attached: 50
- Two: 82
- 3 or 4: 26
- 10 to 19: 34
- Mobile homes: 209
- Boats, RVs, vans, etc.: 130
House/condo owner moved in on average 14 years ago
Renter moved in on average 1 years ago

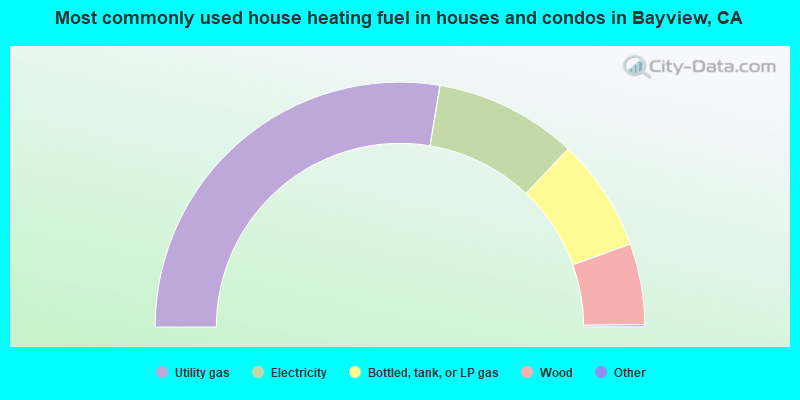
- 55.4%Utility gas
- 18.9%Electricity
- 15.0%Bottled, tank, or LP gas
- 10.7%Wood
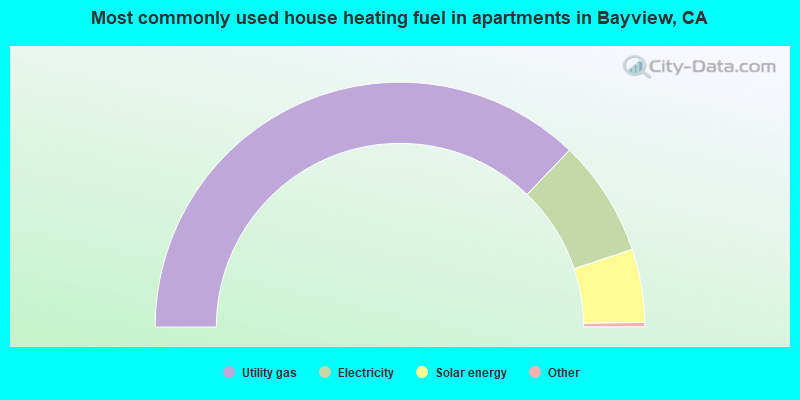
- 74.8%Utility gas
- 15.5%Electricity
- 9.7%Solar energy
Private vs. public school enrollment:
| Here: | 8.1% |
| California: | 10.5% |
| Here: | 45.4% |
| California: | 8.5% |
| Here: | 0.0% |
| California: | 15.9% |


