Beach Haven West, NJ (New Jersey) Houses and Residents
| Beach Haven West: | $584,177 |
| New Jersey: | $428,900 |
Mean price in 2022:
Detached houses: $541,107
Here: $541,107 State: $537,591
Total population: 3,896 (All urban)
Houses: 4,707 (2,202 occupied: 2,093 owner occupied, 118 renter occupied)
| % of renters here: | 5% |
| State: | 35% |
Housing density: 2,331 houses/condos per square mile
Median price asked for vacant for-sale houses and condos in 2022: $395,400.
Median contract rent in 2022: $1,660 (lower quartile is $1,512, upper quartile is $1,826)
Median rent asked for vacant for-rent units in 2022: $1,636
Median gross rent in Beach Haven West, NJ in 2022: $1,646
Housing units in Beach Haven West with a mortgage: 1,019 (102 second mortgage, 0 home equity loan, 85 both second mortgage and home equity loan)
Houses without a mortgage: 60
Median household income for houses/condos with a mortgage: $126,562
Median household income for apartments without a mortgage: $112,720
Median monthly housing costs: $1,398
Compare current foreclosures near Beach Haven West, NJ:
| Photo | Address | Area | Beds / Baths | Price | Details |
|---|---|---|---|---|---|

|
#1
Oakleaf Dr
Tuckerton, NJ 08087
|
1,224 sq. feet
|
2 baths 3 beds |
show details | |

|
#2
Midship Dr
Barnegat, NJ 08005
|
1,456 sq. feet
|
2 baths 3 beds |
show details | |

|
#3
Tampa Rd
Forked River, NJ 08731
|
1,200 sq. feet
|
2 baths 3 beds |
show details | |

|
#4
Tampa Rd
Forked River, NJ 08731
|
1,268 sq. feet
|
2 baths 1 beds |
show details | |

|
#5
Biscayne Dr
Forked River, NJ 08731
|
1,180 sq. feet
|
2 baths 3 beds |
show details | |

|
#6
Admiral Rd
Forked River, NJ 08731
|
990 sq. feet
|
1 baths 2 beds |
show details | |

|
#7
E 22nd St
Beach Haven, NJ 08008
|
1,685 sq. feet
|
3 baths 7 beds |
show details | |

|
#8
Osbourn Ct
Tuckerton, NJ 08087
|
1,992 sq. feet
|
3 baths 4 beds |
show details | |

|
#9
Davenport Lndg
Forked River, NJ 08731
|
2,472 sq. feet
|
3 baths 4 beds |
show details | |

|
#10
Southwinds Dr
Tuckerton, NJ 08087
|
1,180 sq. feet
|
3 baths 2 beds |
show details |
| Photo | Address | Area | Beds / Baths | Price | Details |
|---|---|---|---|---|---|

|
#11
E Bay Ave
Barnegat, NJ 08005
|
1,680 sq. feet
|
3 baths 3 beds |
show details | |

|
#12
Bee Way
Forked River, NJ 08731
|
1,945 sq. feet
|
2 baths 3 beds |
show details | |

|
#13
Station Dr
Forked River, NJ 08731
|
1,761 sq. feet
|
2 baths 4 beds |
show details | |

|
#14
Village Dr
Barnegat, NJ 08005
|
1,666 sq. feet
|
3 baths 4 beds |
show details | |

|
#15
Coral Ln
Manahawkin, NJ 08050
|
1,767 sq. feet
|
2 baths 4 beds |
show details | |

|
#16
W Mullica Rd
Tuckerton, NJ 08087
|
1,024 sq. feet
|
1 baths 3 beds |
show details | |

|
#17
Conifer Dr
Forked River, NJ 08731
|
1,208 sq. feet
|
2 baths 3 beds |
show details | |

|
#18
Bowline St
Barnegat, NJ 08005
|
1,252 sq. feet
|
2 baths 3 beds |
show details | |

|
#19
Nautilus Blvd
Forked River, NJ 08731
|
1,440 sq. feet
|
2 baths 3 beds |
show details | |

|
#20
Spar Ct
Barnegat, NJ 08005
|
2,352 sq. feet
|
2 baths 5 beds |
show details |
| Photo | Address | Area | Beds / Baths | Price | Details |
|---|---|---|---|---|---|

|
#21
Shelli Ter
Barnegat, NJ 08005
|
1,550 sq. feet
|
2 baths 4 beds |
show details | |

|
#22
Windsor St
Forked River, NJ 08731
|
624 sq. feet
|
2 baths 4 beds |
show details | |

|
#23
Llewellyn Pkwy
Forked River, NJ 08731
|
1,547 sq. feet
|
2 baths 3 beds |
show details | |

|
#24
Route 9 N
Tuckerton, NJ 08087
|
999 sq. feet
|
2 baths 2 beds |
show details | |

|
#25
Constitution Dr
Forked River, NJ 08731
|
1,616 sq. feet
|
2 baths 3 beds |
show details | |

|
#26
Cannonball Dr
Barnegat, NJ 08005
|
2,080 sq. feet
|
3 baths 3 beds |
show details | |

|
#27
Arlington Ave
Forked River, NJ 08731
|
1,454 sq. feet
|
2 baths 3 beds |
show details | |

|
#28
Elwood St
Forked River, NJ 08731
|
3,086 sq. feet
|
3 baths 4 beds |
show details | |

|
#29
Windward Dr
Barnegat, NJ 08005
|
975 sq. feet
|
1 baths 3 beds |
show details | |

|
#30
Clubhouse Dr
Forked River, NJ 08731
|
1,404 sq. feet
|
1 baths 3 beds |
show details |
| Photo | Address | Area | Beds / Baths | Price | Details |
|---|---|---|---|---|---|

|
#31
Golf View Dr
Tuckerton, NJ 08087
|
1,945 sq. feet
|
2 baths 2 beds |
show details | |

|
#32
Georgetown Blvd
Barnegat, NJ 08005
|
1,188 sq. feet
|
1 baths 2 beds |
show details | |

|
#33
Vacari Way
Tuckerton, NJ 08087
|
3,381 sq. feet
|
3 baths 4 beds |
show details | |

|
#34
Marine Rd
Waretown, NJ 08758
|
1,068 sq. feet
|
2 baths 3 beds |
show details | |

|
#35
Revere Dr
Tuckerton, NJ 08087
|
1,464 sq. feet
|
2 baths 5 beds |
show details | |

|
#36
4th St
Barnegat, NJ 08005
|
908 sq. feet
|
1 baths 3 beds |
show details | |

|
#37
E Holly Ln
Tuckerton, NJ 08087
|
1,195 sq. feet
|
2 baths 2 beds |
show details | |

|
#38
Stage Rd
Tuckerton, NJ 08087
|
864 sq. feet
|
2 baths 2 beds |
show details | |

|
#39
Harold Ln
Manahawkin, NJ 08050
|
1,000 sq. feet
|
1 baths 3 beds |
show details | |

|
#40
Oakleaf Dr
Tuckerton, NJ 08087
|
1,520 sq. feet
|
2 baths 3 beds |
show details |
| Photo | Address | Area | Beds / Baths | Price | Details |
|---|---|---|---|---|---|

|
#41
Stage Rd
Tuckerton, NJ 08087
|
1,144 sq. feet
|
2 baths 2 beds |
show details | |

|
#42
Waters Edge Dr
Tuckerton, NJ 08087
|
1,824 sq. feet
|
3 baths 3 beds |
show details | |

|
#43
Ridgeway Ln
Tuckerton, NJ 08087
|
2,392 sq. feet
|
3 baths 4 beds |
show details | |

|
#44
Chestnut Way Cir
Barnegat, NJ 08005
|
1,305 sq. feet
|
2 baths 3 beds |
show details | |

|
#45
Briarwood Dr
Tuckerton, NJ 08087
|
1,429 sq. feet
|
2 baths 2 beds |
show details | |

|
#46
Country Club Blvd
Tuckerton, NJ 08087
|
1,740 sq. feet
|
2 baths 3 beds |
show details | |

|
#47
Lighthouse Dr
Waretown, NJ 08758
|
- sq. feet
|
1 baths 2 beds |
show details | |

|
#48
Golf View Dr
Tuckerton, NJ 08087
|
1,945 sq. feet
|
2 baths 2 beds |
show details | |

|
#49
Bristol Ter
Tuckerton, NJ 08087
|
2,192 sq. feet
|
3 baths 3 beds |
show details | |

|
Check over 1 million property listings on Foreclosure.com!
|
browse all offers | |||


 | Vacation Rentals In Beach Haven West (4 replies) |
| Move to NJ (Monmouth Country/Shore Towns) (11 replies) |
| Generator (Permanent) Advice (7 replies) |
| So is the sale of my home hopeless? (296 replies) |
| Harbourtown Estates in Little Egg Harbor (5 replies) |
| Considering building a modular home in Manahawkin (8 replies) |

Median year apartment built: 1988
Household type by relationship:
Households: 5,051- Male householders: 1,281 (385 living alone), Female householders: 966 (290 living alone)
1,293 spouses (1,265 opposite-sex spouses), 121 unmarried partners, (103 opposite-sex unmarried partners), 1,164 children (1,056 natural, 36 adopted, 70 stepchildren), 0 grandchildren, 14 brothers or sisters, 7 parents, 0 foster children, 69 other relatives, 133 non-relatives
Size of family households: 840 2-persons, 336 3-persons, 274 4-persons, 64 5-persons.
Size of nonfamily households: 625 1-person, 49 2-persons, 5 3-persons, 14 4-persons.
420 married couples with children.
14 single-parent households (14 men, 0 women).
97.2% of residents of Beach Haven West speak English at home.
0.9% of residents speak Spanish at home (100% speak English very well).
1.9% of residents speak other Indo-European language at home (92% speak English very well, 8% speak English well).
Foreign born population: 132 (2.6%)
(95.5% of them are naturalized citizens)
| Here: | 6.3 |
| State: | 6.8 |
| Here: | 6.6 |
| State: | 3.9 |

- Bedrooms in owner-occupied houses and condos in Beach Haven West, New Jersey
- 0no bedroom
- 01 bedroom
- 3292 bedrooms
- 9393 bedrooms
- 6164 bedrooms
- 2095+ bedrooms

- Bedrooms in renter-occupied apartments in Beach Haven West, New Jersey
- 0no bedroom
- 01 bedroom
- 332 bedrooms
- 473 bedrooms
- 374 bedrooms
- 05+ bedrooms

- Cars and other vehicles available in Beach Haven West in owner-occupied houses/condos
- 156no vehicle
- 6971 vehicle
- 7352 vehicles
- 2173 vehicles
- 2164 vehicles
- 735+ vehicles

- Cars and other vehicles available in Beach Haven West in renter-occupied apartments
- 0no vehicle
- 791 vehicle
- 392 vehicles
- 03 vehicles
- 04 vehicles
- 05+ vehicles

- Rooms in owner-occupied houses in Beach Haven West, New Jersey
- 01 room
- 02 rooms
- 1703 rooms
- 2704 rooms
- 3165 rooms
- 3876 rooms
- 3917 rooms
- 1988 rooms
- 3629+ rooms

- Rooms in renter-occupied apartments in Beach Haven West, New Jersey
- 01 room
- 02 rooms
- 03 rooms
- 184 rooms
- 05 rooms
- 396 rooms
- 317 rooms
- 298 rooms
- 09+ rooms


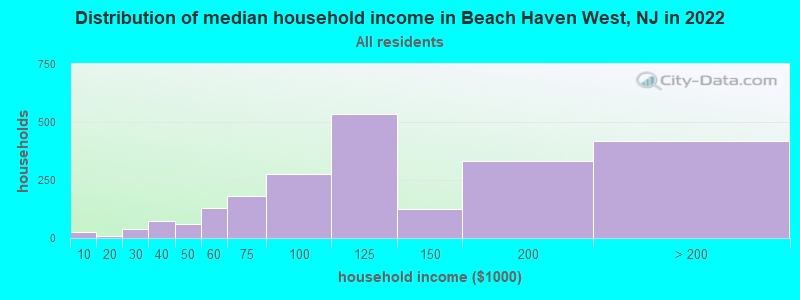
Beach Haven West, NJ household income distribution

- 26Less than $10,000
- 9$10,000 to $19,999
- 37$20,000 to $29,999
- 74$30,000 to $39,999
- 60$40,000 to $49,999
- 129$50,000 to $59,999
- 180$60,000 to $74,999
- 275$75,000 to $99,999
- 536$100,000 to $124,999
- 125$125,000 to $149,999
- 334$150,000 to $199,999
- 420$200,000 or more
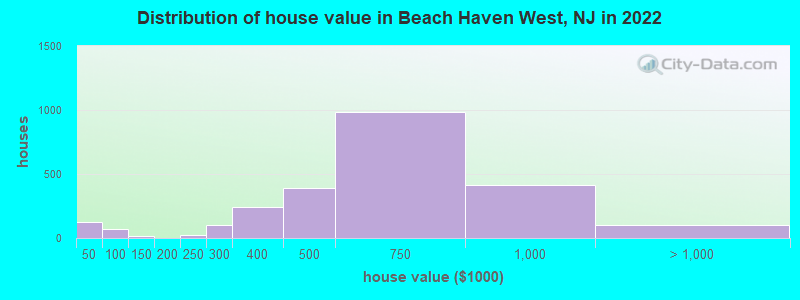
Home value of owner - occupied houses in 2022 in Beach Haven West, NJ
-
- 128Less than $10,000
- 53$50,000 to $59,999
- 16$70,000 to $79,999
- 6$100,000 to $124,999
- 10$125,000 to $149,999
- 22$200,000 to $249,999
- 102$250,000 to $299,999
- 244$300,000 to $399,999
- 387$400,000 to $499,999
- 988$500,000 to $749,999
- 416$750,000 to $999,999
- 43$1,000,000 to $1,499,999
- 33$1,500,000 to $1,999,999
- 26$2,000,000 or more
Rent paid by renters in 2022 in Beach Haven West, NJ
-
- 8$750 to $799
- 31$1,500 to $1,999
- 62No cash rent


Percentage of workers working in this county: 48.7%
Number of people working at home: 277 (10.2% of all workers)
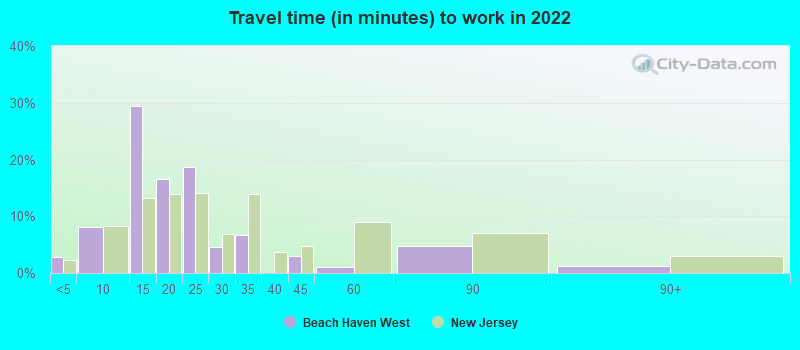
Travel time to work (commute)
- Less than 5 minutes: 0
- 5 to 9 minutes: 382
- 10 to 14 minutes: 287
- 15 to 19 minutes: 359
- 20 to 24 minutes: 186
- 25 to 29 minutes: 32
- 30 to 34 minutes: 190
- 35 to 39 minutes: 0
- 40 to 44 minutes: 124
- 45 to 59 minutes: 389
- 60 to 89 minutes: 284
- 90 or more minutes: 170
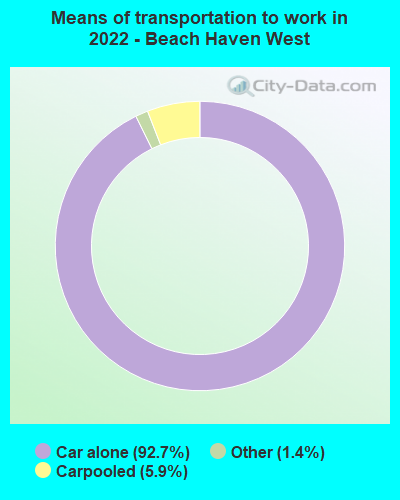
Means of transportation to work:
- Drove a car alone: 1,078 (74.3%)
- Carpooled: 78 (5.4%)
- Taxi: 15 (1.0%)
- Worked at home: 277 (19.1%)

- Unemployment by race in 2022
- Unemployment rate for White non-Hispanic residents
- 5.1%Males

- Year of entry for the foreign-born population in Beach Haven West, New Jersey
- 02010 or later
- 12000 to 2009
- 91990 to 1999
- 321980 to 1989
- 151970 to 1979
- 73Before 1970

First ancestries reported:
- Italian: 552 (38.7%)
- Irish: 248 (17.4%)
- German: 100 (7.0%)
- Polish: 100 (7.0%)
- Greek: 73 (5.1%)
- Israeli: 73 (5.1%)
- Hungarian: 50 (3.5%)
- American: 47 (3.3%)
- Dutch: 26 (1.8%)
- English: 17 (1.2%)
- Lithuanian: 17 (1.2%)
- European: 12 (0.8%)
- Ukrainian: 12 (0.8%)
- Portuguese: 10 (0.7%)
- Scottish: 10 (0.7%)
- Egyptian: 9 (0.6%)
- Swedish: 7 (0.5%)
- Scotch-Irish: 6 (0.4%)
Most common places of birth for foreign-born residents (%):
| Beach Haven West: | 58.6% (78) |
| New Jersey: | 0.5% (10,975) |
| Beach Haven West: | 24.8% (33) |
| New Jersey: | 1.5% (33,198) |
| Beach Haven West: | 17.3% (23) |
| New Jersey: | 0.8% (17,217) |
| Beach Haven West: | 6.0% (8) |
| New Jersey: | 1.6% (33,678) |
Place of birth for U.S.-born residents:
- This state: 3,216
- Other state: 1,707
- Northeast: 1,575
- Midwest: 112
- South: 29
- West: 8
83.1% of Beach Haven West residents lived in the same house 1 years ago.
Out of people who lived in different houses, 13.0% lived in this county.
Out of people who lived in different counties, 60.7% lived in New Jersey.
| Beach Haven West: | 83.1% |
| State average: | 90.4% |
Education attainment for males 25 years and older:
- No schooling: 162
- Nursery to 4th grade: 0
- 5th and 6th grade: 0
- 7th and 8th grade: 7
- 9th grade: 0
- 10th grade: 12
- 11th grade: 0
- 12th grade, no diploma: 0
- High school graduate (or equivalency): 472
- Less than 1 year of college: 203
- Some college more than 1 year, no degree: 199
- Associate degree: 92
- Bachelor's degree: 792
- Master's degree: 126
- Professional school degree: 81
- Doctorate degree: 16

Education attainment for females 25 years and older:
- No schooling: 0
- Nursery to 4th grade: 0
- 5th and 6th grade: 0
- 7th and 8th grade: 0
- 9th grade: 0
- 10th grade: 0
- 11th grade: 0
- 12th grade, no diploma: 25
- High school graduate (or equivalency): 520
- Less than 1 year of college: 94
- Some college more than 1 year, no degree: 228
- Associate degree: 250
- Bachelor's degree: 662
- Master's degree: 344
- Professional school degree: 6
- Doctorate degree: 118


Housing units in structures:
- One, detached: 4,536
- One, attached: 48
- Two: 97
- Mobile homes: 25
House/condo owner moved in on average 7 years ago
Renter moved in on average 10 years ago

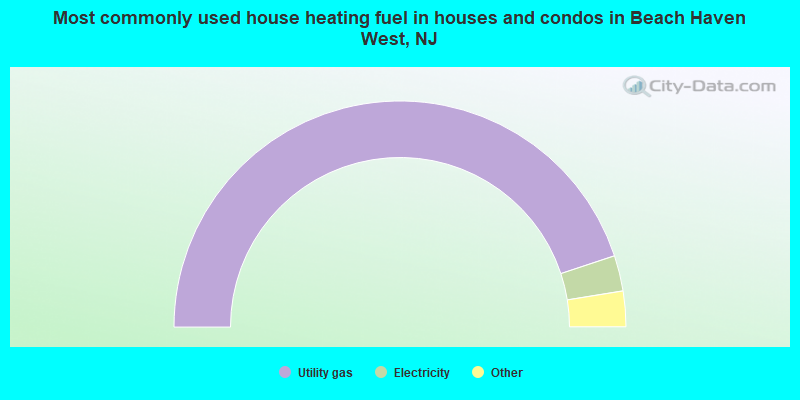
- 89.9%Utility gas
- 5.1%Electricity
- 2.6%Bottled, tank, or LP gas
- 1.9%Coal or coke
- 0.5%Wood
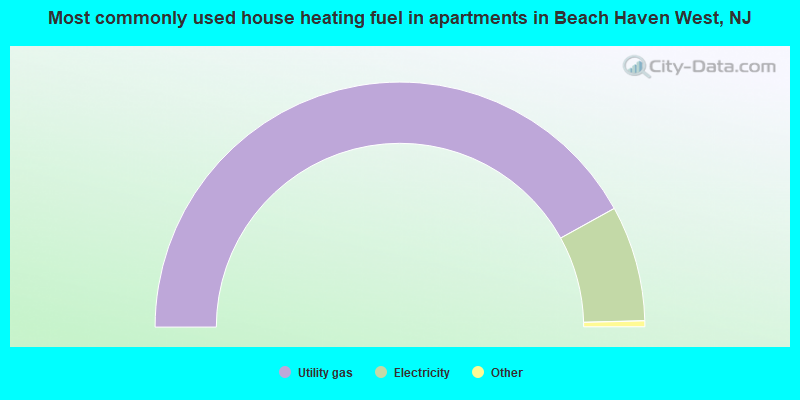
- 84.6%Utility gas
- 15.4%Electricity
Private vs. public school enrollment:
| Here: | 0.0% |
| New Jersey: | 12.3% |
| Here: | 19.6% |
| New Jersey: | 13.1% |
| Here: | 34.0% |
| New Jersey: | 33.2% |


