Beaufort, NC (North Carolina) Houses and Residents
| Beaufort: | $309,245 |
| North Carolina: | $280,600 |
Mean price in 2022:
Detached houses: $462,280
Here: $462,280 State: $375,326 Townhouses or other attached units: $230,235
Here: $230,235 State: $317,935 In 3-to-4-unit structures: $193,430
Here: $193,430 State: $254,939 Mobile homes: $29,071
Here: $29,071 State: $124,933
Total population: 4,195 (Urban population: 3,470 (all inside urban clusters), Rural population: 58 (all nonfarm))
Houses: 3,107 (2,371 occupied: 1,124 owner occupied, 1,263 renter occupied)
| % of renters here: | 53% |
| State: | 33% |
Housing density: 1,132 houses/condos per square mile
Median price asked for vacant for-sale houses and condos in 2022 in this county: $302,862.
Median contract rent in 2022: $666 (lower quartile is $455, upper quartile is $842)
Median rent asked for vacant for-rent units in 2022: $756
Median gross rent in Beaufort, NC in 2022: $788
Housing units in Beaufort with a mortgage: 463 (51 second mortgage, 27 home equity loan, 26 both second mortgage and home equity loan)
Houses without a mortgage: 73
Median household income for houses/condos with a mortgage: $79,073
Median household income for apartments without a mortgage: $51,681
Median monthly housing costs: $764
Compare current foreclosures near Beaufort, NC:
| Photo | Address | Area | Beds / Baths | Price | Details |
|---|---|---|---|---|---|

|
#1
Gull Ct
Beaufort, NC 28516
|
2,016 sq. feet
|
2 baths 3 beds |
show details | |

|
#2
Shell Landing Rd
Beaufort, NC 28516
|
1,784 sq. feet
|
2 baths 3 beds |
show details | |

|
#3
Duffy Rd
Beaufort, NC 28516
|
1,135 sq. feet
|
1 baths 3 beds |
show details | |

|
#4
Mulberry St
Beaufort, NC 28516
|
1,952 sq. feet
|
1 baths 3 beds |
show details | |

|
#5
Nc Highway 101
Beaufort, NC 28516
|
1,460 sq. feet
|
1 baths 3 beds |
show details | |

|
#6
Thurman Rd
Beaufort, NC 28516
|
- sq. feet
|
- baths - beds |
show details | |

|
#7
Issac Murray Dr
Beaufort, NC 28516
|
- sq. feet
|
- baths - beds |
show details | |

|
#8
Broad St
Beaufort, NC 28516
|
- sq. feet
|
- baths - beds |
show details | |

|
#9
Gull Ct
Beaufort, NC 28516
|
- sq. feet
|
- baths - beds |
show details | |

|
#10
Glenda Dr
Beaufort, NC 28516
|
- sq. feet
|
- baths - beds |
show details |
| Photo | Address | Area | Beds / Baths | Price | Details |
|---|---|---|---|---|---|

|
#11
Eastern Ave
Beaufort, NC 28516
|
- sq. feet
|
- baths - beds |
show details | |

|
#12
Croatan Dr
Newport, NC 28570
|
2,060 sq. feet
|
2 baths 3 beds |
show details | |

|
#13
Mill Creek Rd
Newport, NC 28570
|
1,662 sq. feet
|
2 baths 3 beds |
show details | |

|
#14
Secretariat Dr
Havelock, NC 28532
|
936 sq. feet
|
2 baths 3 beds |
show details | |

|
#15
Fairway Dr W
Morehead City, NC 28557
|
1,990 sq. feet
|
2 baths 3 beds |
show details | |

|
#16
Oak Dr
Morehead City, NC 28557
|
2,190 sq. feet
|
2 baths 3 beds |
show details | |

|
#17
Bay View Blvd
Atlantic Beach, NC 28512
|
3,819 sq. feet
|
10 baths 8 beds |
show details | |

|
#18
John Ct
Havelock, NC 28532
|
1,092 sq. feet
|
2 baths 3 beds |
show details | |

|
#19
Colony St
Newport, NC 28570
|
- sq. feet
|
2 baths 3 beds |
show details | |

|
#20
Nc Highway 101
Havelock, NC 28532
|
1,250 sq. feet
|
1 baths - beds |
show details |
| Photo | Address | Area | Beds / Baths | Price | Details |
|---|---|---|---|---|---|

|
#21
Dogwood Cir
Atlantic Beach, NC 28512
|
- sq. feet
|
- baths - beds |
show details | |

|
#22
Country Club Rd Unit C102
Morehead City, NC 28557
|
- sq. feet
|
- baths - beds |
show details | |

|
#23
Wildwood Rd Apt 113
Newport, NC 28570
|
- sq. feet
|
- baths - beds |
show details | |

|
#24
N 35th St Apt 404
Morehead City, NC 28557
|
- sq. feet
|
- baths - beds |
show details | |

|
#25
Cyrus Pollard Rd Lot 6
Newport, NC 28570
|
- sq. feet
|
- baths - beds |
show details | |

|
#26
Hilltop Rd
Newport, NC 28570
|
- sq. feet
|
- baths - beds |
show details | |

|
#27
Quinn Hill Rd
Newport, NC 28570
|
- sq. feet
|
- baths - beds |
show details | |

|
#28
Snowy Egret Dr
Morehead City, NC 28557
|
- sq. feet
|
- baths - beds |
show details | |

|
Check over 1 million property listings on Foreclosure.com!
|
browse all offers | |||

Latest news about housing in Beaufort, NC collected exclusively by city-data.com from local newspapers, TV, and radio stations

 | Permanent Inexpensive Apartments - Ocracoke Island (6 replies) |
| Moving to Morehead - nice, affordable condos and townhomes? (7 replies) |
| Kinston vs New Bern housing (8 replies) |
| Real Estate agent for Beaufort/New Bern (6 replies) |
| Questions about buying a house in Oriental (9 replies) |
| Nc coast homeowners insurance beaufort (4 replies) |

Median year apartment built: 1990
Household type by relationship:
Households: 4,602- Male householders: 920 (341 living alone), Female householders: 1,435 (755 living alone)
733 spouses (700 opposite-sex spouses), 171 unmarried partners, (150 opposite-sex unmarried partners), 677 children (654 natural, 16 adopted, 6 stepchildren), 281 grandchildren, 2 brothers or sisters, 23 parents, 0 foster children, 30 other relatives, 83 non-relatives
- In group quarters: 243
Size of family households: 821 2-persons, 146 3-persons, 71 4-persons, 41 5-persons, 19 6-persons.
Size of nonfamily households: 1,179 1-person, 131 2-persons, 26 3-persons.
239 married couples with children.
316 single-parent households (45 men, 271 women).
97.3% of residents of Beaufort speak English at home.
1.9% of residents speak Spanish at home (78% speak English very well, 7% speak English well, 9% speak English not well, 6% don't speak English at all).
1.0% of residents speak other Indo-European language at home (78% speak English very well, 22% speak English well).
0.3% of residents speak other language at home (100% speak English very well).
Foreign born population: 95 (2.1%)
(50.5% of them are naturalized citizens)
| Here: | 6.7 |
| State: | 6.4 |
| Here: | 4.6 |
| State: | 4.4 |

- Bedrooms in owner-occupied houses and condos in Beaufort, North Carolina
- 5no bedroom
- 01 bedroom
- 2232 bedrooms
- 6163 bedrooms
- 2804 bedrooms
- 05+ bedrooms

- Bedrooms in renter-occupied apartments in Beaufort, North Carolina
- 10no bedroom
- 2991 bedroom
- 7082 bedrooms
- 2323 bedrooms
- 144 bedrooms
- 05+ bedrooms

- Cars and other vehicles available in Beaufort in owner-occupied houses/condos
- 33no vehicle
- 2851 vehicle
- 6632 vehicles
- 1143 vehicles
- 304 vehicles
- 05+ vehicles

- Cars and other vehicles available in Beaufort in renter-occupied apartments
- 123no vehicle
- 7721 vehicle
- 2752 vehicles
- 773 vehicles
- 164 vehicles
- 05+ vehicles

- Rooms in owner-occupied houses in Beaufort, North Carolina
- 51 room
- 02 rooms
- 143 rooms
- 754 rooms
- 1405 rooms
- 1956 rooms
- 3817 rooms
- 1368 rooms
- 1789+ rooms

- Rooms in renter-occupied apartments in Beaufort, North Carolina
- 101 room
- 382 rooms
- 2893 rooms
- 3094 rooms
- 2845 rooms
- 1926 rooms
- 437 rooms
- 828 rooms
- 159+ rooms


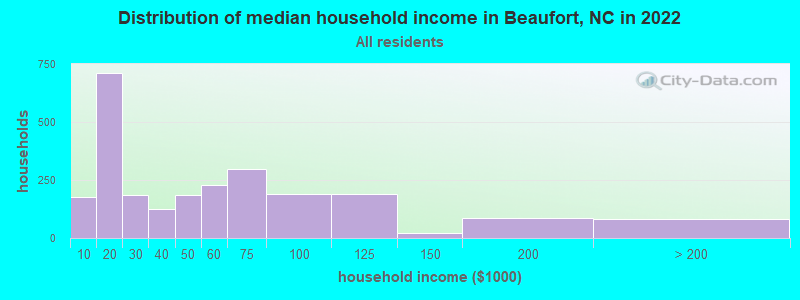
Beaufort, NC household income distribution

- 176Less than $10,000
- 710$10,000 to $19,999
- 184$20,000 to $29,999
- 126$30,000 to $39,999
- 185$40,000 to $49,999
- 230$50,000 to $59,999
- 297$60,000 to $74,999
- 189$75,000 to $99,999
- 188$100,000 to $124,999
- 22$125,000 to $149,999
- 87$150,000 to $199,999
- 81$200,000 or more
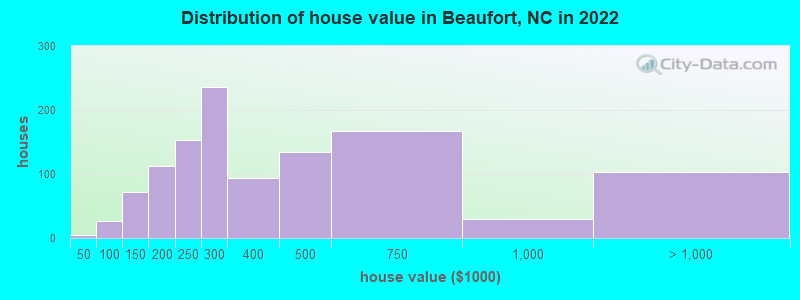
Home value of owner - occupied houses in 2022 in Beaufort, NC
-
- 3Less than $10,000
- 4$60,000 to $69,999
- 13$70,000 to $79,999
- 7$90,000 to $99,999
- 45$100,000 to $124,999
- 25$125,000 to $149,999
- 41$150,000 to $174,999
- 70$175,000 to $199,999
- 153$200,000 to $249,999
- 235$250,000 to $299,999
- 94$300,000 to $399,999
- 134$400,000 to $499,999
- 167$500,000 to $749,999
- 28$750,000 to $999,999
- 41$1,000,000 to $1,499,999
- 15$1,500,000 to $1,999,999
- 46$2,000,000 or more
Rent paid by renters in 2022 in Beaufort, NC
-
- 75Less than $100
- 65$200 to $249
- 14$250 to $299
- 25$300 to $349
- 17$350 to $399
- 55$400 to $449
- 61$450 to $499
- 62$500 to $549
- 24$550 to $599
- 125$600 to $649
- 59$650 to $699
- 28$700 to $749
- 144$750 to $799
- 215$800 to $899
- 129$900 to $999
- 58$1,000 to $1,249
- 13$1,250 to $1,499
- 21$1,500 to $1,999
- 106No cash rent


Percentage of workers working in this county: 97.1%
Number of people working at home: 263 (14.1% of all workers)
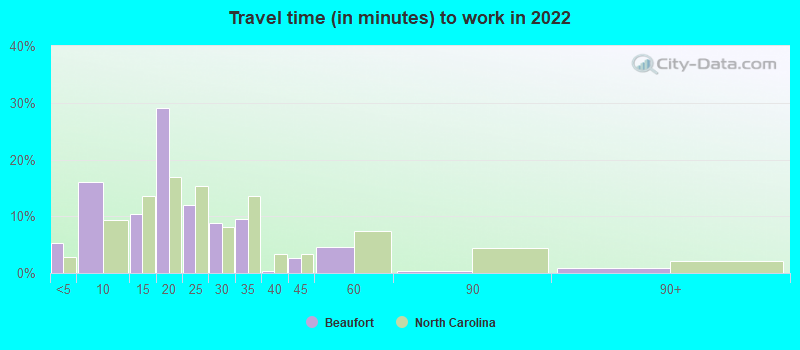
Travel time to work (commute)
- Less than 5 minutes: 103
- 5 to 9 minutes: 361
- 10 to 14 minutes: 176
- 15 to 19 minutes: 315
- 20 to 24 minutes: 291
- 25 to 29 minutes: 148
- 30 to 34 minutes: 66
- 35 to 39 minutes: 0
- 40 to 44 minutes: 0
- 45 to 59 minutes: 0
- 60 to 89 minutes: 12
- 90 or more minutes: 27
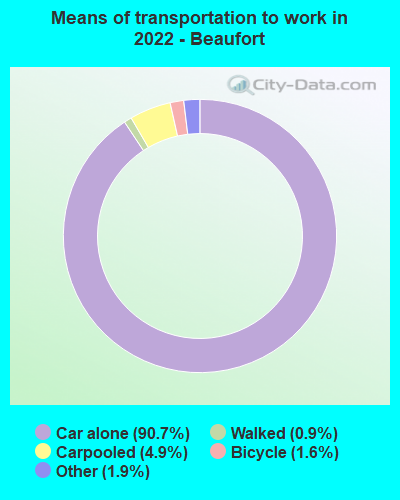
Means of transportation to work:
- Drove a car alone: 2,806 (81.0%)
- Carpooled: 158 (4.6%)
- Taxi: 62 (1.8%)
- Bicycle: 53 (1.5%)
- Walked: 30 (0.9%)
- Worked at home: 263 (7.6%)

- Unemployment by race in 2022
- Unemployment rate for White non-Hispanic residents
- 3.2%Males
- 4.8%Females
- Unemployment rate for Black residents
- 21.6%Females

- Year of entry for the foreign-born population in Beaufort, North Carolina
- 262010 or later
- 202000 to 2009
- 121990 to 1999
- 291980 to 1989
- 311970 to 1979
- 29Before 1970

First ancestries reported:
- English: 395 (17.2%)
- American: 335 (14.5%)
- Irish: 218 (9.5%)
- German: 100 (4.3%)
- Scottish: 75 (3.3%)
- Welsh: 61 (2.6%)
- Scotch-Irish: 46 (2.0%)
- British: 33 (1.4%)
- Canadian: 32 (1.4%)
- Norwegian: 24 (1.0%)
- Swedish: 24 (1.0%)
- Brazilian: 22 (1.0%)
- Italian: 18 (0.8%)
- European: 17 (0.7%)
- Greek: 15 (0.7%)
- Hungarian: 9 (0.4%)
- Dutch: 8 (0.3%)
- French: 8 (0.3%)
- Celtic: 6 (0.3%)
- Polish: 5 (0.2%)
- Swiss: 5 (0.2%)
- Portuguese: 4 (0.2%)
Most common places of birth for foreign-born residents (%):
| Beaufort: | 33.0% (33) |
| North Carolina: | 0.1% (552) |
| Beaufort: | 30.0% (30) |
| North Carolina: | 2.1% (18,105) |
| Beaufort: | 26.0% (26) |
| North Carolina: | 1.0% (8,426) |
| Beaufort: | 13.0% (13) |
| North Carolina: | 24.7% (214,776) |
| Beaufort: | 12.0% (12) |
| North Carolina: | 2.6% (22,964) |
| Beaufort: | 4.0% (4) |
| North Carolina: | 1.2% (10,140) |
Place of birth for U.S.-born residents:
- This state: 2,528
- Other state: 1,838
- Northeast: 582
- Midwest: 469
- South: 747
- West: 60
86.8% of Beaufort residents lived in the same house 1 years ago.
Out of people who lived in different houses, 19.6% lived in this county.
Out of people who lived in different counties, 44.6% lived in North Carolina.
| Beaufort: | 86.8% |
| State average: | 87.3% |
Education attainment for males 25 years and older:
- No schooling: 0
- Nursery to 4th grade: 0
- 5th and 6th grade: 0
- 7th and 8th grade: 11
- 9th grade: 23
- 10th grade: 5
- 11th grade: 0
- 12th grade, no diploma: 30
- High school graduate (or equivalency): 340
- Less than 1 year of college: 99
- Some college more than 1 year, no degree: 284
- Associate degree: 60
- Bachelor's degree: 481
- Master's degree: 79
- Professional school degree: 2
- Doctorate degree: 41

Education attainment for females 25 years and older:
- No schooling: 39
- Nursery to 4th grade: 12
- 5th and 6th grade: 0
- 7th and 8th grade: 48
- 9th grade: 63
- 10th grade: 43
- 11th grade: 136
- 12th grade, no diploma: 24
- High school graduate (or equivalency): 327
- Less than 1 year of college: 121
- Some college more than 1 year, no degree: 349
- Associate degree: 296
- Bachelor's degree: 394
- Master's degree: 144
- Professional school degree: 6
- Doctorate degree: 49


Housing units in structures:
- One, detached: 1,801
- One, attached: 143
- Two: 170
- 3 or 4: 461
- 5 to 9: 204
- 10 to 19: 157
- 20 to 49: 112
- 50 or more: 29
- Mobile homes: 27
Housing units lacking complete kitchen facilities in 2022: 1.1%
House/condo owner moved in on average 7 years ago
Renter moved in on average 2 years ago

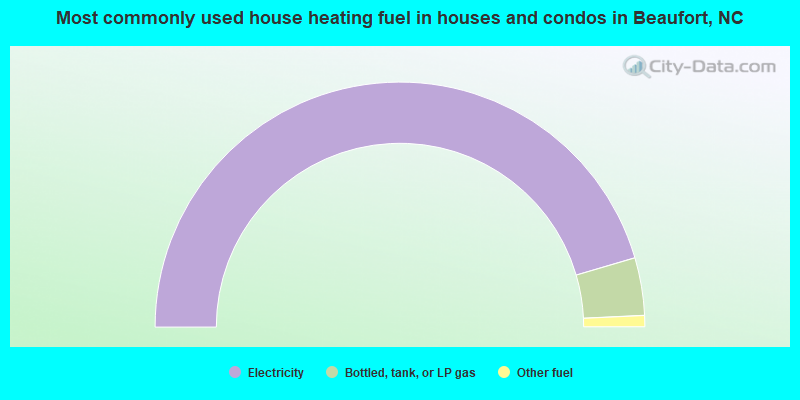
- 90.9%Electricity
- 7.6%Bottled, tank, or LP gas
- 1.5%Other fuel
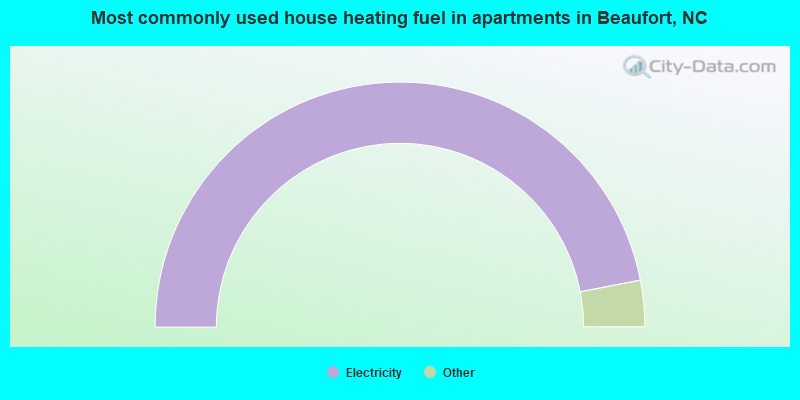
- 93.9%Electricity
- 3.7%No fuel used
- 1.1%Utility gas
- 0.9%Bottled, tank, or LP gas
- 0.4%Fuel oil, kerosene, etc.
Private vs. public school enrollment:
| Here: | 14.6% |
| North Carolina: | 13.8% |
| Here: | 0.0% |
| North Carolina: | 11.9% |
| Here: | 28.1% |
| North Carolina: | 19.3% |


