Beaver Springs, PA (Pennsylvania) Houses and Residents
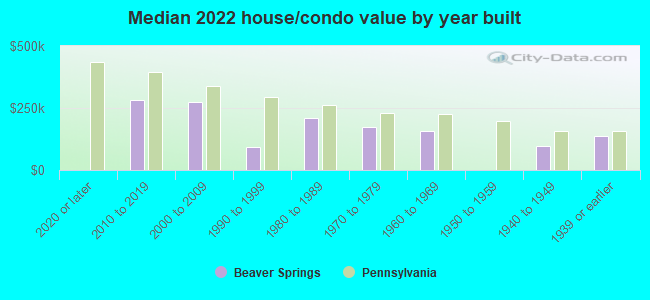
| Beaver Springs: | $139,898 |
| Pennsylvania: | $245,500 |
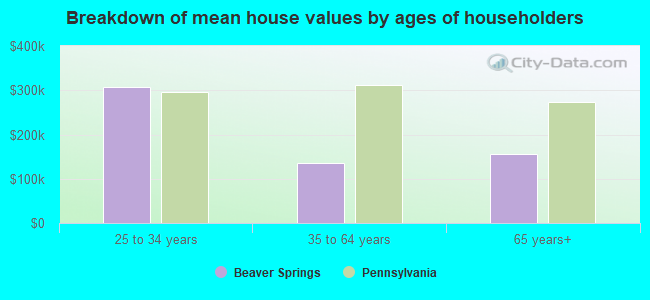
Mean price in 2022:
Detached houses: $155,688
Here: $155,688 State: $317,202 Mobile homes: $181,092
Here: $181,092 State: $92,414
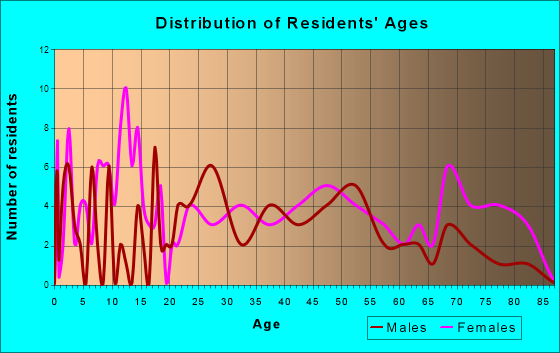
Total population: 674 (Urban population: 0, Rural population: 623 (21 farm, 602 nonfarm))
Houses: 366 (331 occupied: 199 owner occupied, 134 renter occupied)
| % of renters here: | 40% |
| State: | 31% |
Housing density: 148 houses/condos per square mile
Median price asked for vacant for-sale houses and condos in 2022: $953,864.
Median contract rent in 2022: $532 (lower quartile is $460, upper quartile is $670)
Median gross rent in Beaver Springs, PA in 2022: $717
Housing units in Beaver Springs with a mortgage: 113 (6 second mortgage, 0 home equity loan, 6 both second mortgage and home equity loan)
Houses without a mortgage: 8
Median household income for houses/condos with a mortgage: $97,895
Median household income for apartments without a mortgage: $42,238
Median monthly housing costs: $762
Compare current foreclosures near Beaver Springs, PA:
| Photo | Address | Area | Beds / Baths | Price | Details |
|---|---|---|---|---|---|

|
#1
Snyder Ave
Beaver Springs, PA 17812
|
- sq. feet
|
- baths - beds |
show details | |

|
#2
Route 522
Mc Clure, PA 17841
|
- sq. feet
|
1 baths 3 beds |
show details | |

|
#3
Merand Ln
Mifflinburg, PA 17844
|
1,565 sq. feet
|
2 baths 3 beds |
show details | |

|
#4
Bull Run Rd
Rebersburg, PA 16872
|
- sq. feet
|
2 baths 3 beds |
show details | |

|
#5
N Pine St
Liverpool, PA 17045
|
- sq. feet
|
2 baths 2 beds |
show details | |

|
#6
Center Rd
Mifflintown, PA 17059
|
- sq. feet
|
- baths - beds |
show details | |

|
#7
Pines Dr
Millerstown, PA 17062
|
780 sq. feet
|
- baths - beds |
show details | |

|
#8
East Main Street
Millheim, PA 16854
|
- sq. feet
|
- baths - beds |
show details | |

|
#9
Thomas St
Mifflinburg, PA 17844
|
- sq. feet
|
- baths - beds |
show details | |

|
#10
Back Maitland Rd
Mc Clure, PA 17841
|
- sq. feet
|
- baths - beds |
show details |
| Photo | Address | Area | Beds / Baths | Price | Details |
|---|---|---|---|---|---|

|
#11
Back Maitland Rd
Mc Clure, PA 17841
|
1,360 sq. feet
|
- baths - beds |
show details | |

|
#12
Lexi St
Mifflintown, PA 17059
|
- sq. feet
|
- baths - beds |
show details | |

|
#13
Lower Benner St
Thompsontown, PA 17094
|
- sq. feet
|
- baths - beds |
show details | |

|
#14
Aspen St
Mifflinburg, PA 17844
|
- sq. feet
|
- baths - beds |
show details | |

|
#15
Valley View Rd
Millerstown, PA 17062
|
1,120 sq. feet
|
- baths - beds |
show details | |

|
#16
Snook Rd
Mc Clure, PA 17841
|
- sq. feet
|
- baths - beds |
show details | |

|
#17
Stull Rd
Mc Clure, PA 17841
|
- sq. feet
|
- baths - beds |
show details | |

|
#18
Hosterman Gap Rd
Aaronsburg, PA 16820
|
- sq. feet
|
- baths - beds |
show details | |

|
#19
W Juniata Pkwy
Millerstown, PA 17062
|
- sq. feet
|
- baths - beds |
show details | |

|
#20
Shade St
Mc Clure, PA 17841
|
- sq. feet
|
- baths - beds |
show details |
| Photo | Address | Area | Beds / Baths | Price | Details |
|---|---|---|---|---|---|

|
#21
Green Ridge Rd
Mifflinburg, PA 17844
|
- sq. feet
|
- baths - beds |
show details | |

|
#22
Hawk Ln
Selinsgrove, PA 17870
|
- sq. feet
|
- baths - beds |
show details | |

|
#23
E Main St
Millheim, PA 16854
|
- sq. feet
|
- baths - beds |
show details | |

|
#24
Motter Ln
New Berlin, PA 17855
|
- sq. feet
|
- baths - beds |
show details | |

|
#25
S Zeller St
Mc Clure, PA 17841
|
- sq. feet
|
- baths - beds |
show details | |

|
#26
S Hill Dr
Middleburg, PA 17842
|
- sq. feet
|
- baths - beds |
show details | |

|
#27
Motter Ln
New Berlin, PA 17855
|
- sq. feet
|
- baths - beds |
show details | |

|
#28
S New Market St
Freeburg, PA 17827
|
- sq. feet
|
- baths - beds |
show details | |

|
#29
Route 522
Mc Clure, PA 17841
|
- sq. feet
|
- baths - beds |
show details | |

|
#30
Dogwood Dr
Middleburg, PA 17842
|
- sq. feet
|
- baths - beds |
show details |
| Photo | Address | Area | Beds / Baths | Price | Details |
|---|---|---|---|---|---|

|
#31
Us Highway 522 N
Mc Clure, PA 17841
|
- sq. feet
|
- baths - beds |
show details | |

|
#32
E Ohio St
Mc Clure, PA 17841
|
- sq. feet
|
- baths - beds |
show details | |

|
#33
Schoch St
Middleburg, PA 17842
|
- sq. feet
|
- baths - beds |
show details | |

|
#34
Kline Hill Rd
Mc Clure, PA 17841
|
- sq. feet
|
- baths - beds |
show details | |

|
#35
State Route 304
Mifflinburg, PA 17844
|
- sq. feet
|
- baths - beds |
show details | |

|
Check over 1 million property listings on Foreclosure.com!
|
browse all offers | |||


 | Tell me please, about rural central-ish PA living ideas (8 replies) |
| Lewisburg (15 replies) |
Median year apartment built: 1952
Household type by relationship:
Households: 729- Male householders: 159 (71 living alone), Female householders: 167 (48 living alone)
113 spouses (113 opposite-sex spouses), 34 unmarried partners, (34 opposite-sex unmarried partners), 178 children (134 natural, 6 adopted, 36 stepchildren), 2 grandchildren, 5 brothers or sisters, 0 parents, 0 foster children, 9 other relatives, 54 non-relatives
Size of family households: 67 2-persons, 27 3-persons, 26 4-persons, 16 5-persons, 6 6-persons, 9 7-or-more-persons.
Size of nonfamily households: 124 1-person, 59 2-persons.
110 married couples with children.
39 single-parent households (7 men, 32 women).
94.8% of residents of Beaver Springs speak English at home.
4.5% of residents speak Spanish at home (71% speak English very well, 10% speak English not well, 19% don't speak English at all).
0.7% of residents speak other Indo-European language at home (40% speak English very well, 60% speak English well).
Foreign born population: 2 (0.3%)
(100.0% of them are naturalized citizens)
| Here: | 7.3 |
| State: | 6.8 |
| Here: | 4.4 |
| State: | 4.3 |
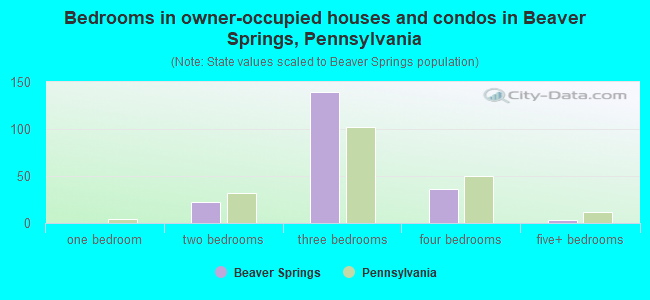
- Bedrooms in owner-occupied houses and condos in Beaver Springs, Pennsylvania
- 0no bedroom
- 01 bedroom
- 222 bedrooms
- 1393 bedrooms
- 364 bedrooms
- 35+ bedrooms
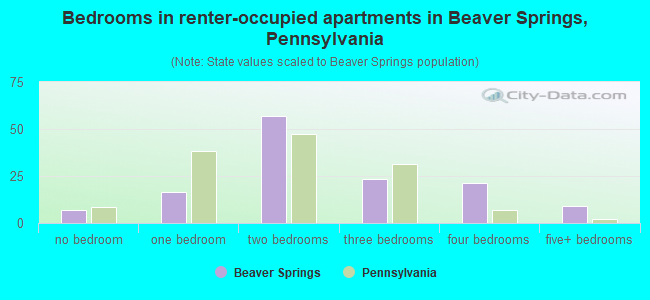
- Bedrooms in renter-occupied apartments in Beaver Springs, Pennsylvania
- 7no bedroom
- 161 bedroom
- 572 bedrooms
- 233 bedrooms
- 214 bedrooms
- 95+ bedrooms
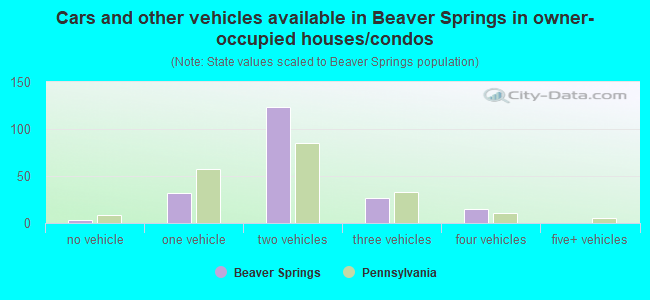
- Cars and other vehicles available in Beaver Springs in owner-occupied houses/condos
- 3no vehicle
- 321 vehicle
- 1232 vehicles
- 273 vehicles
- 154 vehicles
- 05+ vehicles
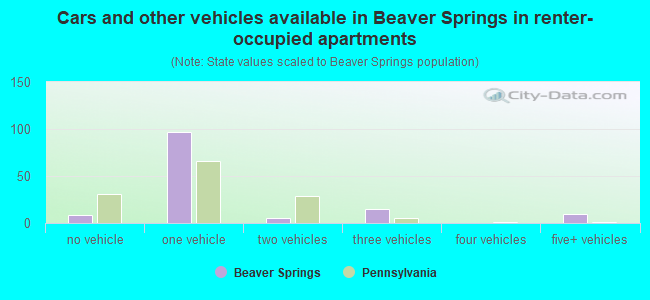
- Cars and other vehicles available in Beaver Springs in renter-occupied apartments
- 8no vehicle
- 971 vehicle
- 52 vehicles
- 153 vehicles
- 04 vehicles
- 95+ vehicles
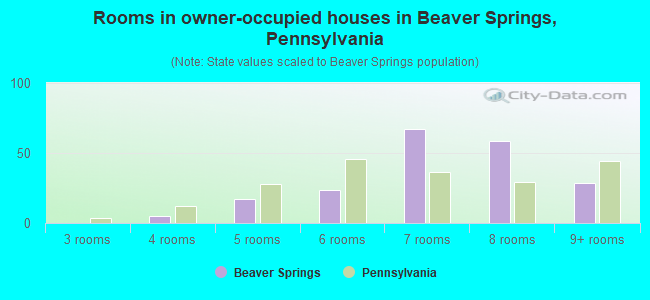
- Rooms in owner-occupied houses in Beaver Springs, Pennsylvania
- 01 room
- 02 rooms
- 03 rooms
- 54 rooms
- 175 rooms
- 236 rooms
- 677 rooms
- 588 rooms
- 299+ rooms
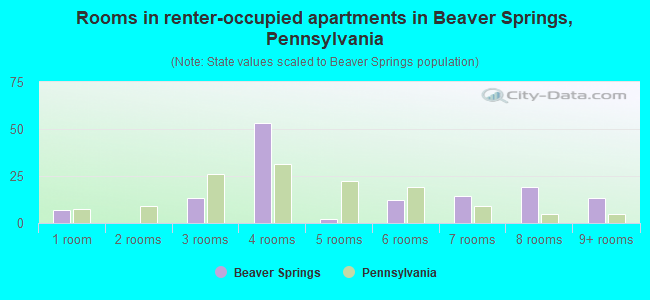
- Rooms in renter-occupied apartments in Beaver Springs, Pennsylvania
- 71 room
- 02 rooms
- 133 rooms
- 534 rooms
- 25 rooms
- 126 rooms
- 147 rooms
- 198 rooms
- 139+ rooms
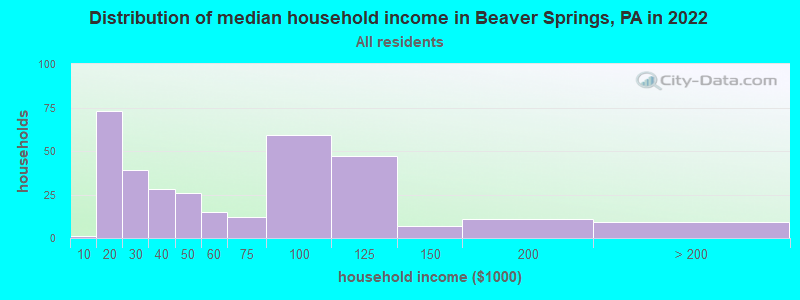
Beaver Springs, PA household income distribution

- 1Less than $10,000
- 73$10,000 to $19,999
- 39$20,000 to $29,999
- 28$30,000 to $39,999
- 26$40,000 to $49,999
- 15$50,000 to $59,999
- 12$60,000 to $74,999
- 59$75,000 to $99,999
- 47$100,000 to $124,999
- 7$125,000 to $149,999
- 11$150,000 to $199,999
- 9$200,000 or more
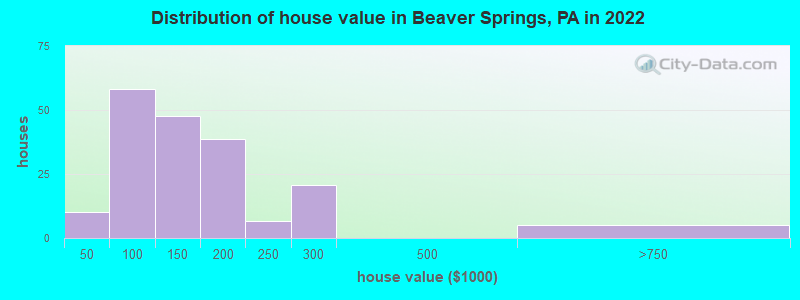
Home value of owner - occupied houses in 2022 in Beaver Springs, PA
-
- 3$10,000 to $14,999
- 3$15,000 to $19,999
- 3$40,000 to $49,999
- 2$70,000 to $79,999
- 51$80,000 to $89,999
- 1$90,000 to $99,999
- 23$100,000 to $124,999
- 24$125,000 to $149,999
- 22$150,000 to $174,999
- 16$175,000 to $199,999
- 6$200,000 to $249,999
- 20$250,000 to $299,999
- 5$500,000 to $749,999
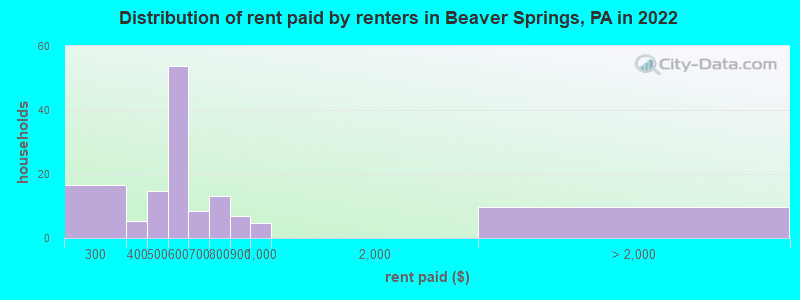
Rent paid by renters in 2022 in Beaver Springs, PA
-
- 4$200 to $249
- 12$250 to $299
- 3$300 to $349
- 1$350 to $399
- 3$400 to $449
- 11$450 to $499
- 44$500 to $549
- 9$550 to $599
- 3$600 to $649
- 4$650 to $699
- 3$700 to $749
- 9$750 to $799
- 6$800 to $899
- 4$900 to $999
- 9No cash rent
Percentage of workers working in this county: 62.3%
Number of people working at home: 3 (1.0% of all workers)
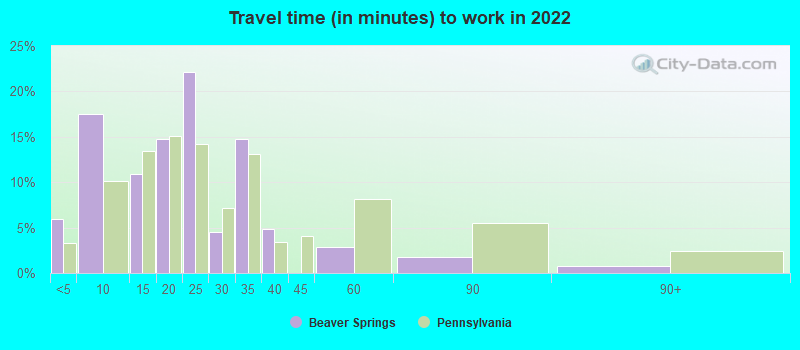
Travel time to work (commute)
- Less than 5 minutes: 32
- 5 to 9 minutes: 39
- 10 to 14 minutes: 12
- 15 to 19 minutes: 31
- 20 to 24 minutes: 16
- 25 to 29 minutes: 45
- 30 to 34 minutes: 12
- 35 to 39 minutes: 2
- 40 to 44 minutes: 18
- 45 to 59 minutes: 24
- 60 to 89 minutes: 42
- 90 or more minutes: 10
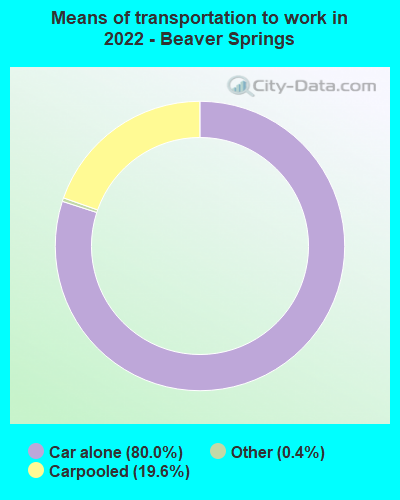
Means of transportation to work:
- Drove a car alone: 391 (77.0%)
- Carpooled: 95 (18.7%)
- Taxi: 2 (0.4%)
- Worked at home: 3 (0.6%)
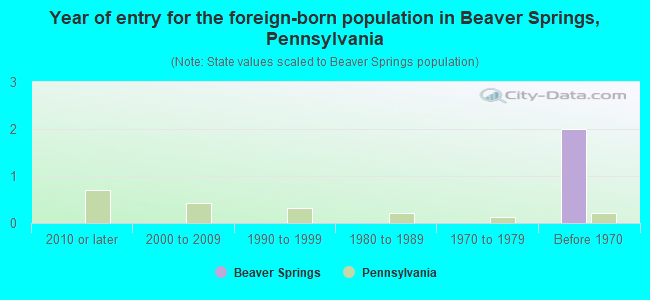
- Year of entry for the foreign-born population in Beaver Springs, Pennsylvania
- 02010 or later
- 02000 to 2009
- 01990 to 1999
- 01980 to 1989
- 01970 to 1979
- 2Before 1970
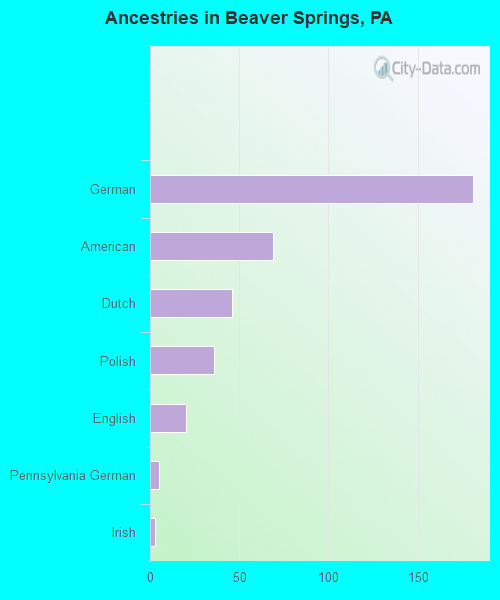
First ancestries reported:
- German: 181 (44.5%)
- American: 69 (17.0%)
- Dutch: 46 (11.3%)
- Polish: 36 (8.9%)
- English: 20 (4.9%)
- Pennsylvania German: 5 (1.2%)
- Irish: 3 (0.7%)
- Swiss: 1 (0.2%)
- Welsh: 1 (0.2%)
Most common places of birth for foreign-born residents (%):
| Beaver Springs: | 50.0% (1) |
| Pennsylvania: | 0.2% (1,902) |
Place of birth for U.S.-born residents:
- This state: 644
- Other state: 68
- Northeast: 19
- Midwest: 20
- South: 28
- West: 0
92.4% of Beaver Springs residents lived in the same house 1 years ago.
Out of people who lived in different houses, 46.8% lived in this county.
Out of people who lived in different counties, 60.0% lived in Pennsylvania.
| Beaver Springs: | 92.4% |
| State average: | 89.3% |
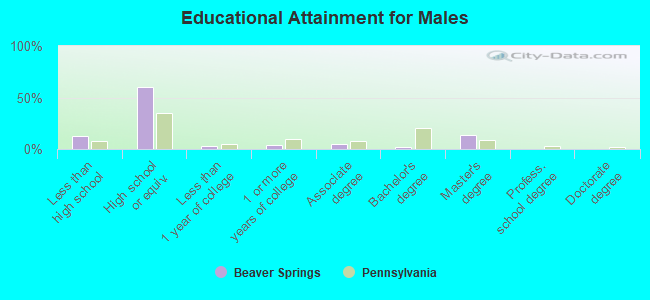
Education attainment for males 25 years and older:
- No schooling: 4
- Nursery to 4th grade: 1
- 5th and 6th grade: 0
- 7th and 8th grade: 8
- 9th grade: 0
- 10th grade: 10
- 11th grade: 5
- 12th grade, no diploma: 4
- High school graduate (or equivalency): 158
- Less than 1 year of college: 7
- Some college more than 1 year, no degree: 11
- Associate degree: 13
- Bachelor's degree: 6
- Master's degree: 35
- Professional school degree: 0
- Doctorate degree: 0
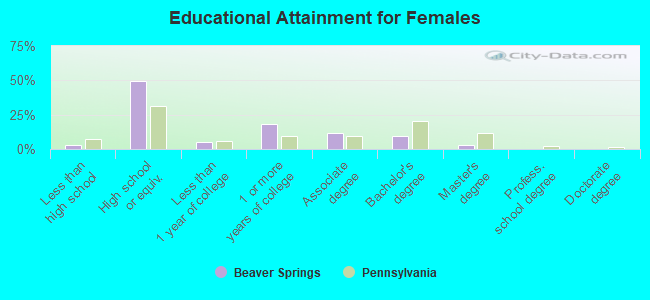
Education attainment for females 25 years and older:
- No schooling: 0
- Nursery to 4th grade: 0
- 5th and 6th grade: 0
- 7th and 8th grade: 0
- 9th grade: 0
- 10th grade: 2
- 11th grade: 6
- 12th grade, no diploma: 0
- High school graduate (or equivalency): 130
- Less than 1 year of college: 13
- Some college more than 1 year, no degree: 48
- Associate degree: 30
- Bachelor's degree: 24
- Master's degree: 8
- Professional school degree: 0
- Doctorate degree: 0
Housing units in structures:
- One, detached: 295
- One, attached: 8
- Two: 15
- 3 or 4: 16
- 5 to 9: 2
- 20 to 49: 3
- Mobile homes: 27
Median worth of mobile homes: $179,744
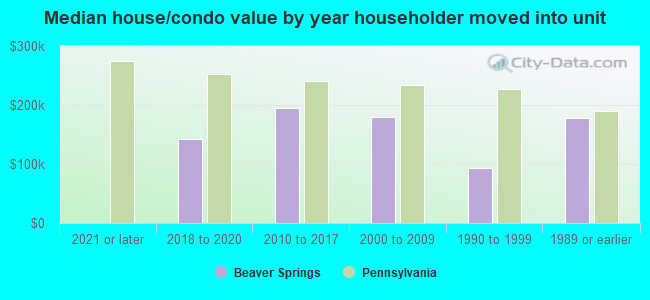
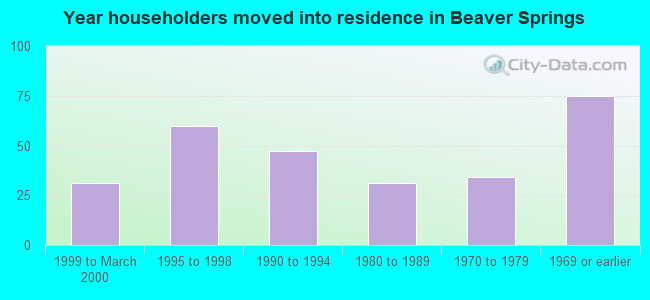
House/condo owner moved in on average 23 years ago
Renter moved in on average 7 years ago
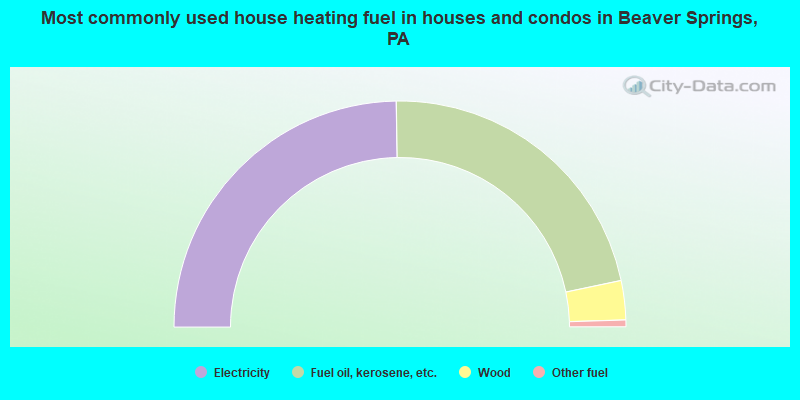
- 49.5%Electricity
- 43.9%Fuel oil, kerosene, etc.
- 5.6%Wood
- 1.0%Other fuel
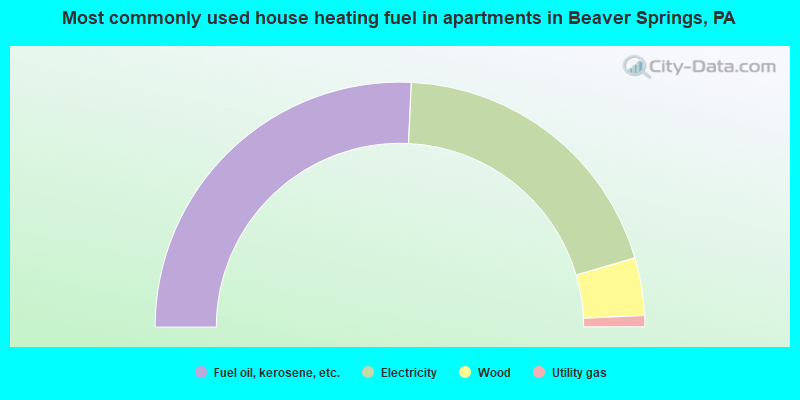
- 51.5%Fuel oil, kerosene, etc.
- 39.4%Electricity
- 7.6%Wood
- 1.5%Utility gas
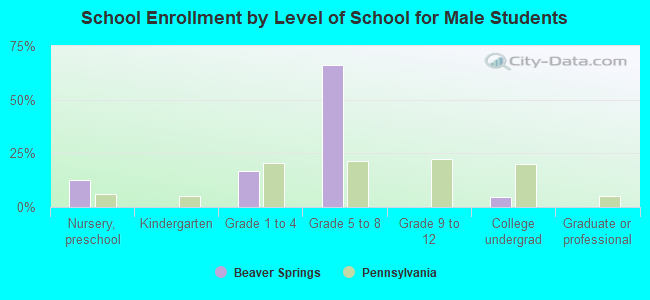
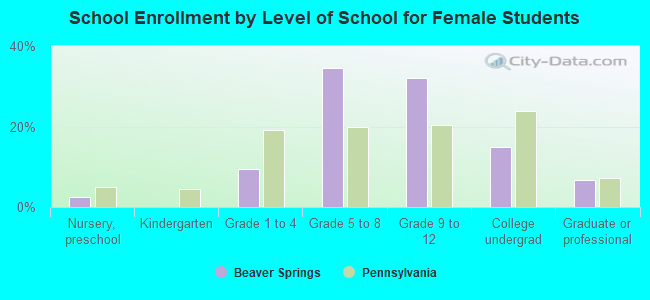
Private vs. public school enrollment:
| Here: | 18.8% |
| Pennsylvania: | 15.7% |
| Here: | 0.0% |
| Pennsylvania: | 13.4% |
| Here: | 26.7% |
| Pennsylvania: | 39.8% |