Beavercreek, OH (Ohio) Houses and Residents
| Beavercreek: | $275,204 |
| Ohio: | $204,100 |
Total population: 45,934 (Urban population: 36,979, Rural population: 1,204 (17 farm, 1,187 nonfarm))
Houses: 20,325 (19,159 occupied: 13,775 owner occupied, 5,042 renter occupied)
| % of renters here: | 27% |
| State: | 33% |
Housing density: 770 houses/condos per square mile
Median price asked for vacant for-sale houses and condos in 2022: $123,834.
Median contract rent in 2022: $1,187 (lower quartile is $972, upper quartile is $1,436)
Median rent asked for vacant for-rent units in 2022: $1,214
Median gross rent in Beavercreek, OH in 2022: $1,315
Housing units in Beavercreek with a mortgage: 8,461 (993 second mortgage, 0 home equity loan, 944 both second mortgage and home equity loan)
Houses without a mortgage: 269
Median household income for houses/condos with a mortgage: $143,768
Median household income for apartments without a mortgage: $120,203
Median monthly housing costs: $1,322
Compare current foreclosures near Beavercreek, OH:
| Photo | Address | Area | Beds / Baths | Price | Details |
|---|---|---|---|---|---|

|
#1
Arthur Rd
Springfield, OH 45502
|
2,204 sq. feet
|
2 baths 3 beds |
$354,900
|
show details |

|
#2
Cherry Dr
Dayton, OH 45405
|
1,260 sq. feet
|
1 baths 3 beds |
$57,200
|
show details |

|
#3
Alexandersville Bell
Dayton, OH 45449
|
1,669 sq. feet
|
2 baths 3 beds |
$148,500
|
show details |

|
#4
Sparks St
Dayton, OH 45426
|
1,100 sq. feet
|
1 baths 3 beds |
$159,900
|
show details |

|
#5
Ketcham St
Dayton, OH 45431
|
1,107 sq. feet
|
2 baths 3 beds |
show details | |

|
#6
Norville Ct
Dayton, OH 45417
|
1,100 sq. feet
|
1 baths 2 beds |
show details | |

|
#7
Milo Rd
Dayton, OH 45414
|
988 sq. feet
|
1 baths 4 beds |
show details | |

|
#8
E Bruce Ave
Dayton, OH 45405
|
1,470 sq. feet
|
2 baths 3 beds |
show details | |

|
#9
Forest Ridge Blvd
Dayton, OH 45424
|
1,898 sq. feet
|
2 baths 4 beds |
show details | |

|
#10
S Lutheran Church Rd
New Lebanon, OH 45345
|
1,640 sq. feet
|
1 baths 2 beds |
show details |
| Photo | Address | Area | Beds / Baths | Price | Details |
|---|---|---|---|---|---|

|
#11
N Snyder Rd
Dayton, OH 45426
|
1,142 sq. feet
|
1 baths 4 beds |
show details | |

|
#12
Frahn Ave
Fairborn, OH 45324
|
1,578 sq. feet
|
2 baths 3 beds |
show details | |

|
#13
Cambridge Dr
Springboro, OH 45066
|
2,152 sq. feet
|
3 baths 4 beds |
show details | |

|
#14
W Floyd Ave
Dayton, OH 45415
|
2,487 sq. feet
|
2 baths 4 beds |
show details | |

|
#15
Pioneer St
Dayton, OH 45405
|
1,218 sq. feet
|
1 baths 3 beds |
show details | |

|
#16
Merrywood Dr
Englewood, OH 45322
|
1,827 sq. feet
|
2 baths 4 beds |
show details | |

|
#17
Utica Dr
Dayton, OH 45439
|
1,040 sq. feet
|
1 baths 3 beds |
show details | |

|
#18
Us Route 68 S
Xenia, OH 45385
|
- sq. feet
|
3 baths 4 beds |
show details | |

|
#19
W Main St
Dayton, OH 45449
|
1,037 sq. feet
|
1 baths 2 beds |
show details | |

|
#20
W Main St
Dayton, OH 45449
|
940 sq. feet
|
1 baths 2 beds |
show details |
| Photo | Address | Area | Beds / Baths | Price | Details |
|---|---|---|---|---|---|

|
#21
S Patterson Blvd
Dayton, OH 45409
|
1,408 sq. feet
|
2 baths 3 beds |
show details | |

|
#22
Burleigh Ave
Dayton, OH 45417
|
834 sq. feet
|
1 baths 2 beds |
show details | |

|
#23
Sandpiper Ln
Dayton, OH 45424
|
2,088 sq. feet
|
2 baths 4 beds |
show details | |

|
#24
Collins Ct
Dayton, OH 45439
|
1,425 sq. feet
|
2 baths 2 beds |
show details | |

|
#25
Glenwood Way
Dayton, OH 45440
|
3,625 sq. feet
|
3 baths 4 beds |
show details | |

|
#26
Lakeview Ave
Dayton, OH 45417
|
1,290 sq. feet
|
2 baths 3 beds |
show details | |

|
#27
Hillway Dr
Dayton, OH 45405
|
1,344 sq. feet
|
1 baths 3 beds |
show details | |

|
#28
Jenny Marie Dr
Xenia, OH 45385
|
1,710 sq. feet
|
2 baths 3 beds |
show details | |

|
#29
Ridgebury Dr
Dayton, OH 45440
|
1,120 sq. feet
|
1 baths 3 beds |
show details | |

|
#30
E Lindsey Ave
Miamisburg, OH 45342
|
1,161 sq. feet
|
1 baths 3 beds |
show details |
| Photo | Address | Area | Beds / Baths | Price | Details |
|---|---|---|---|---|---|

|
#31
Phyllis Ave
Dayton, OH 45431
|
1,276 sq. feet
|
1 baths 3 beds |
show details | |

|
#32
Malvern Ave
Dayton, OH 45406
|
1,676 sq. feet
|
1 baths 5 beds |
show details | |

|
#33
Santa Cruz Ave
Dayton, OH 45410
|
1,248 sq. feet
|
1 baths 2 beds |
show details | |

|
#34
Dorf Dr
Dayton, OH 45439
|
1,066 sq. feet
|
2 baths 3 beds |
show details | |

|
#35
Deville Dr
Dayton, OH 45415
|
1,994 sq. feet
|
2 baths 4 beds |
show details | |

|
#36
Spinning Rd
Dayton, OH 45431
|
2,024 sq. feet
|
1 baths 4 beds |
show details | |

|
#37
Newgate Ave
Dayton, OH 45420
|
1,050 sq. feet
|
1 baths 3 beds |
show details | |

|
#38
Willowwood Dr
Dayton, OH 45405
|
1,992 sq. feet
|
2 baths 4 beds |
show details | |

|
#39
Carrilon Woods Dr
Dayton, OH 45458
|
3,668 sq. feet
|
3 baths 4 beds |
show details | |

|
#40
Glenbrook Dr
Dayton, OH 45406
|
1,333 sq. feet
|
2 baths 3 beds |
show details |
| Photo | Address | Area | Beds / Baths | Price | Details |
|---|---|---|---|---|---|

|
#41
Shaunee Creek Dr
Dayton, OH 45415
|
1,568 sq. feet
|
3 baths 2 beds |
show details | |

|
#42
Cheviot Hills Ln
Vandalia, OH 45377
|
3,096 sq. feet
|
3 baths 3 beds |
show details | |

|
#43
Evansville Ave
Dayton, OH 45406
|
1,856 sq. feet
|
2 baths 3 beds |
show details | |

|
#44
Sugartree Dr
Dayton, OH 45414
|
988 sq. feet
|
1 baths 2 beds |
show details | |

|
#45
Mound St
Dayton, OH 45402
|
1,726 sq. feet
|
2 baths 4 beds |
show details | |

|
#46
Parrot St
Dayton, OH 45410
|
- sq. feet
|
- baths - beds |
$9,750
|
show details |

|
#47
Hackett Dr
Dayton, OH 45417
|
1,185 sq. feet
|
1 baths 3 beds |
show details | |

|
#48
S Monmouth St
Dayton, OH 45403
|
1,132 sq. feet
|
1 baths 2 beds |
show details | |

|
#49
W 2nd St
Dayton, OH 45402
|
1,784 sq. feet
|
1 baths 3 beds |
show details | |

|
Check over 1 million property listings on Foreclosure.com!
|
browse all offers | |||

Latest news about housing in Beavercreek, OH collected exclusively by city-data.com from local newspapers, TV, and radio stations

 | Home Inspector in Beavercreek Area? (4 replies) |
| Research Park Proposed Apartments - School District? (2 replies) |
| Relocating from FL, need to find rental homes (24 replies) |
| Military first home buyer: Can you rent a $300K home? (12 replies) |
| Suggest Apartment communities in Dayton for rental (work location will be Sidney) (16 replies) |
| Apartment/Townhouse Rentals (3 replies) |

Median year apartment built: 2003
Household type by relationship:
Households: 46,823- Male householders: 11,099 (2,239 living alone), Female householders: 7,891 (2,709 living alone)
10,726 spouses (10,619 opposite-sex spouses), 1,049 unmarried partners, (1,014 opposite-sex unmarried partners), 12,562 children (11,667 natural, 241 adopted, 653 stepchildren), 630 grandchildren, 159 brothers or sisters, 403 parents, 9 foster children, 455 other relatives, 1,369 non-relatives
- In group quarters: 466
Size of family households: 5,847 2-persons, 2,195 3-persons, 2,722 4-persons, 736 5-persons, 606 6-persons, 131 7-or-more-persons.
Size of nonfamily households: 5,622 1-person, 769 2-persons, 198 3-persons, 74 4-persons, 17 7-or-more-persons.
7,902 married couples with children.
1,354 single-parent households (844 men, 510 women).
92.9% of residents of Beavercreek speak English at home.
1.8% of residents speak Spanish at home (78% speak English very well, 17% speak English well, 5% speak English not well).
3.1% of residents speak other Indo-European language at home (72% speak English very well, 23% speak English well, 4% speak English not well, 1% don't speak English at all).
1.7% of residents speak Asian or Pacific Island language at home (60% speak English very well, 35% speak English well, 1% speak English not well, 4% don't speak English at all).
0.5% of residents speak other language at home (82% speak English very well, 18% speak English well).
Foreign born population: 2,287 (4.9%)
(67.5% of them are naturalized citizens)
| Here: | 7.9 |
| State: | 6.7 |
| Here: | 4.1 |
| State: | 4.4 |

- Bedrooms in owner-occupied houses and condos in Beavercreek, Ohio
- 15no bedroom
- 491 bedroom
- 9862 bedrooms
- 6,1883 bedrooms
- 5,5134 bedrooms
- 1,0255+ bedrooms

- Bedrooms in renter-occupied apartments in Beavercreek, Ohio
- 120no bedroom
- 1,0241 bedroom
- 2,1372 bedrooms
- 1,3893 bedrooms
- 2354 bedrooms
- 1385+ bedrooms

- Cars and other vehicles available in Beavercreek in owner-occupied houses/condos
- 118no vehicle
- 2,9271 vehicle
- 5,7272 vehicles
- 3,3003 vehicles
- 1,3354 vehicles
- 3705+ vehicles

- Cars and other vehicles available in Beavercreek in renter-occupied apartments
- 359no vehicle
- 2,1371 vehicle
- 2,0462 vehicles
- 4053 vehicles
- 964 vehicles
- 05+ vehicles

- Rooms in owner-occupied houses in Beavercreek, Ohio
- 151 room
- 02 rooms
- 343 rooms
- 2794 rooms
- 1,7785 rooms
- 1,9876 rooms
- 2,6587 rooms
- 2,5418 rooms
- 4,4849+ rooms

- Rooms in renter-occupied apartments in Beavercreek, Ohio
- 1201 room
- 4372 rooms
- 9413 rooms
- 1,4704 rooms
- 7595 rooms
- 4686 rooms
- 3187 rooms
- 2708 rooms
- 2599+ rooms


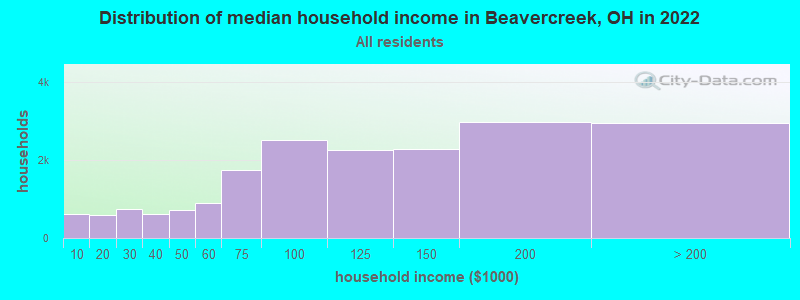
Beavercreek, OH household income distribution

- 609Less than $10,000
- 593$10,000 to $19,999
- 746$20,000 to $29,999
- 618$30,000 to $39,999
- 726$40,000 to $49,999
- 897$50,000 to $59,999
- 1,747$60,000 to $74,999
- 2,505$75,000 to $99,999
- 2,245$100,000 to $124,999
- 2,280$125,000 to $149,999
- 2,969$150,000 to $199,999
- 2,955$200,000 or more
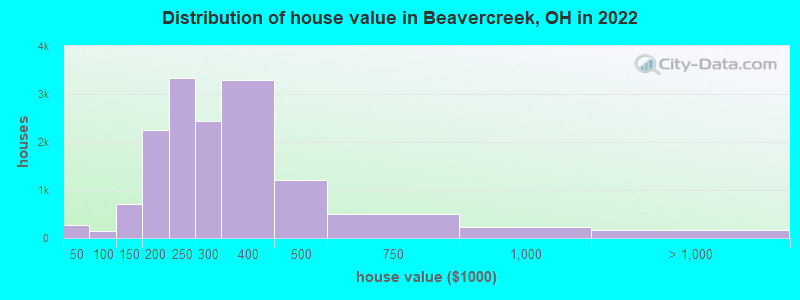
Home value of owner - occupied houses in 2022 in Beavercreek, OH
-
- 41Less than $10,000
- 18$10,000 to $14,999
- 39$15,000 to $19,999
- 26$20,000 to $24,999
- 77$25,000 to $29,999
- 7$30,000 to $34,999
- 18$35,000 to $39,999
- 39$40,000 to $49,999
- 12$60,000 to $69,999
- 40$70,000 to $79,999
- 43$90,000 to $99,999
- 298$100,000 to $124,999
- 414$125,000 to $149,999
- 1,114$150,000 to $174,999
- 1,135$175,000 to $199,999
- 3,329$200,000 to $249,999
- 2,439$250,000 to $299,999
- 3,287$300,000 to $399,999
- 1,217$400,000 to $499,999
- 493$500,000 to $749,999
- 219$750,000 to $999,999
- 9$1,000,000 to $1,499,999
- 13$1,500,000 to $1,999,999
- 137$2,000,000 or more
Rent paid by renters in 2022 in Beavercreek, OH
-
- 23Less than $100
- 68$200 to $249
- 11$250 to $299
- 7$300 to $349
- 11$350 to $399
- 57$450 to $499
- 8$500 to $549
- 38$550 to $599
- 39$600 to $649
- 28$650 to $699
- 72$700 to $749
- 96$750 to $799
- 212$800 to $899
- 737$900 to $999
- 1,478$1,000 to $1,249
- 1,656$1,250 to $1,499
- 251$1,500 to $1,999
- 199$2,000 to $2,499
- 55$2,500 to $2,999
- 13$3,500 or more
- 264No cash rent


Percentage of workers working in this county: 60.5%
Number of people working at home: 3,730 (15.7% of all workers)
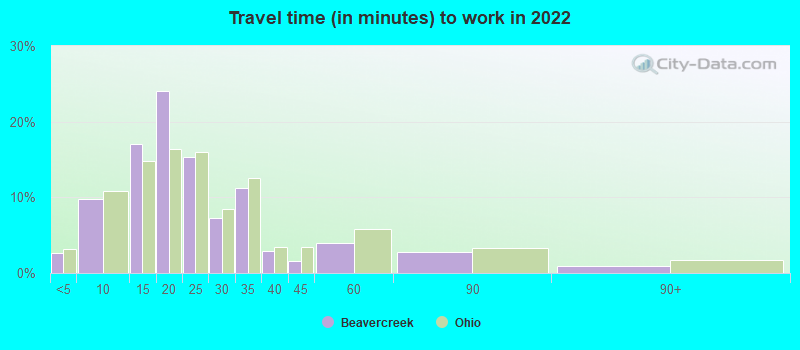
Travel time to work (commute)
- Less than 5 minutes: 593
- 5 to 9 minutes: 2,082
- 10 to 14 minutes: 4,083
- 15 to 19 minutes: 5,352
- 20 to 24 minutes: 3,012
- 25 to 29 minutes: 1,535
- 30 to 34 minutes: 1,442
- 35 to 39 minutes: 347
- 40 to 44 minutes: 226
- 45 to 59 minutes: 713
- 60 to 89 minutes: 515
- 90 or more minutes: 342
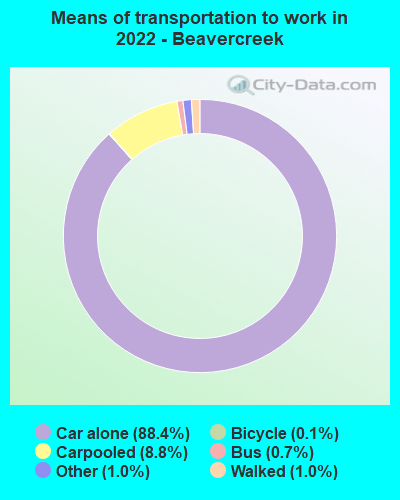
Means of transportation to work:
- Drove a car alone: 19,959 (75.6%)
- Carpooled: 2,130 (8.1%)
- Bus: 136 (0.5%)
- Subway or elevated rail: 6 (0.0%)
- Taxi: 276 (1.0%)
- Bicycle: 29 (0.1%)
- Walked: 222 (0.8%)
- Worked at home: 3,730 (14.1%)

- Unemployment by race in 2022
- Unemployment rate for White non-Hispanic residents
- 2.1%Males
- 1.7%Females
- Unemployment rate for Black residents
- 5.8%Males
- Unemployment rate for Asian residents
- 8.8%Females
- Unemployment rate for other race residents
- 10.5%Females
- Unemployment rate for Hispanic or Latino residents
- 2.7%Females

- Year of entry for the foreign-born population in Beavercreek, Ohio
- 9242010 or later
- 6062000 to 2009
- 2881990 to 1999
- 3581980 to 1989
- 4171970 to 1979
- 395Before 1970

First ancestries reported:
- German: 4,090 (20.1%)
- English: 2,992 (14.7%)
- American: 2,879 (14.1%)
- Irish: 1,396 (6.9%)
- European: 1,048 (5.1%)
- Italian: 689 (3.4%)
- Polish: 450 (2.2%)
- Scottish: 258 (1.3%)
- French: 195 (1.0%)
- Scotch-Irish: 176 (0.9%)
- Dutch: 173 (0.8%)
- Norwegian: 126 (0.6%)
- Welsh: 116 (0.6%)
- Swedish: 116 (0.6%)
- Hungarian: 109 (0.5%)
- African: 100 (0.5%)
- Slovak: 84 (0.4%)
- Egyptian: 60 (0.3%)
- Russian: 56 (0.3%)
- Austrian: 55 (0.3%)
- British: 55 (0.3%)
- Australian: 54 (0.3%)
- French Canadian: 54 (0.3%)
- Danish: 48 (0.2%)
- Iranian: 46 (0.2%)
- Brazilian: 37 (0.2%)
- Nigerian: 36 (0.2%)
- Maltese: 35 (0.2%)
- Finnish: 35 (0.2%)
- Lebanese: 31 (0.2%)
- Estonian: 30 (0.1%)
- Lithuanian: 29 (0.1%)
- Swiss: 29 (0.1%)
- Dutch West Indian: 28 (0.1%)
- Scandinavian: 22 (0.1%)
- Slavic: 18 (0.09%)
- Syrian: 17 (0.08%)
- Czechoslovakian: 17 (0.08%)
- Northern European: 16 (0.08%)
- Canadian: 14 (0.07%)
- Slovene: 12 (0.06%)
- Ukrainian: 12 (0.06%)
- Trinidadian and Tobagonian: 12 (0.06%)
- Palestinian: 10 (0.05%)
- Croatian: 9 (0.04%)
- Romanian: 8 (0.04%)
- Eastern European: 8 (0.04%)
- Moroccan: 6 (0.03%)
- Arab: 5 (0.02%)
- Greek: 2 (0.01%)
Most common places of birth for foreign-born residents (%):
| Beavercreek: | 18.4% (475) |
| Ohio: | 11.6% (66,525) |
| Beavercreek: | 11.9% (306) |
| Ohio: | 2.0% (11,398) |
| Beavercreek: | 11.4% (294) |
| Ohio: | 3.1% (17,818) |
| Beavercreek: | 7.4% (190) |
| Ohio: | 0.4% (2,091) |
| Beavercreek: | 7.1% (182) |
| Ohio: | 1.0% (5,444) |
| Beavercreek: | 5.0% (128) |
| Ohio: | 1.9% (10,960) |
| Beavercreek: | 3.9% (101) |
| Ohio: | 7.8% (44,796) |
| Beavercreek: | 2.8% (73) |
| Ohio: | 1.0% (5,979) |
| Beavercreek: | 2.7% (69) |
| Ohio: | 2.6% (14,988) |
| Beavercreek: | 2.7% (69) |
| Ohio: | 2.2% (12,846) |
| Beavercreek: | 2.2% (58) |
| Ohio: | 0.2% (1,424) |
| Beavercreek: | 2.1% (54) |
| Ohio: | 0.7% (4,155) |
| Beavercreek: | 1.8% (47) |
| Ohio: | 0.9% (5,101) |
| Beavercreek: | 1.7% (45) |
| Ohio: | 0.5% (3,090) |
| Beavercreek: | 1.7% (45) |
| Ohio: | 0.6% (3,669) |
| Beavercreek: | 1.7% (43) |
| Ohio: | 0.3% (1,763) |
| Beavercreek: | 1.7% (43) |
| Ohio: | 0.4% (2,052) |
| Beavercreek: | 1.6% (40) |
| Ohio: | 6.2% (35,703) |
Place of birth for U.S.-born residents:
- This state: 27,711
- Other state: 15,471
- Northeast: 3,019
- Midwest: 3,405
- South: 6,255
- West: 2,776
87.8% of Beavercreek residents lived in the same house 1 years ago.
Out of people who lived in different houses, 26.2% lived in this county.
Out of people who lived in different counties, 74.6% lived in Ohio.
| Beavercreek: | 87.8% |
| State average: | 87.8% |
Education attainment for males 25 years and older:
- No schooling: 154
- Nursery to 4th grade: 0
- 5th and 6th grade: 15
- 7th and 8th grade: 28
- 9th grade: 67
- 10th grade: 18
- 11th grade: 54
- 12th grade, no diploma: 177
- High school graduate (or equivalency): 2,536
- Less than 1 year of college: 619
- Some college more than 1 year, no degree: 2,654
- Associate degree: 1,510
- Bachelor's degree: 3,648
- Master's degree: 3,533
- Professional school degree: 718
- Doctorate degree: 585

Education attainment for females 25 years and older:
- No schooling: 92
- Nursery to 4th grade: 0
- 5th and 6th grade: 0
- 7th and 8th grade: 38
- 9th grade: 85
- 10th grade: 83
- 11th grade: 66
- 12th grade, no diploma: 276
- High school graduate (or equivalency): 2,887
- Less than 1 year of college: 835
- Some college more than 1 year, no degree: 2,431
- Associate degree: 1,727
- Bachelor's degree: 4,847
- Master's degree: 3,088
- Professional school degree: 385
- Doctorate degree: 267


Housing units in structures:
- One, detached: 14,379
- One, attached: 1,554
- Two: 116
- 3 or 4: 575
- 5 to 9: 1,216
- 10 to 19: 1,150
- 20 to 49: 571
- 50 or more: 707
- Mobile homes: 54
Housing units lacking complete kitchen facilities in 2022: 1.6%
House/condo owner moved in on average 12 years ago
Renter moved in on average 3 years ago

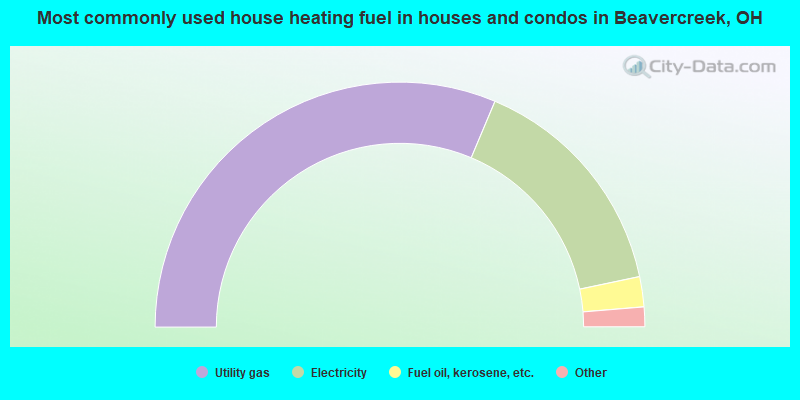
- 62.7%Utility gas
- 30.7%Electricity
- 4.0%Fuel oil, kerosene, etc.
- 1.9%Bottled, tank, or LP gas
- 0.3%Wood
- 0.2%Other fuel
- 0.2%No fuel used
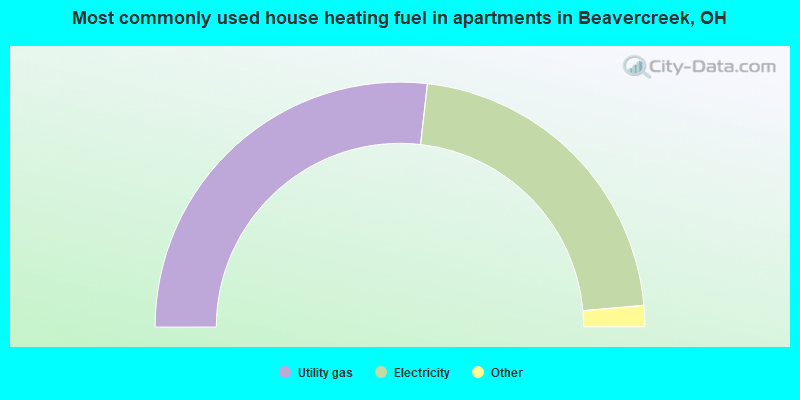
- 53.6%Utility gas
- 43.6%Electricity
- 1.6%Bottled, tank, or LP gas
- 1.2%Fuel oil, kerosene, etc.
Private vs. public school enrollment:
| Here: | 23.8% |
| Ohio: | 16.0% |
| Here: | 13.3% |
| Ohio: | 13.1% |
| Here: | 23.6% |
| Ohio: | 22.3% |


