Bedford, TX (Texas) Houses and Residents
| Bedford: | $338,181 |
| Texas: | $275,400 |
Total population: 48,908 (Urban population: 47,072, Rural population: 0)
Houses: 22,479 (21,260 occupied: 11,398 owner occupied, 9,931 renter occupied)
| % of renters here: | 47% |
| State: | 38% |
Housing density: 2,247 houses/condos per square mile
Median price asked for vacant for-sale houses and condos in 2022: $311,507.
Median contract rent in 2022: $1,222 (lower quartile is $1,050, upper quartile is $1,514)
Median rent asked for vacant for-rent units in 2022: $1,650
Median gross rent in Bedford, TX in 2022: $1,368
Housing units in Bedford with a mortgage: 6,920 (469 second mortgage, 7 home equity loan, 340 both second mortgage and home equity loan)
Houses without a mortgage: 59
Median household income for houses/condos with a mortgage: $123,969
Median household income for apartments without a mortgage: $85,160
Median monthly housing costs: $1,404
Compare current foreclosures in Bedford, TX:
| Photo | Address | Area | Beds / Baths | Price | Details |
|---|---|---|---|---|---|

|
#1
Belle St
Bedford, TX 76022
|
1,462 sq. feet
|
2 baths 3 beds |
show details | |

|
#2
Maplewood Ct
Bedford, TX 76021
|
2,735 sq. feet
|
3 baths 3 beds |
show details | |

|
#3
Carlisle St
Bedford, TX 76021
|
1,216 sq. feet
|
2 baths 3 beds |
show details | |

|
#4
Pecan Cir
Bedford, TX 76021
|
2,294 sq. feet
|
2 baths 4 beds |
show details | |

|
#5
Spring Valley Dr
Bedford, TX 76021
|
1,643 sq. feet
|
2 baths 3 beds |
show details | |

|
#6
Lexington Pl
Bedford, TX 76022
|
1,478 sq. feet
|
2 baths 3 beds |
show details | |

|
#7
Springdale Rd
Bedford, TX 76021
|
1,364 sq. feet
|
2 baths 3 beds |
show details | |

|
#8
Dalewood Ct
Bedford, TX 76022
|
1,250 sq. feet
|
1 baths 2 beds |
show details | |

|
#9
Beachtree Ln
Bedford, TX 76021
|
1,598 sq. feet
|
2 baths 3 beds |
show details | |

|
#10
Spring Valley Dr
Bedford, TX 76021
|
1,641 sq. feet
|
2 baths 3 beds |
show details |
| Photo | Address | Area | Beds / Baths | Price | Details |
|---|---|---|---|---|---|

|
#11
Spring Forest Dr
Bedford, TX 76021
|
2,268 sq. feet
|
2 baths 3 beds |
show details | |

|
#12
Glenda Dr
Bedford, TX 76022
|
2,048 sq. feet
|
2 baths 3 beds |
show details | |

|
#13
Lincolnshire Cir
Bedford, TX 76021
|
2,393 sq. feet
|
2 baths 3 beds |
show details | |

|
#14
Cherry Blossom Ln
Bedford, TX 76021
|
2,204 sq. feet
|
2 baths 4 beds |
show details | |

|
#15
Woodfield Way
Bedford, TX 76021
|
2,270 sq. feet
|
2 baths 3 beds |
show details | |

|
#16
Mesquite Ct W
Bedford, TX 76021
|
1,589 sq. feet
|
2 baths 3 beds |
show details | |

|
#17
San Fernando St
Bedford, TX 76021
|
1,381 sq. feet
|
2 baths 3 beds |
show details | |

|
#18
Sandshell St
Bedford, TX 76021
|
1,242 sq. feet
|
2 baths 3 beds |
show details | |

|
#19
Creekside Ct
Bedford, TX 76021
|
3,541 sq. feet
|
2 baths 4 beds |
show details | |

|
#20
Wayne Ct
Bedford, TX 76021
|
2,298 sq. feet
|
2 baths 3 beds |
show details |
| Photo | Address | Area | Beds / Baths | Price | Details |
|---|---|---|---|---|---|

|
#21
Brightwood Dr
Bedford, TX 76021
|
1,837 sq. feet
|
2 baths 3 beds |
show details | |

|
#22
Meadow Wood Ct
Bedford, TX 76021
|
1,808 sq. feet
|
2 baths 3 beds |
show details | |

|
#23
Schumac Ln
Bedford, TX 76022
|
2,231 sq. feet
|
2 baths 4 beds |
show details | |

|
#24
Greenwood Ct
Bedford, TX 76021
|
1,973 sq. feet
|
2 baths 3 beds |
show details | |

|
#25
Oak Hollow Dr
Bedford, TX 76021
|
2,130 sq. feet
|
2 baths 4 beds |
show details | |

|
#26
Brookgreen Ct
Bedford, TX 76021
|
2,211 sq. feet
|
2 baths 3 beds |
show details | |

|
#27
Hazlewood Ct
Bedford, TX 76021
|
2,588 sq. feet
|
2 baths 3 beds |
show details | |

|
#28
Shady Ln
Bedford, TX 76021
|
2,266 sq. feet
|
2 baths 3 beds |
show details | |

|
#29
Wayfarer Rd
Bedford, TX 76021
|
1,550 sq. feet
|
2 baths 3 beds |
show details | |

|
#30
Oakhurst Dr
Bedford, TX 76022
|
1,859 sq. feet
|
2 baths 3 beds |
show details |
| Photo | Address | Area | Beds / Baths | Price | Details |
|---|---|---|---|---|---|

|
#31
Winchester Way
Bedford, TX 76022
|
1,383 sq. feet
|
2 baths 3 beds |
show details | |

|
#32
Steeplechase Dr
Bedford, TX 76021
|
1,654 sq. feet
|
2 baths 3 beds |
show details | |

|
#33
River Forest Ct
Bedford, TX 76021
|
2,251 sq. feet
|
2 baths 4 beds |
show details | |

|
#34
Berkshire Ln
Bedford, TX 76021
|
2,241 sq. feet
|
2 baths 4 beds |
show details | |

|
#35
Versante Dr
Bedford, TX 76021
|
1,540 sq. feet
|
2 baths 3 beds |
show details | |

|
#36
Shady Ln Apt 908
Bedford, TX 76021
|
- sq. feet
|
- baths - beds |
show details | |

|
#37
Airport Fwy, # 543
Bedford, TX 76022
|
- sq. feet
|
- baths - beds |
show details | |

|
#38
Oak Creek Ln Apt G
Bedford, TX 76022
|
- sq. feet
|
- baths - beds |
show details | |

|
#39
Oak Creek Ln Apt 43
Bedford, TX 76022
|
- sq. feet
|
- baths - beds |
show details | |

|
#40
Hackberry Ln
Bedford, TX 76021
|
- sq. feet
|
- baths - beds |
show details |
| Photo | Address | Area | Beds / Baths | Price | Details |
|---|---|---|---|---|---|

|
#41
Shady Ln # 2-0057
Bedford, TX 76021
|
- sq. feet
|
- baths - beds |
show details | |

|
#42
Airport Fwy # 350
Bedford, TX 76021
|
- sq. feet
|
- baths - beds |
show details | |

|
#43
Airport Fwy Ste 222
Bedford, TX 76022
|
- sq. feet
|
- baths - beds |
show details | |

|
#44
Blessing Ct Apt 301
Bedford, TX 76021
|
- sq. feet
|
- baths - beds |
show details | |

|
#45
Bedford Rd Apt 611
Bedford, TX 76021
|
- sq. feet
|
- baths - beds |
show details | |

|
#46
Meadow Park Cir Apt 78
Bedford, TX 76021
|
- sq. feet
|
- baths - beds |
show details | |

|
#47
Forest Park Cir
Bedford, TX 76021
|
- sq. feet
|
- baths - beds |
show details | |

|
#48
Martin Dr Apt 2039
Bedford, TX 76021
|
- sq. feet
|
- baths - beds |
show details | |

|
#49
Central Park Blvd Apt 1812
Bedford, TX 76022
|
- sq. feet
|
- baths - beds |
show details | |

|
Check over 1 million property listings on Foreclosure.com!
|
browse all offers | |||

Latest news about housing in Bedford, TX collected exclusively by city-data.com from local newspapers, TV, and radio stations

 | More apartments in Bedford (4 replies) |
| Wanting to buy a house in Bedford to rent while I live in Irving (6 replies) |
| Buying a house in Bedford (23 replies) |
| Need advise on Bedford - Euless apartments (3 replies) |
| Do all homes on house hunting trips start to look alike to you? (23 replies) |
| Safe Affordable Apartments near the DFW Airport (5 replies) |

Median year apartment built: 1987
Household type by relationship:
Households: 50,408- Male householders: 10,188 (2,966 living alone), Female householders: 10,664 (3,973 living alone)
9,135 spouses (8,996 opposite-sex spouses), 1,445 unmarried partners, (1,249 opposite-sex unmarried partners), 14,125 children (13,249 natural, 331 adopted, 544 stepchildren), 1,159 grandchildren, 240 brothers or sisters, 847 parents, 37 foster children, 865 other relatives, 1,266 non-relatives
- In group quarters: 431
Size of family households: 6,012 2-persons, 3,233 3-persons, 1,680 4-persons, 937 5-persons, 459 6-persons, 245 7-or-more-persons.
Size of nonfamily households: 7,513 1-person, 1,119 2-persons, 192 3-persons, 33 4-persons.
6,886 married couples with children.
2,486 single-parent households (761 men, 1,725 women).
81.1% of residents of Bedford speak English at home.
10.4% of residents speak Spanish at home (73% speak English very well, 16% speak English well, 8% speak English not well, 2% don't speak English at all).
3.8% of residents speak other Indo-European language at home (55% speak English very well, 34% speak English well, 9% speak English not well, 2% don't speak English at all).
2.3% of residents speak Asian or Pacific Island language at home (69% speak English very well, 20% speak English well, 11% speak English not well).
2.3% of residents speak other language at home (70% speak English very well, 11% speak English well, 17% speak English not well, 2% don't speak English at all).
Foreign born population: 5,873 (11.7%)
(45.1% of them are naturalized citizens)
| Here: | 6.4 |
| State: | 6.3 |
| Here: | 3.3 |
| State: | 4.0 |

- Bedrooms in owner-occupied houses and condos in Bedford, Texas
- 26no bedroom
- 631 bedroom
- 9022 bedrooms
- 6,4883 bedrooms
- 3,5624 bedrooms
- 3585+ bedrooms

- Bedrooms in renter-occupied apartments in Bedford, Texas
- 780no bedroom
- 4,4991 bedroom
- 2,9052 bedrooms
- 1,4663 bedrooms
- 2744 bedrooms
- 85+ bedrooms

- Cars and other vehicles available in Bedford in owner-occupied houses/condos
- 221no vehicle
- 2,8951 vehicle
- 5,1312 vehicles
- 2,3563 vehicles
- 6524 vehicles
- 1435+ vehicles

- Cars and other vehicles available in Bedford in renter-occupied apartments
- 890no vehicle
- 5,5201 vehicle
- 2,9102 vehicles
- 3973 vehicles
- 2124 vehicles
- 25+ vehicles

- Rooms in owner-occupied houses in Bedford, Texas
- 01 room
- 192 rooms
- 1113 rooms
- 7184 rooms
- 2,1475 rooms
- 2,6536 rooms
- 2,1737 rooms
- 1,7698 rooms
- 1,8099+ rooms

- Rooms in renter-occupied apartments in Bedford, Texas
- 7261 room
- 1,3472 rooms
- 3,0463 rooms
- 2,1784 rooms
- 1,2845 rooms
- 8916 rooms
- 2277 rooms
- 1068 rooms
- 1259+ rooms


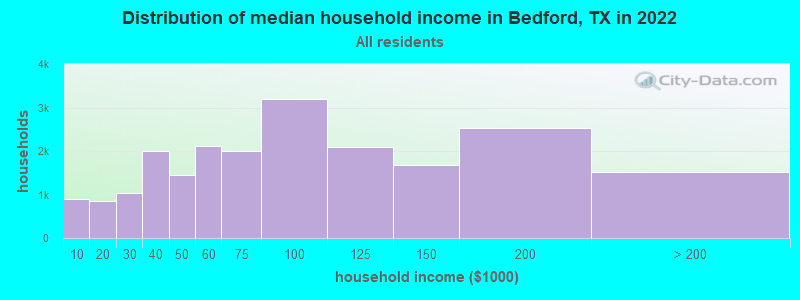
Bedford, TX household income distribution

- 887Less than $10,000
- 862$10,000 to $19,999
- 1,031$20,000 to $29,999
- 2,008$30,000 to $39,999
- 1,456$40,000 to $49,999
- 2,114$50,000 to $59,999
- 2,008$60,000 to $74,999
- 3,184$75,000 to $99,999
- 2,098$100,000 to $124,999
- 1,667$125,000 to $149,999
- 2,538$150,000 to $199,999
- 1,526$200,000 or more
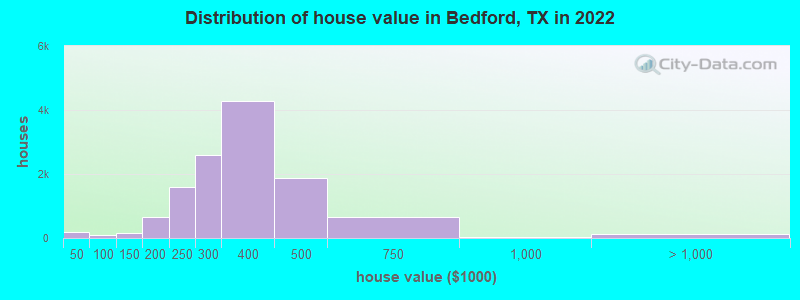
Home value of owner - occupied houses in 2022 in Bedford, TX
-
- 22Less than $10,000
- 15$10,000 to $14,999
- 54$15,000 to $19,999
- 50$20,000 to $24,999
- 38$25,000 to $29,999
- 10$30,000 to $34,999
- 49$50,000 to $59,999
- 6$60,000 to $69,999
- 8$80,000 to $89,999
- 36$90,000 to $99,999
- 79$100,000 to $124,999
- 73$125,000 to $149,999
- 237$150,000 to $174,999
- 408$175,000 to $199,999
- 1,598$200,000 to $249,999
- 2,578$250,000 to $299,999
- 4,280$300,000 to $399,999
- 1,869$400,000 to $499,999
- 662$500,000 to $749,999
- 35$750,000 to $999,999
- 12$1,000,000 to $1,499,999
- 102$2,000,000 or more
Rent paid by renters in 2022 in Bedford, TX
-
- 11$150 to $199
- 3$200 to $249
- 28$250 to $299
- 10$300 to $349
- 18$350 to $399
- 18$400 to $449
- 54$500 to $549
- 24$700 to $749
- 17$750 to $799
- 462$800 to $899
- 1,137$900 to $999
- 3,754$1,000 to $1,249
- 1,932$1,250 to $1,499
- 1,282$1,500 to $1,999
- 563$2,000 to $2,499
- 130$2,500 to $2,999
- 34$3,000 to $3,499
- 102$3,500 or more
- 170No cash rent


Percentage of workers working in this county: 71.6%
Number of people working at home: 5,261 (19.2% of all workers)
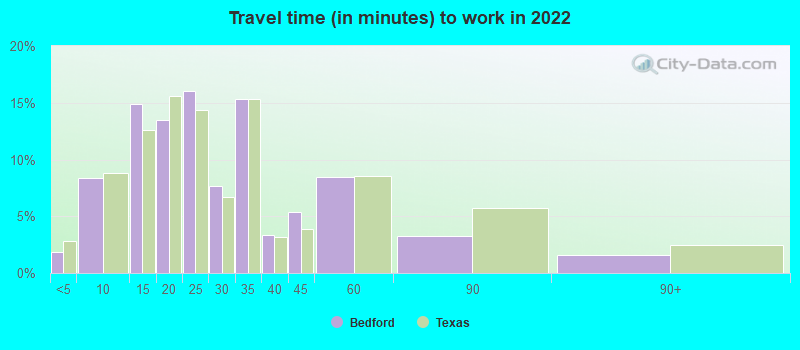
Travel time to work (commute)
- Less than 5 minutes: 401
- 5 to 9 minutes: 1,996
- 10 to 14 minutes: 2,840
- 15 to 19 minutes: 3,314
- 20 to 24 minutes: 3,931
- 25 to 29 minutes: 1,621
- 30 to 34 minutes: 3,808
- 35 to 39 minutes: 658
- 40 to 44 minutes: 1,238
- 45 to 59 minutes: 1,755
- 60 to 89 minutes: 547
- 90 or more minutes: 241
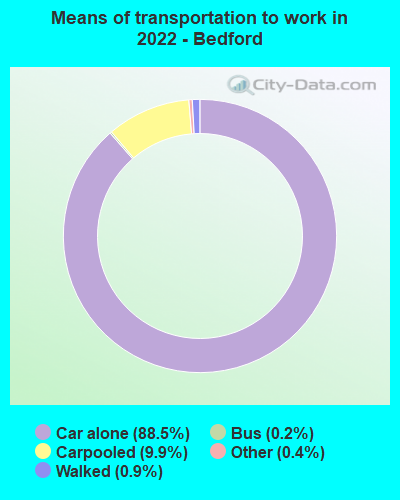
Means of transportation to work:
- Drove a car alone: 15,963 (69.7%)
- Carpooled: 1,856 (8.1%)
- Bus: 24 (0.1%)
- Taxi: 98 (0.4%)
- Bicycle: 5 (0.0%)
- Walked: 168 (0.7%)
- Worked at home: 5,261 (23.0%)

- Unemployment by race in 2022
- Unemployment rate for White non-Hispanic residents
- 4.1%Males
- 1.8%Females
- Unemployment rate for Black residents
- 5.6%Males
- 6.1%Females
- Unemployment rate for American Indian and Alaska Native residents
- 4.8%Males
- Unemployment rate for Asian residents
- 2.6%Males
- Unemployment rate for other race residents
- 11.7%Females
- Unemployment rate for two or more race residents
- 4.2%Males
- 3.0%Females
- Unemployment rate for Hispanic or Latino residents
- 3.0%Males
- 6.4%Females

- Year of entry for the foreign-born population in Bedford, Texas
- 2,2742010 or later
- 1,1662000 to 2009
- 1,0521990 to 1999
- 9171980 to 1989
- 5531970 to 1979
- 470Before 1970

First ancestries reported:
- English: 4,164 (15.5%)
- German: 2,188 (8.2%)
- Irish: 1,964 (7.3%)
- American: 1,459 (5.4%)
- Scottish: 470 (1.8%)
- European: 459 (1.7%)
- Italian: 427 (1.6%)
- African: 339 (1.3%)
- Palestinian: 270 (1.0%)
- Scotch-Irish: 259 (1.0%)
- British: 172 (0.6%)
- French: 123 (0.5%)
- Swedish: 121 (0.5%)
- Polish: 104 (0.4%)
- Welsh: 103 (0.4%)
- Kenyan: 89 (0.3%)
- Eastern European: 87 (0.3%)
- Russian: 80 (0.3%)
- Hungarian: 80 (0.3%)
- Norwegian: 70 (0.3%)
- Nigerian: 68 (0.3%)
- Cajun: 67 (0.3%)
- Sudanese: 63 (0.2%)
- Greek: 61 (0.2%)
- Ukrainian: 58 (0.2%)
- Danish: 55 (0.2%)
- Czech: 53 (0.2%)
- Austrian: 52 (0.2%)
- Portuguese: 45 (0.2%)
- Albanian: 42 (0.2%)
- Serbian: 35 (0.1%)
- Swiss: 30 (0.1%)
- Lebanese: 28 (0.1%)
- French Canadian: 22 (0.08%)
- Belgian: 22 (0.08%)
- Brazilian: 20 (0.07%)
- Moroccan: 17 (0.06%)
- Dutch: 17 (0.06%)
- Egyptian: 17 (0.06%)
- Czechoslovakian: 17 (0.06%)
- Arab: 12 (0.04%)
- Bulgarian: 10 (0.04%)
- Jordanian: 7 (0.03%)
- Scandinavian: 6 (0.02%)
- Northern European: 6 (0.02%)
- Romanian: 6 (0.02%)
- Celtic: 4 (0.01%)
Most common places of birth for foreign-born residents (%):
| Bedford: | 17.2% (1,027) |
| Texas: | 48.4% (2,411,723) |
| Bedford: | 8.6% (515) |
| Texas: | 0.6% (27,480) |
| Bedford: | 6.2% (369) |
| Texas: | 6.1% (306,347) |
| Bedford: | 5.3% (315) |
| Texas: | 1.3% (62,978) |
| Bedford: | 5.1% (302) |
| Texas: | 4.5% (224,455) |
| Bedford: | 4.5% (267) |
| Texas: | 0.1% (3,009) |
| Bedford: | 4.4% (264) |
| Texas: | 2.1% (103,148) |
| Bedford: | 3.9% (231) |
| Texas: | 1.2% (60,172) |
| Bedford: | 3.8% (225) |
| Texas: | 0.1% (5,522) |
| Bedford: | 3.4% (203) |
| Texas: | 1.2% (62,159) |
| Bedford: | 3.2% (193) |
| Texas: | 1.5% (72,413) |
| Bedford: | 2.1% (123) |
| Texas: | 0.1% (2,687) |
| Bedford: | 2.0% (120) |
| Texas: | 1.9% (96,110) |
| Bedford: | 1.9% (116) |
| Texas: | 3.7% (184,770) |
| Bedford: | 1.6% (97) |
| Texas: | 0.1% (4,638) |
Place of birth for U.S.-born residents:
- This state: 26,329
- Other state: 17,278
- Northeast: 2,289
- Midwest: 5,023
- South: 6,214
- West: 3,680
80.6% of Bedford residents lived in the same house 1 years ago.
Out of people who lived in different houses, 40.4% lived in this county.
Out of people who lived in different counties, 66.9% lived in Texas.
| Bedford: | 80.6% |
| State average: | 85.7% |
Education attainment for males 25 years and older:
- No schooling: 129
- Nursery to 4th grade: 30
- 5th and 6th grade: 0
- 7th and 8th grade: 38
- 9th grade: 118
- 10th grade: 150
- 11th grade: 101
- 12th grade, no diploma: 296
- High school graduate (or equivalency): 3,032
- Less than 1 year of college: 1,897
- Some college more than 1 year, no degree: 2,579
- Associate degree: 1,886
- Bachelor's degree: 4,652
- Master's degree: 1,577
- Professional school degree: 241
- Doctorate degree: 290

Education attainment for females 25 years and older:
- No schooling: 232
- Nursery to 4th grade: 88
- 5th and 6th grade: 109
- 7th and 8th grade: 200
- 9th grade: 26
- 10th grade: 34
- 11th grade: 235
- 12th grade, no diploma: 284
- High school graduate (or equivalency): 3,503
- Less than 1 year of college: 1,937
- Some college more than 1 year, no degree: 3,090
- Associate degree: 1,606
- Bachelor's degree: 5,393
- Master's degree: 1,913
- Professional school degree: 130
- Doctorate degree: 179


Housing units in structures:
- One, detached: 12,382
- One, attached: 1,280
- Two: 324
- 3 or 4: 1,178
- 5 to 9: 2,765
- 10 to 19: 2,696
- 20 to 49: 802
- 50 or more: 1,039
- Mobile homes: 10
Housing units lacking complete kitchen facilities in 2022: 1.3%
House/condo owner moved in on average 13 years ago
Renter moved in on average 3 years ago

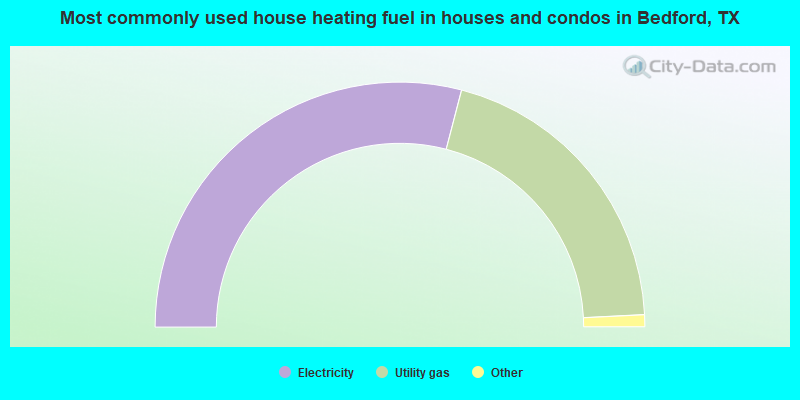
- 58.1%Electricity
- 40.3%Utility gas
- 0.6%Bottled, tank, or LP gas
- 0.5%Solar energy
- 0.2%Coal or coke
- 0.1%Fuel oil, kerosene, etc.
- 0.1%No fuel used
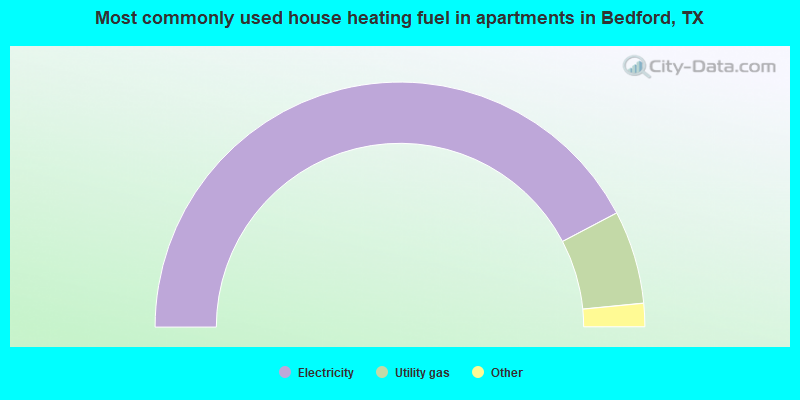
- 84.6%Electricity
- 12.3%Utility gas
- 2.3%Bottled, tank, or LP gas
- 0.5%Wood
- 0.2%Solar energy
Private vs. public school enrollment:
| Here: | 8.2% |
| Texas: | 8.8% |
| Here: | 9.5% |
| Texas: | 8.0% |
| Here: | 19.2% |
| Texas: | 16.2% |


