Beecher City, IL (Illinois) Houses and Residents
| Beecher City: | $88,707 |
| Illinois: | $251,600 |
Mean price in 2022:
Detached houses: $107,385
Here: $107,385 State: $310,164 Mobile homes: $71,694
Here: $71,694 State: $78,855
Total population: 456 (Urban population: 0, Rural population: 480 (6 farm, 474 nonfarm))
Houses: 218 (191 occupied: 130 owner occupied, 64 renter occupied)
| % of renters here: | 33% |
| State: | 33% |
Housing density: 241 houses/condos per square mile
Median price asked for vacant for-sale houses and condos in 2022 in this county: $135,784.
Median contract rent in 2022: $398 (lower quartile is $348, upper quartile is $500)
Median rent asked for vacant for-rent units in 2022: $6,932
Median gross rent in Beecher City, IL in 2022: $609
Housing units in Beecher City with a mortgage: 84 (0 second mortgage, 0 home equity loan, 0 both second mortgage and home equity loan)
Houses without a mortgage: 0
Median household income for houses/condos with a mortgage: $43,115
Median household income for apartments without a mortgage: $45,139
Median monthly housing costs: $633
Compare current foreclosures near Beecher City, IL:
| Photo | Address | Area | Beds / Baths | Price | Details |
|---|---|---|---|---|---|

|
#1
N Myrtle St
Beecher City, IL 62414
|
1,200 sq. feet
|
- baths 1 beds |
show details | |

|
#2
N Wyandotte St Apt D
Beecher City, IL 62414
|
- sq. feet
|
- baths - beds |
show details | |

|
#3
W 2nd St
Saint Elmo, IL 62458
|
920 sq. feet
|
1 baths 2 beds |
show details | |

|
#4
County Highway 9
Neoga, IL 62447
|
- sq. feet
|
2 baths 4 beds |
show details | |

|
#5
N Long St
Shelbyville, IL 62565
|
- sq. feet
|
2 baths 2 beds |
show details | |

|
#6
2600 East Rd
Strasburg, IL 62465
|
- sq. feet
|
- baths - beds |
show details | |

|
#7
E Hendelmeyer Ave Apt 11a
Effingham, IL 62401
|
- sq. feet
|
- baths - beds |
show details | |

|
#8
S 4th St
Effingham, IL 62401
|
- sq. feet
|
- baths - beds |
show details | |

|
#9
E 650 North Rd
Pana, IL 62557
|
- sq. feet
|
- baths - beds |
show details | |

|
#10
W North 3rd St
Shelbyville, IL 62565
|
- sq. feet
|
- baths - beds |
show details |
| Photo | Address | Area | Beds / Baths | Price | Details |
|---|---|---|---|---|---|

|
#11
N 2nd St
Effingham, IL 62401
|
- sq. feet
|
- baths - beds |
show details | |

|
#12
N 1100 East Rd
Tower Hill, IL 62571
|
- sq. feet
|
- baths - beds |
show details | |

|
#13
S Chestnut St
Brownstown, IL 62418
|
1,326 sq. feet
|
- baths - beds |
show details | |

|
#14
N Oak St # 9
Effingham, IL 62401
|
- sq. feet
|
- baths - beds |
show details | |

|
#15
E Walnut St
Cowden, IL 62422
|
- sq. feet
|
- baths - beds |
show details | |

|
#16
E Ash St
Brownstown, IL 62418
|
1,608 sq. feet
|
- baths - beds |
show details | |

|
#17
Hillside Dr Apt A4
Effingham, IL 62401
|
- sq. feet
|
- baths - beds |
show details | |

|
#18
N Church St
Sigel, IL 62462
|
- sq. feet
|
- baths - beds |
show details | |

|
#19
County Highway 7
Strasburg, IL 62465
|
- sq. feet
|
- baths - beds |
show details | |

|
#20
State Highway 16
Shelbyville, IL 62565
|
- sq. feet
|
- baths - beds |
show details |
| Photo | Address | Area | Beds / Baths | Price | Details |
|---|---|---|---|---|---|

|
#21
E 4th St
Saint Elmo, IL 62458
|
- sq. feet
|
- baths - beds |
show details | |

|
#22
N 1100 East Rd
Tower Hill, IL 62571
|
- sq. feet
|
- baths - beds |
show details | |

|
#23
N 3rd St
Altamont, IL 62411
|
- sq. feet
|
- baths - beds |
show details | |

|
#24
W Elm St
Altamont, IL 62411
|
- sq. feet
|
- baths - beds |
show details | |

|
#25
Deer Dr
Altamont, IL 62411
|
- sq. feet
|
- baths - beds |
show details | |

|
#26
S 4th St
Altamont, IL 62411
|
- sq. feet
|
- baths - beds |
show details | |

|
#27
S 3rd St
Altamont, IL 62411
|
- sq. feet
|
- baths - beds |
show details | |

|
#28
E 1800th Ave
Effingham, IL 62401
|
- sq. feet
|
- baths - beds |
show details | |

|
#29
E 3250 Ave
Ramsey, IL 62080
|
- sq. feet
|
- baths - beds |
show details | |

|
#30
E 11th St
Saint Elmo, IL 62458
|
- sq. feet
|
- baths - beds |
show details |
| Photo | Address | Area | Beds / Baths | Price | Details |
|---|---|---|---|---|---|

|
#31
E 10th St
Saint Elmo, IL 62458
|
- sq. feet
|
- baths - beds |
show details | |

|
#32
Circle Dr
Saint Elmo, IL 62458
|
1,425 sq. feet
|
- baths - beds |
show details | |

|
#33
N Main St
Saint Elmo, IL 62458
|
- sq. feet
|
- baths - beds |
show details | |

|
#34
N 1000th Rd
Effingham, IL 62401
|
- sq. feet
|
- baths - beds |
show details | |

|
#35
N Main St
Saint Elmo, IL 62458
|
1,868 sq. feet
|
- baths - beds |
show details | |

|
#36
E Blue Ridge Dr
Effingham, IL 62401
|
- sq. feet
|
- baths - beds |
show details | |

|
#37
N Long St
Shelbyville, IL 62565
|
- sq. feet
|
- baths - beds |
show details | |

|
#38
N Broadway St
Shelbyville, IL 62565
|
- sq. feet
|
- baths - beds |
show details | |

|
#39
E State Highway 33
Shumway, IL 62461
|
- sq. feet
|
- baths - beds |
show details | |

|
#40
W South 4th St
Shelbyville, IL 62565
|
- sq. feet
|
- baths - beds |
show details |
| Photo | Address | Area | Beds / Baths | Price | Details |
|---|---|---|---|---|---|

|
#41
S Sycamore St
Effingham, IL 62401
|
- sq. feet
|
- baths - beds |
show details | |

|
#42
N Oceola St
Effingham, IL 62401
|
- sq. feet
|
- baths - beds |
show details | |

|
#43
W Kreke Ave
Effingham, IL 62401
|
- sq. feet
|
- baths - beds |
show details | |

|
#44
W Wabash Ave
Effingham, IL 62401
|
- sq. feet
|
- baths - beds |
show details | |

|
#45
W Franklin Ave
Effingham, IL 62401
|
- sq. feet
|
- baths - beds |
show details | |

|
#46
N Lincoln St
Effingham, IL 62401
|
- sq. feet
|
- baths - beds |
show details | |

|
#47
W John Adams Ave
Altamont, IL 62411
|
- sq. feet
|
- baths - beds |
show details | |

|
#48
W Kentucky Ave
Effingham, IL 62401
|
- sq. feet
|
- baths - beds |
show details | |

|
#49
E 2700 Ave
Ramsey, IL 62080
|
- sq. feet
|
- baths - beds |
show details | |

|
Check over 1 million property listings on Foreclosure.com!
|
browse all offers | |||


Median year apartment built: 1976
Household type by relationship:
Households: 425- Male householders: 79 (37 living alone), Female householders: 108 (44 living alone)
53 spouses (53 opposite-sex spouses), 32 unmarried partners, (32 opposite-sex unmarried partners), 131 children (122 natural, 0 adopted, 8 stepchildren), 0 grandchildren, 0 brothers or sisters, 0 parents, 11 foster children, 0 other relatives, 5 non-relatives
Size of family households: 30 2-persons, 28 3-persons, 28 4-persons, 10 5-persons, 3 6-persons.
Size of nonfamily households: 86 1-person, 7 2-persons.
44 married couples with children.
56 single-parent households (26 men, 30 women).
98.2% of residents of Beecher City speak English at home.
1.0% of residents speak other Indo-European language at home (100% speak English very well).
| Here: | 5.8 |
| State: | 6.4 |
| Here: | 4.1 |
| State: | 4.1 |

- Bedrooms in owner-occupied houses and condos in Beecher City, Illinois
- 0no bedroom
- 61 bedroom
- 382 bedrooms
- 743 bedrooms
- 104 bedrooms
- 25+ bedrooms

- Bedrooms in renter-occupied apartments in Beecher City, Illinois
- 11no bedroom
- 91 bedroom
- 302 bedrooms
- 103 bedrooms
- 44 bedrooms
- 05+ bedrooms

- Cars and other vehicles available in Beecher City in owner-occupied houses/condos
- 7no vehicle
- 431 vehicle
- 432 vehicles
- 333 vehicles
- 04 vehicles
- 55+ vehicles

- Cars and other vehicles available in Beecher City in renter-occupied apartments
- 8no vehicle
- 271 vehicle
- 222 vehicles
- 43 vehicles
- 14 vehicles
- 15+ vehicles

- Rooms in owner-occupied houses in Beecher City, Illinois
- 01 room
- 02 rooms
- 53 rooms
- 174 rooms
- 345 rooms
- 286 rooms
- 217 rooms
- 188 rooms
- 69+ rooms

- Rooms in renter-occupied apartments in Beecher City, Illinois
- 111 room
- 02 rooms
- 63 rooms
- 204 rooms
- 95 rooms
- 106 rooms
- 37 rooms
- 38 rooms
- 19+ rooms


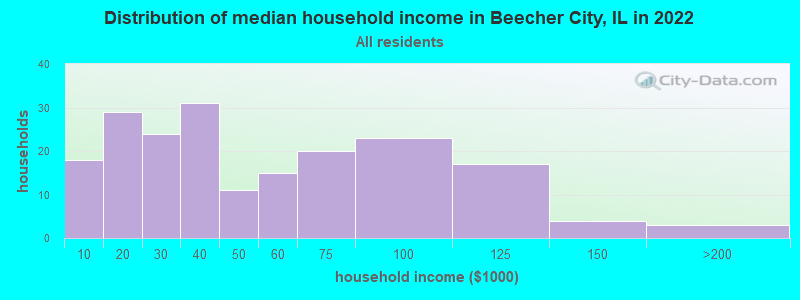
Beecher City, IL household income distribution

- 18Less than $10,000
- 29$10,000 to $19,999
- 24$20,000 to $29,999
- 31$30,000 to $39,999
- 11$40,000 to $49,999
- 15$50,000 to $59,999
- 20$60,000 to $74,999
- 23$75,000 to $99,999
- 17$100,000 to $124,999
- 4$125,000 to $149,999
- 3$150,000 to $199,999
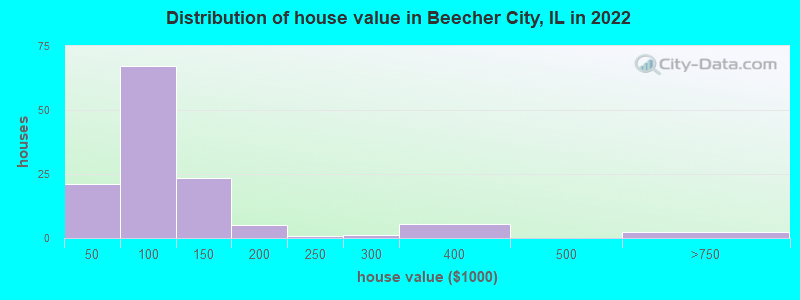
Home value of owner - occupied houses in 2022 in Beecher City, IL
-
- 6$15,000 to $19,999
- 4$25,000 to $29,999
- 4$30,000 to $34,999
- 1$35,000 to $39,999
- 3$40,000 to $49,999
- 13$50,000 to $59,999
- 5$60,000 to $69,999
- 12$70,000 to $79,999
- 21$80,000 to $89,999
- 9$90,000 to $99,999
- 13$100,000 to $124,999
- 9$125,000 to $149,999
- 4$150,000 to $174,999
- 0$175,000 to $199,999
- 0$200,000 to $249,999
- 1$250,000 to $299,999
- 5$300,000 to $399,999
- 1$500,000 to $749,999
- 1$750,000 to $999,999
Rent paid by renters in 2022 in Beecher City, IL
-
- 2$100 to $149
- 11$150 to $199
- 1$300 to $349
- 16$350 to $399
- 13$400 to $449
- 4$450 to $499
- 11$500 to $549
- 1$550 to $599
- 5$600 to $649


Percentage of workers working in this county: 86.9%
Number of people working at home: 5 (2.6% of all workers)
Travel time to work (commute)
- Less than 5 minutes: 6
- 5 to 9 minutes: 2
- 10 to 14 minutes: 19
- 15 to 19 minutes: 26
- 20 to 24 minutes: 59
- 25 to 29 minutes: 25
- 30 to 34 minutes: 31
- 35 to 39 minutes: 0
- 40 to 44 minutes: 1
- 45 to 59 minutes: 0
- 60 to 89 minutes: 3
- 90 or more minutes: 3
Means of transportation to work:
- Drove a car alone: 127 (69.0%)
- Carpooled: 43 (23.4%)
- Bicycle: 3 (1.6%)
- Walked: 9 (4.9%)
- Worked at home: 2 (1.1%)

- Unemployment by race in 2022
- Unemployment rate for White non-Hispanic residents
- 2.9%Males
- 0.8%Females

- Year of entry for the foreign-born population in Beecher City, Illinois
- 01995 to March 2000
- 01990 to 1994
- 01985 to 1989
- 21980 to 1984
- 01975 to 1979
- 01970 to 1974
- 01965 to 1969
- 1Before 1965

First ancestries reported:
- American: 51 (37.5%)
- German: 43 (31.6%)
- Irish: 12 (8.8%)
- English: 9 (6.6%)
- Scottish: 5 (3.7%)
- Polish: 4 (2.9%)
Most common places of birth for foreign-born residents (%):
| Beecher City: | 66.7% (2) |
| Illinois: | 40.4% (617,828) |
Place of birth for U.S.-born residents:
- This state: 383
- Other state: 39
- Northeast: 4
- Midwest: 19
- South: 11
- West: 5
85.7% of Beecher City residents lived in the same house 1 years ago.
Out of people who lived in different houses, 35.6% lived in this county.
Out of people who lived in different counties, 100.0% lived in Illinois.
| Beecher City: | 85.7% |
| State average: | 88.3% |
Education attainment for males 25 years and older:
- No schooling: 2
- Nursery to 4th grade: 0
- 5th and 6th grade: 0
- 7th and 8th grade: 5
- 9th grade: 2
- 10th grade: 0
- 11th grade: 4
- 12th grade, no diploma: 5
- High school graduate (or equivalency): 56
- Less than 1 year of college: 3
- Some college more than 1 year, no degree: 17
- Associate degree: 16
- Bachelor's degree: 6
- Master's degree: 4
- Professional school degree: 0
- Doctorate degree: 0

Education attainment for females 25 years and older:
- No schooling: 1
- Nursery to 4th grade: 0
- 5th and 6th grade: 0
- 7th and 8th grade: 3
- 9th grade: 8
- 10th grade: 0
- 11th grade: 0
- 12th grade, no diploma: 2
- High school graduate (or equivalency): 53
- Less than 1 year of college: 17
- Some college more than 1 year, no degree: 18
- Associate degree: 15
- Bachelor's degree: 15
- Master's degree: 5
- Professional school degree: 0
- Doctorate degree: 0


Housing units in structures:
- One, detached: 173
- Two: 6
- 3 or 4: 2
- 5 to 9: 13
- Mobile homes: 23
Median worth of mobile homes: $88,895
Housing units lacking complete kitchen facilities in 2022: 3.2%
House/condo owner moved in on average 7 years ago
Renter moved in on average 3 years ago

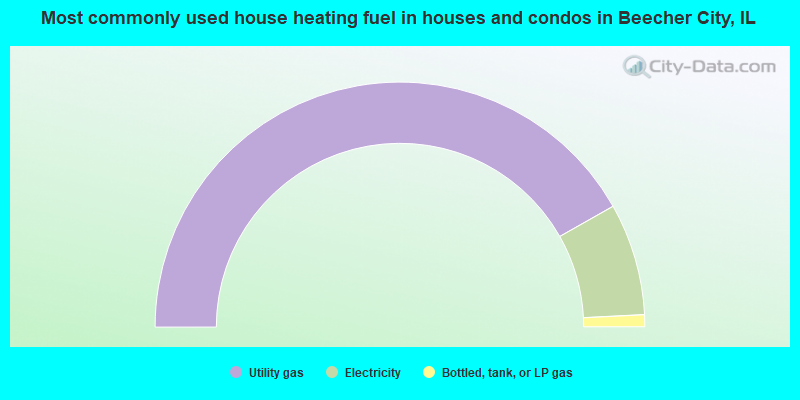
- 83.6%Utility gas
- 14.8%Electricity
- 1.6%Bottled, tank, or LP gas
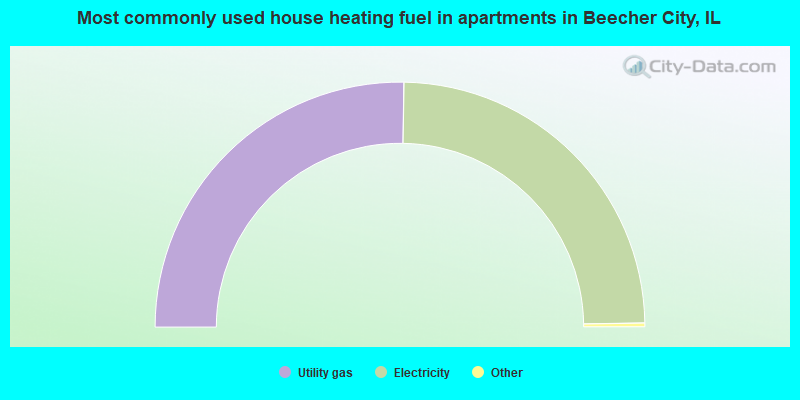
- 50.8%Utility gas
- 49.2%Electricity
Private vs. public school enrollment:
| Here: | 0.0% |
| Illinois: | 13.3% |
| Here: | 0.0% |
| Illinois: | 9.9% |
| Here: | 0.0% |
| Illinois: | 27.4% |


