Bella Vista, AR (Arkansas) Houses and Residents
Estimated median house or condo value in 2022: $282,493 (it was $110,200 in 2000 )
Bella Vista:
$282,493Arkansas:
$179,800
Lower value quartile - upper value quartile: $216,352 - $393,590Mean price in 2022: Detached houses: $263,480 Here:
$263,480State:
$243,881
Townhouses or other attached units: $203,703 Here:
$203,703State:
$244,376
In 2-unit structures: $228,243 Here:
$228,243State:
$229,180
In 3-to-4-unit structures: $144,050 Here:
$144,050State:
$216,658
In 5-or-more-unit structures: $91,100 Here:
$91,100State:
$227,195
Mobile homes: $71,904 Here:
$71,904State:
$79,566
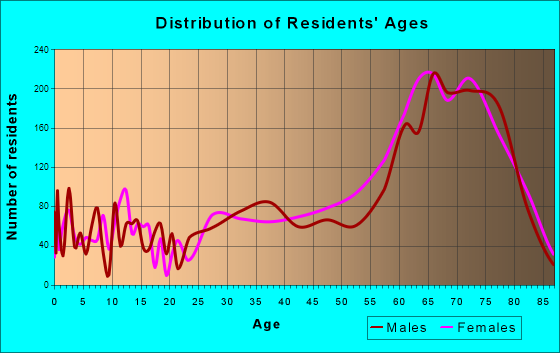
Total population: 27,688 (Urban population: 8,920 (all inside urban clusters), Rural population: 7,521 (51 farm, 7,470 nonfarm ))
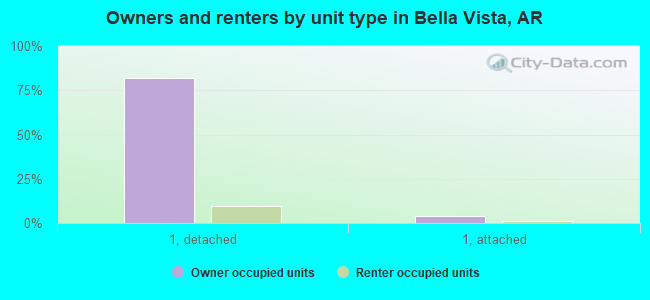
Houses: 14,854 (13,415 occupied: 11,916 owner occupied, 1,562 renter occupied )
% of renters here:
12%State:
34%
Housing density: 226 houses/condos per square mile
Median price asked for vacant for-sale houses and condos in 2022: $265,069.
Median contract rent in 2022: $1,000 (lower quartile is $636, upper quartile is $1,219)
Median rent asked for vacant for-rent units in 2022: $2,848
Median gross rent in Bella Vista, AR in 2022: $1,164
Housing units in Bella Vista with a mortgage: 7,679 (733 second mortgage, 0 home equity loan, 401 both second mortgage and home equity loan )Houses without a mortgage: 58
Median household income for houses/condos with a mortgage: $97,802
Median household income for apartments without a mortgage: $70,401
Median monthly housing costs: $1,084
Data:
Median house or condo value ($)
Median house or condo value ($ change since 2000)
Median house or condo value ($) - White
Median house or condo value ($) - Black or African American
Median house or condo value ($) - Asian
Median house or condo value ($) - Hispanic or Latino
Median house or condo value ($) - American Indian and Alaska Native
Median house or condo value ($) - Multirace
Median house or condo value ($) - Other Race
Median price asked for mobile homes ($)
Household density (households per square mile)
Mean house or condo value by units in structure - 1, detached ($)
Mean house or condo value by units in structure - 1, attached ($)
Mean house or condo value by units in structure - 2 ($)
Mean house or condo value by units in structure by units in structure - 3 or 4 ($)
Mean house or condo value by units in structure - 5 or more ($)
Mean house or condo value by units in structure - Boat, RV, van, etc. ($)
Mean house or condo value by units in structure - Mobile home ($)
Median contract rent ($)
Median contract rent - Lower quartile ($)
Median contract rent - Upper quartile ($)
Median gross rent ($)
Urban houses (%)
Rural houses (%)
Houses occupied (%)
Houses occupied (% change since 2000)
Houses owner occupied (%)
Houses owner occupied (% change since 2000)
Houses renter occupied (%)
Houses renter occupied (% change since 2000)
Vacant housing units - For rent (%)
Vacant housing units - For rent (% change since 2000)
Vacant housing units - For sale only (%)
Vacant housing units - For sale only (% change since 2000)
Vacant housing units - Rented or sold, not occupied (%)
Vacant housing units - Rented or sold, not occupied (% change since 2000)
Vacant housing units - For seasonal, recreational, or occasional use (%)
Vacant housing units - For seasonal, recreational, or occasional use (% change since 2000)
Vacant housing units - For migrant workers (%)
Vacant housing units - For migrant workers (% change since 2000)
Vacant housing units - Other vacant (%)
Vacant housing units - Other vacant (% change since 2000)
Median monthly housing costs ($)
Median household income for houses/condos with a mortgage ($)
Median household income for houses/condos without a mortgage ($)
Median household income ($)
Median household income ($) - White
Median household income ($) - Black or African American
Median household income ($) - Asian
Median household income ($) - Hispanic or Latino
Median household income ($) - American Indian and Alaska Native
Median household income ($) - Multirace
Median household income ($) - Other Race
Mortgage status - with mortgage (%)
Mortgage status - with second mortgage (%)
Mortgage status - with home equity loan (%)
Mortgage status - with both second mortgage and home equity loan (%)
Mortgage status - without a mortgage (%)
Median year house/condo built
Median year apartment built
Household type by relationship - Male householder living alone (%)
Household type by relationship - Male householder not living alone (%)
Household type by relationship - Female householder living alone (%)
Household type by relationship - Female householder not living alone (%)
Household type by relationship - Opposite-Sex spouse (%)
Household type by relationship - Same-Sex spouse (%)
Household type by relationship - Opposite-Sex unmarried partner (%)
Household type by relationship - Same-Sex unmarried partner (%)
Household type by relationship - In group quarters (%)
Size of family households - 2-person household (%)
Size of family households - 3-person household (%)
Size of family households - 4-person household (%)
Size of family households - 5-person household (%)
Size of family households - 6-person household (%)
Size of family households - 7-or-more-person household (%)
Size of nonfamily households - 1-person household (%)
Size of nonfamily households - 2-person household (%)
Size of nonfamily households - 3-person household (%)
Size of nonfamily households - 4-person household (%)
Size of nonfamily households - 5-person household (%)
Size of nonfamily households - 6-person household (%)
Size of nonfamily households - 7-or-moreperson household (%)
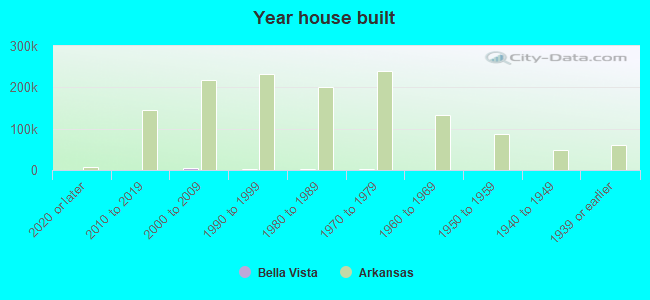
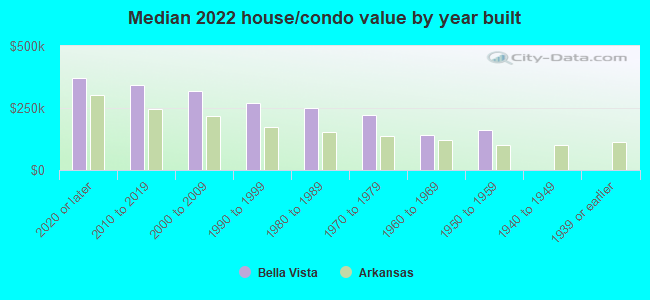
Year house built - Built 2010 or later (%)
Year house built - Built 2000 to 2009 (%)
Year house built - Built 1990 to 1999 (%)
Year house built - Built 1980 to 1989 (%)
Year house built - Built 1970 to 1979 (%)
Year house built - Built 1960 to 1969 (%)
Year house built - Built 1950 to 1959 (%)
Year house built - Built 1940 to 1949 (%)
Year house built - Built 1939 or earlier (%)
Median number of rooms in houses and condos
Median number of rooms in apartments
Median number of bedrooms in owner occupied houses
Mean number of bedrooms in owner occupied houses
Median number of bedrooms in renter occupied houses
Mean number of bedrooms in renter occupied houses
Median number of vehichles in owner occupied houses
Mean number of vehichles in owner occupied houses
Median number of vehichles in renter occupied houses
Mean number of vehichles in renter occupied houses
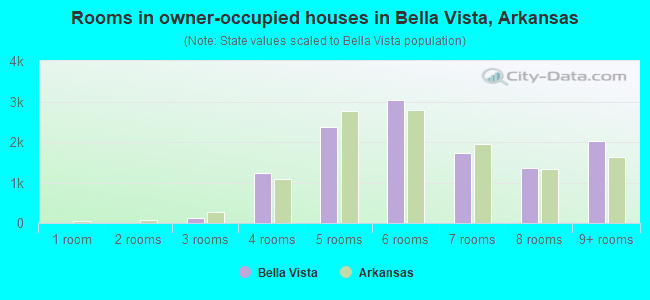
Rooms in owner-occupied houses - 1 room (%)
Rooms in owner-occupied houses - 2 rooms (%)
Rooms in owner-occupied houses - 3 rooms (%)
Rooms in owner-occupied houses - 4 rooms (%)
Rooms in owner-occupied houses - 5 rooms (%)
Rooms in owner-occupied houses - 6 rooms (%)
Rooms in owner-occupied houses - 7 rooms (%)
Rooms in owner-occupied houses - 8 rooms (%)
Rooms in owner-occupied houses - 9+ rooms (%)
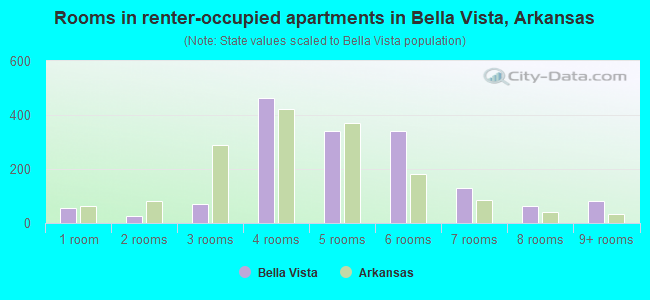
Rooms in renter-occupied houses - 1 room (%)
Rooms in renter-occupied houses - 2 rooms (%)
Rooms in renter-occupied houses - 3 rooms (%)
Rooms in renter-occupied houses - 4 rooms (%)
Rooms in renter-occupied houses - 5 rooms (%)
Rooms in renter-occupied houses - 6 rooms (%)
Rooms in renter-occupied houses - 7 rooms (%)
Rooms in renter-occupied houses - 8 rooms (%)
Rooms in renter-occupied houses - 9+ rooms (%)
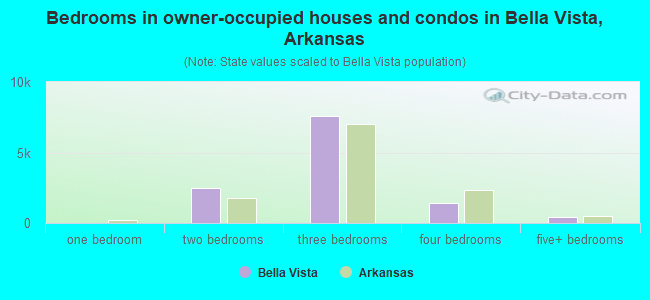
Bedrooms in owner-occupied houses - no bedrooms (%)
Bedrooms in owner-occupied houses - 1 bedroom (%)
Bedrooms in owner-occupied houses - 2 bedrooms (%)
Bedrooms in owner-occupied houses - 3 bedrooms (%)
Bedrooms in owner-occupied houses - 4 bedrooms (%)
Bedrooms in owner-occupied houses - 5+ bedrooms (%)
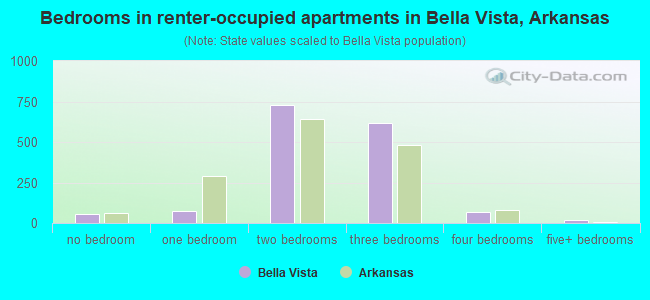
Bedrooms in renter-occupied houses - no bedrooms (%)
Bedrooms in renter-occupied houses - 1 bedroom (%)
Bedrooms in renter-occupied houses - 2 bedrooms (%)
Bedrooms in renter-occupied houses - 3 bedrooms (%)
Bedrooms in renter-occupied houses - 4 bedrooms (%)
Bedrooms in renter-occupied houses - 5+ bedrooms (%)
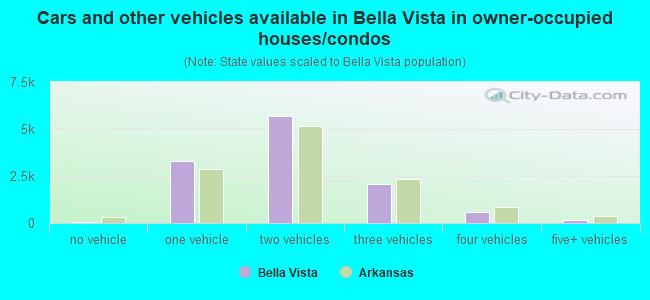
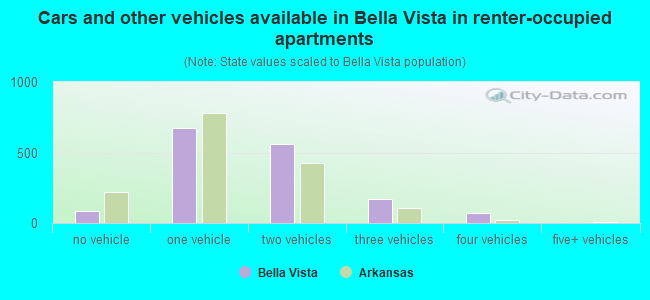
Vehicles available in owner-occupied houses - no vehicle available (%)
Vehicles available in owner-occupied houses - 1 vehicle available(%)
Vehicles available in owner-occupied houses - 2 Vehicles available (%)
Vehicles available in owner-occupied houses - 3 Vehicles available (%)
Vehicles available in owner-occupied houses - 4 Vehicles available (%)
Vehicles available in owner-occupied houses - 5+ Vehicles available (%)
Vehicles available in renter-occupied houses - no vehicle available (%)
Vehicles available in renter-occupied houses - 1 vehicle available (%)
Vehicles available in renter-occupied houses - 2 Vehicles available (%)
Vehicles available in renter-occupied houses - 3 Vehicles available (%)
Vehicles available in renter-occupied houses - 4 Vehicles available (%)
Vehicles available in renter-occupied houses - 5+ Vehicles available (%)
Housing units in structures - 1, detached (%)
Housing units in structures - 1, attached (%)
Housing units in structures - 2 (%)
Housing units in structures - 3 or 4 (%)
Housing units in structures - 5 to 9 (%)
Housing units in structures - 10 to 19 (%)
Housing units in structures - 20 to 49 (%)
Housing units in structures - 50 or more (%)
Housing units in structures - Mobile home (%)
Housing units in structures - Boat, RV, van, etc. (%)
Housing units in structures - Owners - 1, detached (%)
Housing units in structures - Owners - 1, attached (%)
Housing units in structures - Owners - 2 (%)
Housing units in structures - Owners - 3 or 4 (%)
Housing units in structures - Owners - 5 to 9 (%)
Housing units in structures - Owners - 10 to 19 (%)
Housing units in structures - Owners - 20 to 49 (%)
Housing units in structures - Owners - 50 or more (%)
Housing units in structures - Owners - Mobile home (%)
Housing units in structures - Owners - Boat, RV, van, etc. (%)
Housing units in structures - Renters - 1, detached (%)
Housing units in structures - Renters - 1, attached (%)
Housing units in structures - Renters - 2 (%)
Housing units in structures - Renters - 3 or 4 (%)
Housing units in structures - Renters - 5 to 9 (%)
Housing units in structures - Renters - 10 to 19 (%)
Housing units in structures - Renters - 20 to 49 (%)
Housing units in structures - Renters - 50 or more (%)
Housing units in structures - Renters - Mobile home (%)
Housing units in structures - Renters - Boat, RV, van, etc. (%)
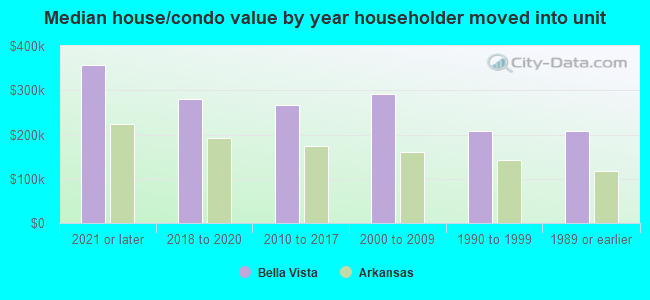
House/condo owner moved in on average (years ago)
Renter moved in on average (years ago)
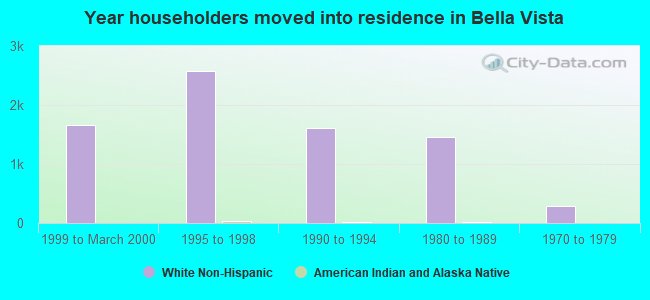
Year householder moved into unit - Moved in 1999 to March 2000 (%)
Year householder moved into unit - Moved in 1999 to March 2000 (%) - White
Year householder moved into unit - Moved in 1999 to March 2000 (%) - Black or African American
Year householder moved into unit - Moved in 1999 to March 2000 (%) - Asian
Year householder moved into unit - Moved in 1999 to March 2000 (%) - Hispanic or Latino
Year householder moved into unit - Moved in 1999 to March 2000 (%) - American Indian and Alaska Native
Year householder moved into unit - Moved in 1999 to March 2000 (%) - Multirace
Year householder moved into unit - Moved in 1999 to March 2000 (%) - Other Race
Year householder moved into unit - Moved in 1995 to 1998 (%)
Year householder moved into unit - Moved in 1995 to 1998 (%) - White
Year householder moved into unit - Moved in 1995 to 1998 (%) - Black or African American
Year householder moved into unit - Moved in 1995 to 1998 (%) - Asian
Year householder moved into unit - Moved in 1995 to 1998 (%) - Hispanic or Latino
Year householder moved into unit - Moved in 1995 to 1998 (%) - American Indian and Alaska Native
Year householder moved into unit - Moved in 1995 to 1998 (%) - Multirace
Year householder moved into unit - Moved in 1995 to 1998 (%) - Other Race
Year householder moved into unit - Moved in 1990 to 1994 (%)
Year householder moved into unit - Moved in 1990 to 1994 (%) - White
Year householder moved into unit - Moved in 1990 to 1994 (%) - Black or African American
Year householder moved into unit - Moved in 1990 to 1994 (%) - Asian
Year householder moved into unit - Moved in 1990 to 1994 (%) - Hispanic or Latino
Year householder moved into unit - Moved in 1990 to 1994 (%) - American Indian and Alaska Native
Year householder moved into unit - Moved in 1990 to 1994 (%) - Multirace
Year householder moved into unit - Moved in 1990 to 1994 (%) - Other Race
Year householder moved into unit - Moved in 1980 to 1989 (%)
Year householder moved into unit - Moved in 1980 to 1989 (%) - White
Year householder moved into unit - Moved in 1980 to 1989 (%) - Black or African American
Year householder moved into unit - Moved in 1980 to 1989 (%) - Asian
Year householder moved into unit - Moved in 1980 to 1989 (%) - Hispanic or Latino
Year householder moved into unit - Moved in 1980 to 1989 (%) - American Indian and Alaska Native
Year householder moved into unit - Moved in 1980 to 1989 (%) - Multirace
Year householder moved into unit - Moved in 1980 to 1989 (%) - Other Race
Year householder moved into unit - Moved in 1970 to 1979 (%)
Year householder moved into unit - Moved in 1970 to 1979 (%) - White
Year householder moved into unit - Moved in 1970 to 1979 (%) - Black or African American
Year householder moved into unit - Moved in 1970 to 1979 (%) - Asian
Year householder moved into unit - Moved in 1970 to 1979 (%) - Hispanic or Latino
Year householder moved into unit - Moved in 1970 to 1979 (%) - American Indian and Alaska Native
Year householder moved into unit - Moved in 1970 to 1979 (%) - Multirace
Year householder moved into unit - Moved in 1970 to 1979 (%) - Other Race
Year householder moved into unit - Moved in 1969 or earlier (%)
Year householder moved into unit - Moved in 1969 or earlier (%) - White
Year householder moved into unit - Moved in 1969 or earlier (%) - Black or African American
Year householder moved into unit - Moved in 1969 or earlier (%) - Asian
Year householder moved into unit - Moved in 1969 or earlier (%) - Hispanic or Latino
Year householder moved into unit - Moved in 1969 or earlier (%) - American Indian and Alaska Native
Year householder moved into unit - Moved in 1969 or earlier (%) - Multirace
Year householder moved into unit - Moved in 1969 or earlier (%) - Other Race
Housing units lacking complete plumbing facilities (%)
Housing units lacking complete kitchen facilities (%)
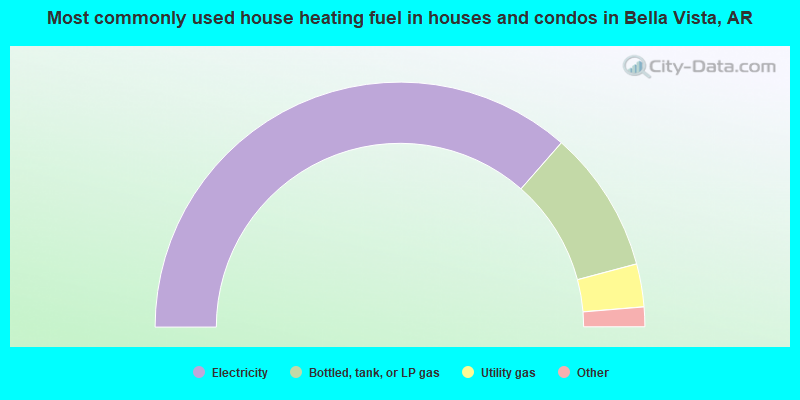
House heating fuel used in houses and condos - Utility gas (%)
House heating fuel used in houses and condos - Bottled, tank, or LP gas (%)
House heating fuel used in houses and condos - Electricity (%)
House heating fuel used in houses and condos - Fuel oil, kerosene, etc. (%)
House heating fuel used in houses and condos - Coal or coke (%)
House heating fuel used in houses and condos - Wood (%)
House heating fuel used in houses and condos - Solar energy (%)
House heating fuel used in houses and condos - Other fuel (%)
House heating fuel used in houses and condos - No fuel used (%)
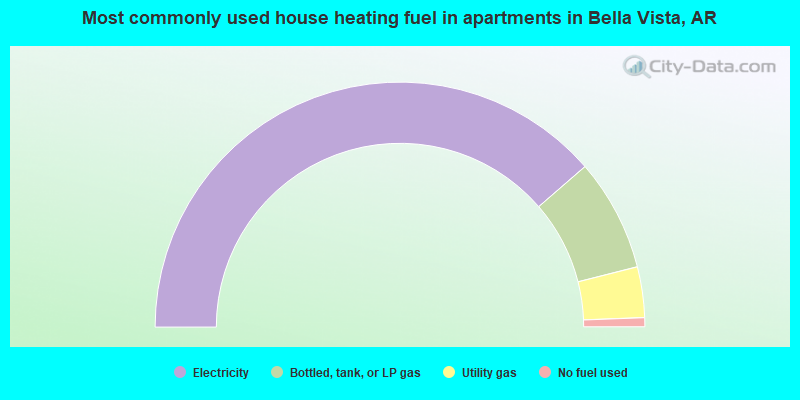
House heating fuel used in apartments - Utility gas (%)
House heating fuel used in apartments - Bottled, tank, or LP gas (%)
House heating fuel used in apartments - Electricity (%)
House heating fuel used in apartments - Fuel oil, kerosene, etc. (%)
House heating fuel used in apartments - Coal or coke (%)
House heating fuel used in apartments - Wood (%)
House heating fuel used in apartments - Solar energy (%)
House heating fuel used in apartments - Other fuel (%)
House heating fuel used in apartments - No fuel used (%)
Median year house/condo built: 1998Median year apartment built: 1989Household type by relationship:
Households: 32,024
Male householders: 7,205 (1,191 living alone ), Female householders: 6,039 (1,771 living alone )8,866 spouses (8,823 opposite-sex spouses ), 539 unmarried partners , (449 opposite-sex unmarried partners ), 7,303 children (6,813 natural , 174 adopted , 316 stepchildren ), 491 grandchildren , 234 brothers or sisters , 398 parents , 0 foster children , 274 other relatives , 524 non-relatives In group quarters: 145
Size of family households: 6,069 2-persons , 1,705 3-persons , 1,028 4-persons , 778 5-persons , 134 6-persons , 158 7-or-more-persons .
Size of nonfamily households: 3,242 1-person , 354 2-persons , 41 3-persons .
4,758 married couples with children. single-parent households (135 men , 381 women ).
98.1% of residents of Bella Vista speak English at home. of residents speak Spanish at home (90% speak English very well , 3% speak English well , 7% speak English not well ).of residents speak other Indo-European language at home (100% speak English very well ).of residents speak Asian or Pacific Island language at home (88% speak English very well , 12% speak English well ).
Foreign born population: 810 (2.5%)of them are naturalized citizens )
Median number of rooms in houses and condos:
Median number of rooms in apartments
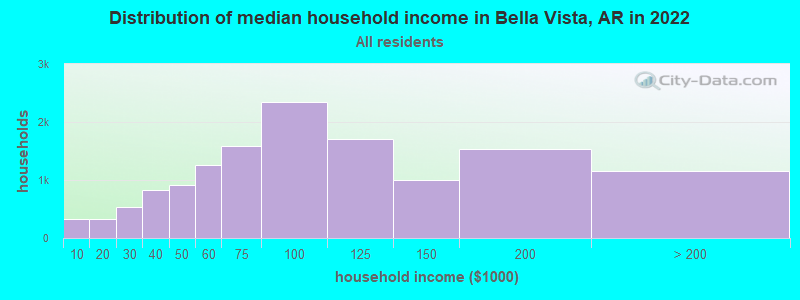
Bella Vista, AR household income distribution 326 Less than $10,000324 $10,000 to $19,999529 $20,000 to $29,999831 $30,000 to $39,999908 $40,000 to $49,9991,252 $50,000 to $59,9991,582 $60,000 to $74,9992,339 $75,000 to $99,9991,711 $100,000 to $124,999997 $125,000 to $149,9991,540 $150,000 to $199,9991,154 $200,000 or more
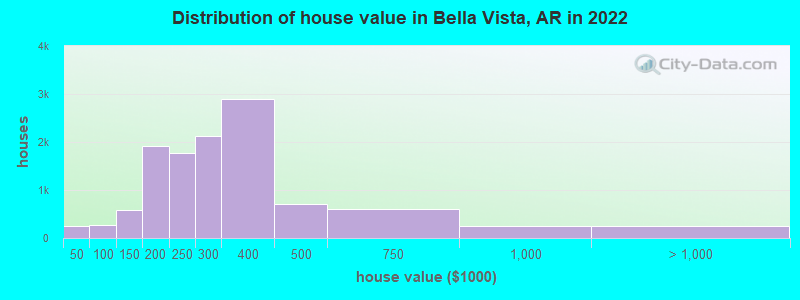
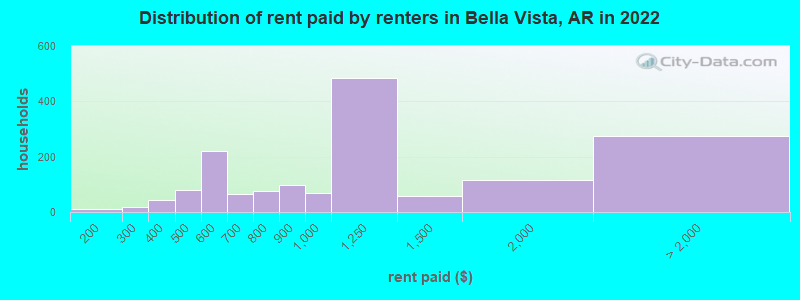
Home value of owner - occupied houses in 2022 in Bella Vista, AR 13 Less than $10,0005 $10,000 to $14,99991 $15,000 to $19,99951 $20,000 to $24,99950 $25,000 to $29,99917 $35,000 to $39,99911 $40,000 to $49,99941 $50,000 to $59,999116 $70,000 to $79,99981 $80,000 to $89,99920 $90,000 to $99,999238 $100,000 to $124,999349 $125,000 to $149,999958 $150,000 to $174,999951 $175,000 to $199,9991,775 $200,000 to $249,9992,116 $250,000 to $299,9992,889 $300,000 to $399,999704 $400,000 to $499,999599 $500,000 to $749,999244 $750,000 to $999,99935 $1,000,000 to $1,499,99975 $1,500,000 to $1,999,999149 $2,000,000 or moreRent paid by renters in 2022 in Bella Vista, AR 12 $100 to $14916 $200 to $24945 $350 to $39964 $400 to $44915 $450 to $4995 $500 to $549215 $550 to $59941 $600 to $64923 $650 to $69924 $700 to $74953 $750 to $79995 $800 to $89970 $900 to $999483 $1,000 to $1,24957 $1,250 to $1,499116 $1,500 to $1,9997 $2,000 to $2,49958 $3,000 to $3,49910 $3,500 or more199 No cash rent
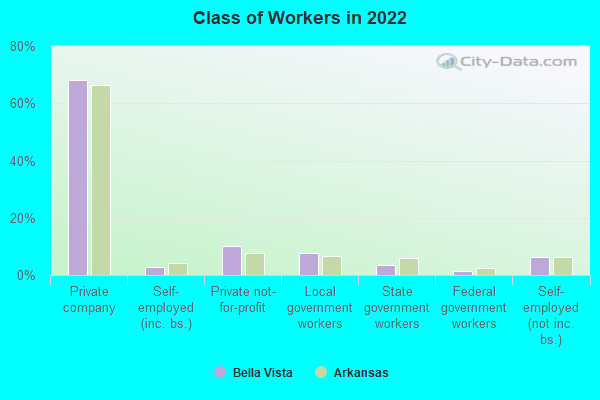
Percentage of workers working in this county: 89.2%Number of people working at home: 2,589 (18.1% of all workers )
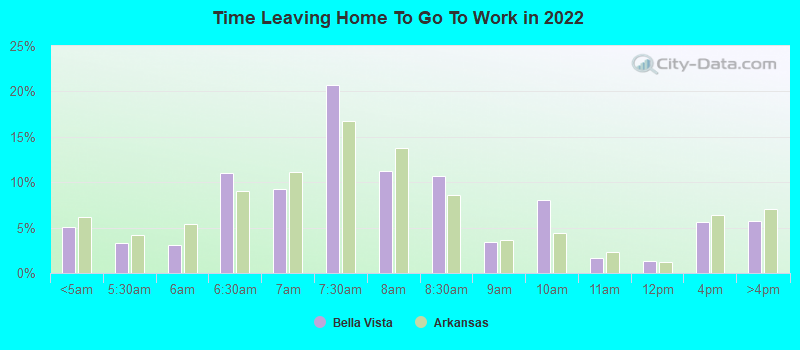
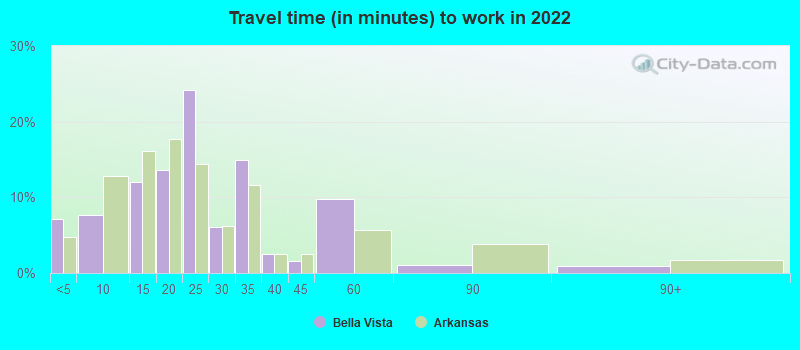
Travel time to work (commute)
Less than 5 minutes: 3595 to 9 minutes: 36410 to 14 minutes: 77215 to 19 minutes: 1,42420 to 24 minutes: 2,78025 to 29 minutes: 1,80330 to 34 minutes: 2,58335 to 39 minutes: 38240 to 44 minutes: 41545 to 59 minutes: 73260 to 89 minutes: 17690 or more minutes: 254
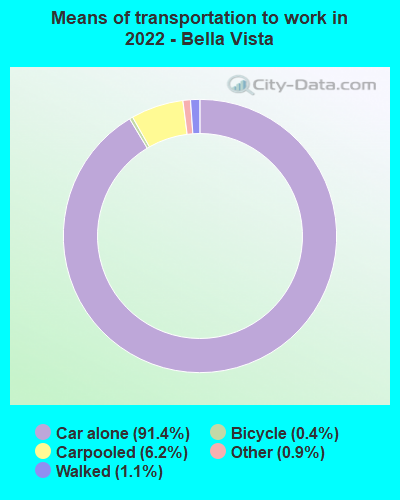
Means of transportation to work:
Drove a car alone: 2,704 (53.0%)Carpooled: 175 (3.4%)Taxi: 29 (0.6%)Bicycle: 10 (0.2%)Walked: 53 (1.0%)Worked at home: 2,589 (50.7%)
Unemployment by race in 2022
Unemployment rate for White non-Hispanic residents 3.7% Males3.9% FemalesUnemployment rate for Black residents 51.2% MalesUnemployment rate for other race residents 100.0% FemalesUnemployment rate for two or more race residents 1.9% Males5.3% FemalesUnemployment rate for Hispanic or Latino residents 1.6% Females
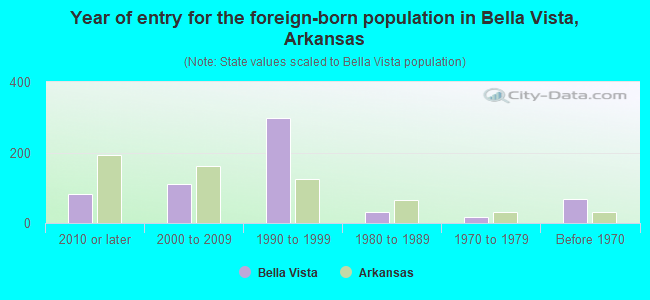
Year of entry for the foreign-born population in Bella Vista, Arkansas
81 2010 or later 110 2000 to 2009 298 1990 to 1999 31 1980 to 1989 17 1970 to 1979 68 Before 1970
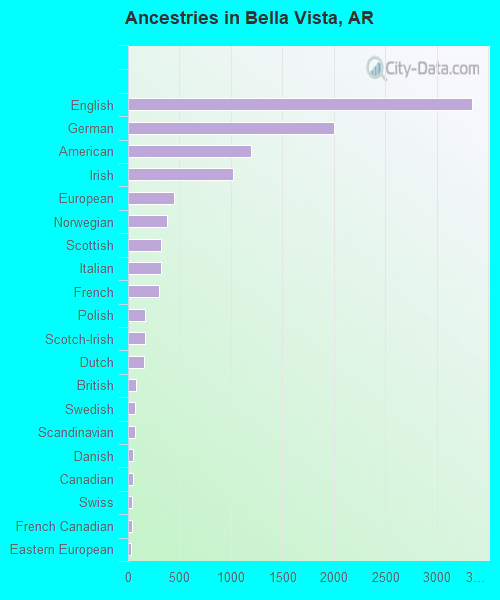
First ancestries reported:
English: 3,343 (26.7%)
German: 2,002 (16.0%)
American: 1,200 (9.6%)
Irish: 1,025 (8.2%)
European: 449 (3.6%)
Norwegian: 383 (3.1%)
Scottish: 324 (2.6%)
Italian: 322 (2.6%)
French: 301 (2.4%)
Polish: 167 (1.3%)
Scotch-Irish: 163 (1.3%)
Dutch: 154 (1.2%)
British: 76 (0.6%)
Swedish: 72 (0.6%)
Scandinavian: 67 (0.5%)
Danish: 52 (0.4%)
Canadian: 51 (0.4%)
Swiss: 42 (0.3%)
French Canadian: 39 (0.3%)
Eastern European: 31 (0.2%)
Czech: 23 (0.2%)
South African: 16 (0.1%)
Pennsylvania German: 15 (0.1%)
Croatian: 14 (0.1%)
Slovene: 14 (0.1%)
Cajun: 13 (0.1%)
Czechoslovakian: 13 (0.1%)
Russian: 13 (0.1%)
Greek: 11 (0.09%)
Serbian: 9 (0.07%)
African: 9 (0.07%)
Ukrainian: 9 (0.07%)
Yugoslavian: 8 (0.06%)
Finnish: 3 (0.02%)
Hungarian: 2 (0.02%)
Northern European: 2 (0.02%) Most common places of birth for foreign-born residents (%): Mexico Bella Vista:
44.4% (336)Arkansas:
40.2% (61,075)
United Kingdom, excluding England and Scotland Bella Vista:
10.7% (81)Arkansas:
0.8% (1,283)
South Africa Bella Vista:
9.6% (73)Arkansas:
0.5% (800)
Canada Bella Vista:
5.7% (43)Arkansas:
1.4% (2,174)
China, excluding Hong Kong and Taiwan Bella Vista:
5.4% (41)Arkansas:
2.3% (3,503)
England Bella Vista:
3.8% (29)Arkansas:
0.9% (1,434)
Germany Bella Vista:
3.6% (27)Arkansas:
1.8% (2,721)
India Bella Vista:
3.6% (27)Arkansas:
6.1% (9,278)
Czechoslovakia (includes Czech Republic and Slovakia) Bella Vista:
1.7% (13)Arkansas:
0.1% (174)
Korea Bella Vista:
1.7% (13)Arkansas:
1.2% (1,813)
Place of birth for U.S.-born residents:
This state: 9,698Other state: 21,191Northeast: 924Midwest: 9,510South: 6,099West: 4,513 89.1% of Bella Vista residents lived in the same house 1 years ago.
Out of people who lived in different houses, 30.5% lived in this county.
Out of people who lived in different counties, 21.4% lived in Arkansas.
Bella Vista:
89.1%State average:
87.0%
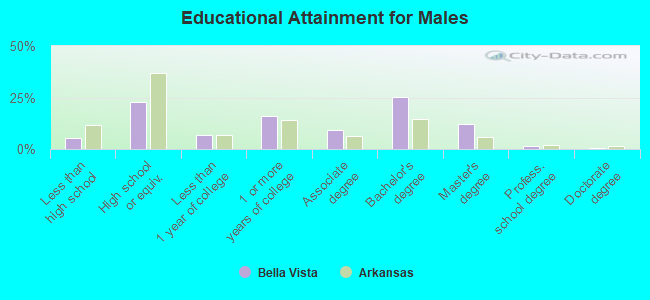
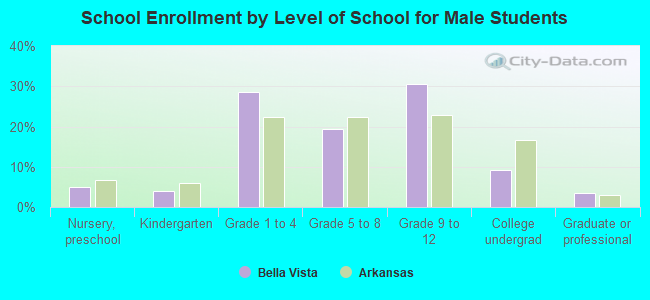
Education attainment for males 25 years and older:
No schooling: 30Nursery to 4th grade: 05th and 6th grade: 47th and 8th grade: 299th grade: 2810th grade: 21011th grade: 5612th grade, no diploma: 325High school graduate (or equivalency): 2,815Less than 1 year of college: 829Some college more than 1 year, no degree: 1,999Associate degree: 1,126Bachelor's degree: 3,147Master's degree: 1,515Professional school degree: 172Doctorate degree: 76
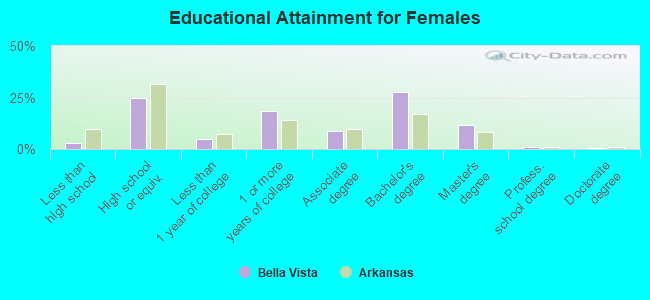
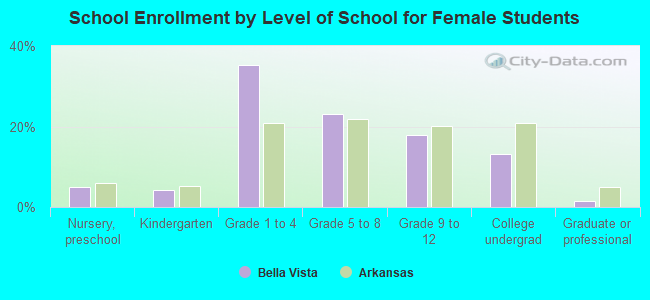
Education attainment for females 25 years and older:
No schooling: 82Nursery to 4th grade: 05th and 6th grade: 447th and 8th grade: 739th grade: 1610th grade: 7811th grade: 1012th grade, no diploma: 42High school graduate (or equivalency): 3,179Less than 1 year of college: 607Some college more than 1 year, no degree: 2,361Associate degree: 1,140Bachelor's degree: 3,559Master's degree: 1,468Professional school degree: 134Doctorate degree: 66
Housing units in structures:
One, detached: 13,381One, attached: 787Two: 793 or 4: 1465 to 9: 6110 to 19: 9420 to 49: 7750 or more: 65Mobile homes: 161Housing units lacking complete plumbing facilities in 2022: 1.0%Housing units lacking complete kitchen facilities in 2022: 2.3%House/condo owner moved in on average 7 years ago
Renter moved in on average 3 years ago
Private vs. public school enrollment:
Students in private schools in grades 1 to 8 (elementary and middle school): 336 Students in private schools in grades 9 to 12 (high school): 118 Students in private undergraduate colleges: 120