Bellingham, WA (Washington) Houses and Residents
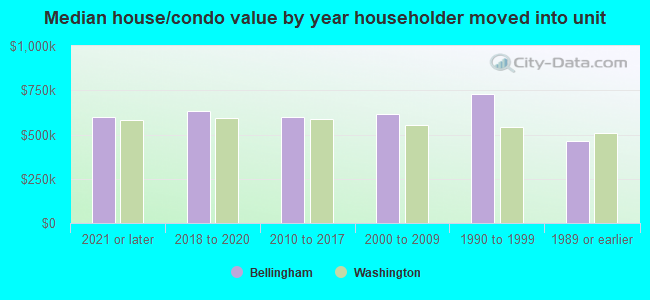
| Bellingham: | $609,100 |
| Washington: | $569,500 |
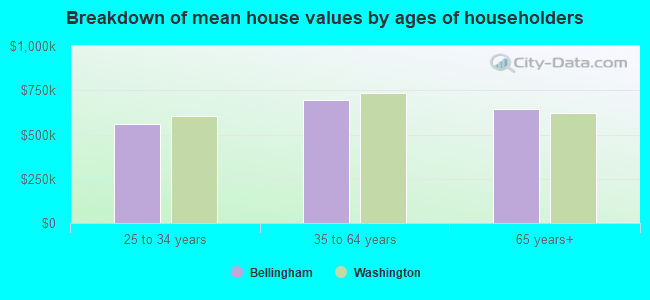
Mean price in 2022:
Detached houses: $750,600
Here: $750,600 State: $734,307 Townhouses or other attached units: $509,248
Here: $509,248 State: $657,697 In 2-unit structures: $663,885
Here: $663,885 State: $534,634 In 3-to-4-unit structures: $309,441
Here: $309,441 State: $510,239 In 5-or-more-unit structures: $365,700
Here: $365,700 State: $503,183 Mobile homes: $181,654
Here: $181,654 State: $218,362
Total population: 83,365 (Urban population: 66,470, Rural population: 345 (all nonfarm))
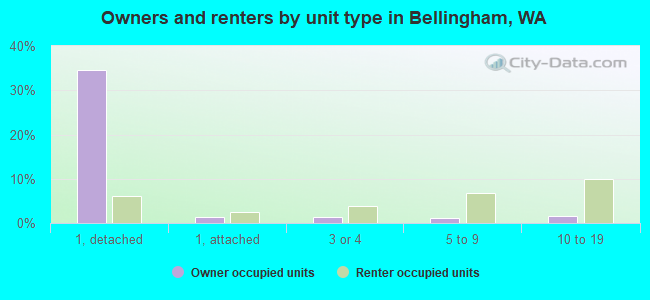
Houses: 43,973 (41,746 occupied: 18,615 owner occupied, 23,131 renter occupied)
| % of renters here: | 55% |
| State: | 36% |
Housing density: 1,715 houses/condos per square mile
Median price asked for vacant for-sale houses and condos in 2022: $535,658.
Median contract rent in 2022: $1,372 (lower quartile is $1,104, upper quartile is $1,720)
Median rent asked for vacant for-rent units in 2022: $1,602
Median gross rent in Bellingham, WA in 2022: $1,424
Housing units in Bellingham with a mortgage: 12,251 (1,355 second mortgage, 0 home equity loan, 1,169 both second mortgage and home equity loan)
Houses without a mortgage: 153
Median household income for houses/condos with a mortgage: $113,863
Median household income for apartments without a mortgage: $72,500
Median monthly housing costs: $1,434
Compare current foreclosures in Bellingham, WA:
| Photo | Address | Area | Beds / Baths | Price | Details |
|---|---|---|---|---|---|

|
#1
15th St
Bellingham, WA 98225
|
2,970 sq. feet
|
2 baths 3 beds |
show details | |

|
#2
Marigold Dr Unit 36
Bellingham, WA 98229
|
460 sq. feet
|
1 baths 1 beds |
show details | |

|
#3
Marigold Dr
Bellingham, WA 98229
|
2,182 sq. feet
|
3 baths 3 beds |
show details | |

|
#4
Michigan St # A
Bellingham, WA 98229
|
2,472 sq. feet
|
2 baths 2 beds |
show details | |

|
#5
Sterling Dr
Bellingham, WA 98226
|
1,222 sq. feet
|
1 baths 2 beds |
show details | |

|
#6
Yew Street Rd
Bellingham, WA 98229
|
1,120 sq. feet
|
1 baths 2 beds |
show details | |

|
#7
12th St
Bellingham, WA 98225
|
1,914 sq. feet
|
2 baths 3 beds |
show details | |

|
#8
W Lake Samish Dr
Bellingham, WA 98229
|
4,242 sq. feet
|
2 baths 3 beds |
show details | |

|
#9
Dover St
Bellingham, WA 98226
|
1,606 sq. feet
|
2 baths 3 beds |
show details | |

|
#10
Westhills Pl
Bellingham, WA 98226
|
3,114 sq. feet
|
2 baths 3 beds |
show details |
| Photo | Address | Area | Beds / Baths | Price | Details |
|---|---|---|---|---|---|

|
#11
Otis St
Bellingham, WA 98225
|
726 sq. feet
|
1 baths 2 beds |
show details | |

|
#12
Hampton Pl
Bellingham, WA 98225
|
881 sq. feet
|
1 baths 2 beds |
show details | |

|
#13
Everson Goshen Rd
Bellingham, WA 98226
|
2,021 sq. feet
|
2 baths 3 beds |
show details | |

|
#14
Lincoln St Unit 123
Bellingham, WA 98229
|
784 sq. feet
|
1 baths 2 beds |
show details | |

|
#15
S State St Apt 416
Bellingham, WA 98225
|
815 sq. feet
|
1 baths 1 beds |
show details | |

|
#16
Valencia St
Bellingham, WA 98226
|
888 sq. feet
|
1 baths 3 beds |
show details | |

|
#17
Irving St
Bellingham, WA 98225
|
1,140 sq. feet
|
1 baths 3 beds |
show details | |

|
#18
Flynn St Spc 51
Bellingham, WA 98229
|
784 sq. feet
|
1 baths 2 beds |
show details | |

|
#19
Horseshoe Cir
Bellingham, WA 98229
|
1,229 sq. feet
|
2 baths 2 beds |
show details | |

|
#20
N Grace Ln
Bellingham, WA 98226
|
2,220 sq. feet
|
2 baths 3 beds |
show details |
| Photo | Address | Area | Beds / Baths | Price | Details |
|---|---|---|---|---|---|

|
#21
Cottonwood Ave
Bellingham, WA 98225
|
1,235 sq. feet
|
1 baths 3 beds |
show details | |

|
#22
Old Samish Rd
Bellingham, WA 98229
|
2,240 sq. feet
|
2 baths 6 beds |
show details | |

|
#23
Undine St
Bellingham, WA 98226
|
1,664 sq. feet
|
1 baths 2 beds |
show details | |

|
#24
Ellis St
Bellingham, WA 98225
|
952 sq. feet
|
2 baths 2 beds |
show details | |

|
#25
Northwest Ave
Bellingham, WA 98225
|
1,101 sq. feet
|
1 baths 2 beds |
show details | |

|
#26
W Maplewood Ave
Bellingham, WA 98225
|
2,261 sq. feet
|
2 baths 3 beds |
show details | |

|
#27
Old Highway 99 North Rd # 99
Bellingham, WA 98229
|
1,607 sq. feet
|
3 baths - beds |
show details | |

|
#28
W Illinois St
Bellingham, WA 98225
|
- sq. feet
|
- baths - beds |
show details | |

|
#29
Woburn St
Bellingham, WA 98229
|
- sq. feet
|
- baths - beds |
show details | |

|
#30
Fraser St Apt 101
Bellingham, WA 98229
|
- sq. feet
|
- baths - beds |
show details |
| Photo | Address | Area | Beds / Baths | Price | Details |
|---|---|---|---|---|---|

|
#31
Williamson Way
Bellingham, WA 98226
|
20,740 sq. feet
|
- baths - beds |
show details | |

|
#32
Carolina St Apt 103
Bellingham, WA 98229
|
- sq. feet
|
- baths - beds |
show details | |

|
#33
Aurora Loop Apt 102
Bellingham, WA 98226
|
- sq. feet
|
- baths - beds |
show details | |

|
#34
Queen St Apt 3
Bellingham, WA 98226
|
- sq. feet
|
- baths - beds |
show details | |

|
#35
Ohio St Ste 108
Bellingham, WA 98225
|
- sq. feet
|
- baths - beds |
show details | |

|
#36
Shooting Star Ct
Bellingham, WA 98229
|
- sq. feet
|
- baths - beds |
show details | |

|
#37
Woodstock Way Apt 301d
Bellingham, WA 98226
|
- sq. feet
|
- baths - beds |
show details | |

|
#38
Marine Dr
Bellingham, WA 98225
|
- sq. feet
|
- baths - beds |
show details | |

|
#39
N State St
Bellingham, WA 98225
|
5,800 sq. feet
|
- baths - beds |
show details | |

|
#40
Yew Street Rd
Bellingham, WA 98229
|
- sq. feet
|
- baths - beds |
show details |
| Photo | Address | Area | Beds / Baths | Price | Details |
|---|---|---|---|---|---|

|
#41
Dupont St, C O Mark Lackey Belcher S
Bellingham, WA 98225
|
9,285 sq. feet
|
- baths - beds |
show details | |

|
#42
Meadowbrook Ct Apt 202
Bellingham, WA 98226
|
- sq. feet
|
- baths - beds |
show details | |

|
#43
Elwood Ave Apt 208
Bellingham, WA 98225
|
- sq. feet
|
- baths - beds |
show details | |

|
#44
Bradley Ln Apt D
Bellingham, WA 98225
|
- sq. feet
|
- baths - beds |
show details | |

|
#45
E Smith Rd
Bellingham, WA 98226
|
- sq. feet
|
- baths - beds |
show details | |

|
#46
Madrona St
Bellingham, WA 98225
|
- sq. feet
|
- baths - beds |
show details | |

|
#47
Gloria Ln
Bellingham, WA 98226
|
- sq. feet
|
- baths - beds |
show details | |

|
#48
Fuschia Dr, Apt 202
Bellingham, WA 98226
|
- sq. feet
|
- baths - beds |
show details | |

|
#49
Primrose Ln Apt 402
Bellingham, WA 98226
|
- sq. feet
|
- baths - beds |
show details | |

|
Check over 1 million property listings on Foreclosure.com!
|
browse all offers | |||

Latest news about housing in Bellingham, WA collected exclusively by city-data.com from local newspapers, TV, and radio stations

 | Bellingham waterfront development condos (43 replies) |
| What is the deal with the insane Bellingham housing market?? (141 replies) |
| Moving to Bellingham and need apartment or house rental help (10 replies) |
| rental houses in Bellingham (3 replies) |
| rental houses in Bellingham (1 reply) |
| Advice please re mold in PNW homes (20 replies) |
Median year apartment built: 1996
Household type by relationship:
Households: 93,899- Male householders: 19,983 (7,489 living alone), Female householders: 21,763 (8,274 living alone)
14,308 spouses (14,021 opposite-sex spouses), 4,505 unmarried partners, (3,883 opposite-sex unmarried partners), 17,524 children (16,962 natural, 214 adopted, 348 stepchildren), 768 grandchildren, 311 brothers or sisters, 377 parents, 0 foster children, 329 other relatives, 9,900 non-relatives
- In group quarters: 4,131
Size of family households: 8,465 2-persons, 4,199 3-persons, 2,331 4-persons, 1,135 5-persons, 926 6-persons, 312 7-or-more-persons.
Size of nonfamily households: 15,763 1-person, 6,503 2-persons, 1,435 3-persons, 408 4-persons, 81 5-persons, 188 7-or-more-persons.
7,901 married couples with children.
3,167 single-parent households (589 men, 2,578 women).
87.6% of residents of Bellingham speak English at home.
5.4% of residents speak Spanish at home (67% speak English very well, 21% speak English well, 11% speak English not well, 1% don't speak English at all).
2.6% of residents speak other Indo-European language at home (81% speak English very well, 12% speak English well, 7% speak English not well).
3.7% of residents speak Asian or Pacific Island language at home (67% speak English very well, 18% speak English well, 13% speak English not well, 3% don't speak English at all).
0.4% of residents speak other language at home (84% speak English very well, 6% speak English well, 3% speak English not well, 7% don't speak English at all).
Foreign born population: 10,124 (10.8%)
(68.6% of them are naturalized citizens)
| Here: | 6.0 |
| State: | 6.5 |
| Here: | 3.5 |
| State: | 3.9 |
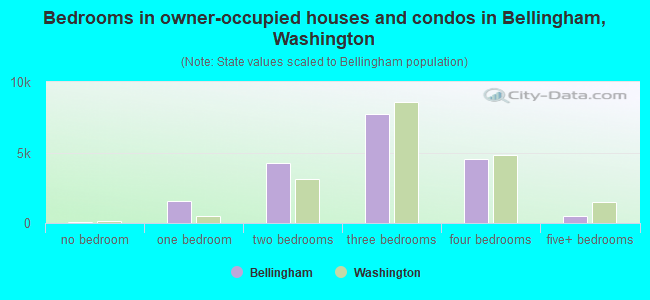
- Bedrooms in owner-occupied houses and condos in Bellingham, Washington
- 55no bedroom
- 1,5861 bedroom
- 4,2902 bedrooms
- 7,7133 bedrooms
- 4,5064 bedrooms
- 4655+ bedrooms
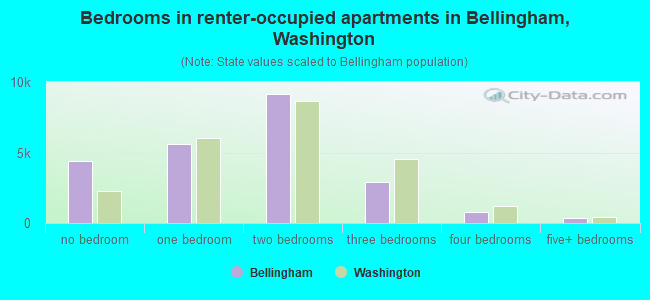
- Bedrooms in renter-occupied apartments in Bellingham, Washington
- 4,399no bedroom
- 5,5811 bedroom
- 9,1202 bedrooms
- 2,8883 bedrooms
- 8134 bedrooms
- 3305+ bedrooms
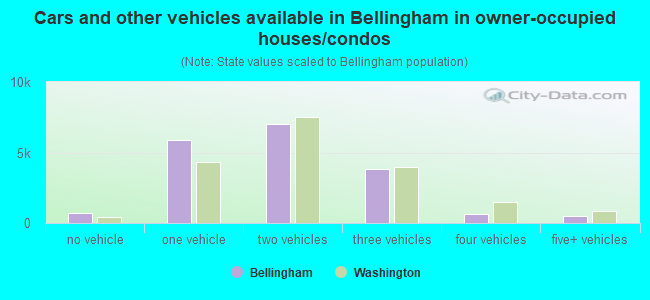
- Cars and other vehicles available in Bellingham in owner-occupied houses/condos
- 690no vehicle
- 5,9151 vehicle
- 7,0372 vehicles
- 3,8063 vehicles
- 6504 vehicles
- 5175+ vehicles
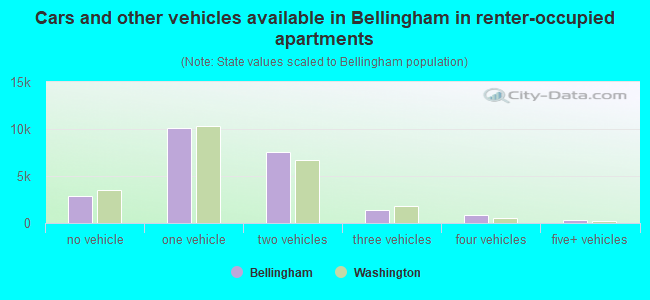
- Cars and other vehicles available in Bellingham in renter-occupied apartments
- 2,872no vehicle
- 10,0911 vehicle
- 7,5392 vehicles
- 1,3723 vehicles
- 8984 vehicles
- 3595+ vehicles
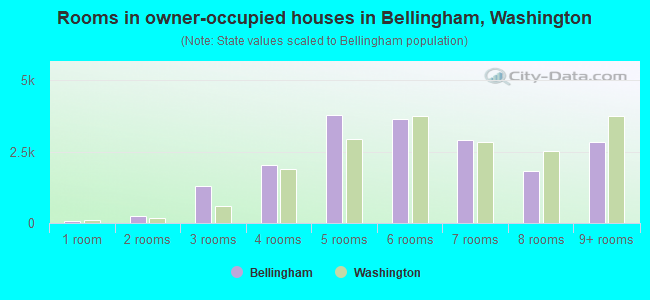
- Rooms in owner-occupied houses in Bellingham, Washington
- 551 room
- 2532 rooms
- 1,2943 rooms
- 2,0274 rooms
- 3,7875 rooms
- 3,6476 rooms
- 2,9007 rooms
- 1,8128 rooms
- 2,8409+ rooms
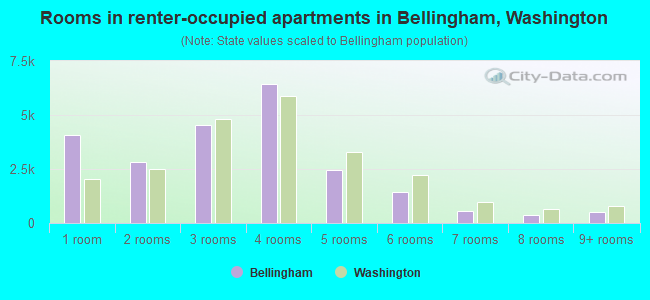
- Rooms in renter-occupied apartments in Bellingham, Washington
- 4,0691 room
- 2,8182 rooms
- 4,5603 rooms
- 6,4184 rooms
- 2,4395 rooms
- 1,4176 rooms
- 5687 rooms
- 3528 rooms
- 4909+ rooms
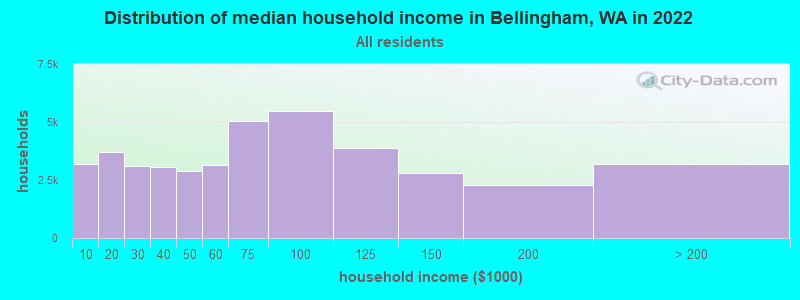
Bellingham, WA household income distribution

- 3,170Less than $10,000
- 3,727$10,000 to $19,999
- 3,101$20,000 to $29,999
- 3,043$30,000 to $39,999
- 2,907$40,000 to $49,999
- 3,134$50,000 to $59,999
- 5,046$60,000 to $74,999
- 5,460$75,000 to $99,999
- 3,862$100,000 to $124,999
- 2,804$125,000 to $149,999
- 2,306$150,000 to $199,999
- 3,186$200,000 or more
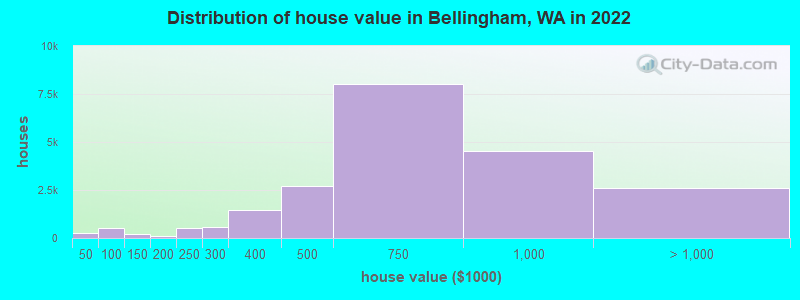
Home value of owner - occupied houses in 2022 in Bellingham, WA
-
- 46Less than $10,000
- 5$10,000 to $14,999
- 38$15,000 to $19,999
- 7$20,000 to $24,999
- 60$30,000 to $34,999
- 9$35,000 to $39,999
- 85$40,000 to $49,999
- 170$50,000 to $59,999
- 46$60,000 to $69,999
- 33$70,000 to $79,999
- 88$80,000 to $89,999
- 87$90,000 to $99,999
- 119$100,000 to $124,999
- 108$125,000 to $149,999
- 53$150,000 to $174,999
- 73$175,000 to $199,999
- 523$200,000 to $249,999
- 554$250,000 to $299,999
- 1,456$300,000 to $399,999
- 2,722$400,000 to $499,999
- 8,035$500,000 to $749,999
- 4,507$750,000 to $999,999
- 1,670$1,000,000 to $1,499,999
- 440$1,500,000 to $1,999,999
- 511$2,000,000 or more
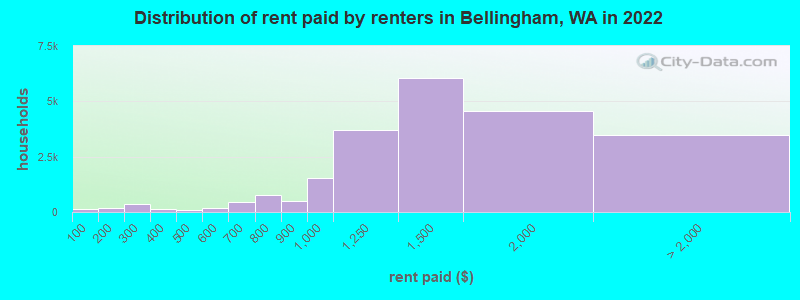
Rent paid by renters in 2022 in Bellingham, WA
-
- 129Less than $100
- 72$100 to $149
- 126$150 to $199
- 156$200 to $249
- 215$250 to $299
- 112$300 to $349
- 31$350 to $399
- 76$400 to $449
- 19$450 to $499
- 116$500 to $549
- 68$550 to $599
- 169$600 to $649
- 302$650 to $699
- 462$700 to $749
- 314$750 to $799
- 474$800 to $899
- 1,539$900 to $999
- 3,686$1,000 to $1,249
- 6,038$1,250 to $1,499
- 4,573$1,500 to $1,999
- 1,980$2,000 to $2,499
- 296$2,500 to $2,999
- 163$3,000 to $3,499
- 759$3,500 or more
- 280No cash rent
Percentage of workers working in this county: 92.3%
Number of people working at home: 9,075 (17.5% of all workers)
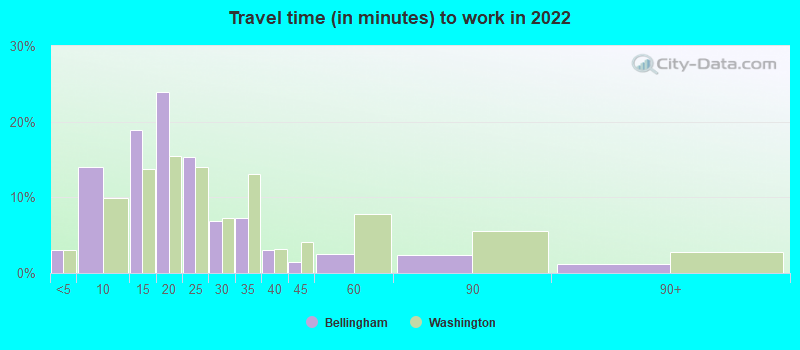
Travel time to work (commute)
- Less than 5 minutes: 1,494
- 5 to 9 minutes: 7,663
- 10 to 14 minutes: 9,992
- 15 to 19 minutes: 10,776
- 20 to 24 minutes: 4,377
- 25 to 29 minutes: 2,074
- 30 to 34 minutes: 2,008
- 35 to 39 minutes: 663
- 40 to 44 minutes: 532
- 45 to 59 minutes: 1,316
- 60 to 89 minutes: 1,500
- 90 or more minutes: 483
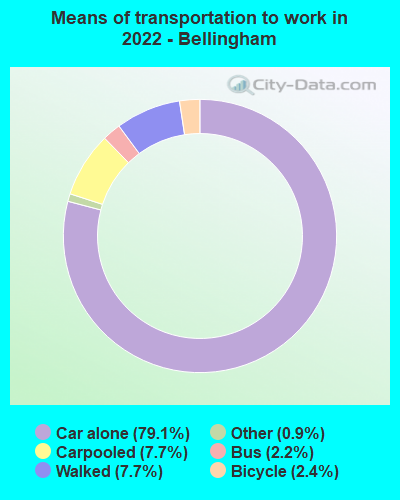
Means of transportation to work:
- Drove a car alone: 45,814 (70.3%)
- Carpooled: 4,481 (6.9%)
- Bus: 1,250 (1.9%)
- Taxi: 514 (0.8%)
- Bicycle: 1,415 (2.2%)
- Walked: 4,480 (6.9%)
- Worked at home: 7,212 (11.1%)
- Unemployment by race in 2022
- Unemployment rate for White non-Hispanic residents
- 5.2%Males
- 2.4%Females
- Unemployment rate for Black residents
- 1.5%Males
- Unemployment rate for American Indian and Alaska Native residents
- 23.7%Males
- 8.8%Females
- Unemployment rate for Asian residents
- 1.4%Males
- 0.5%Females
- Unemployment rate for other race residents
- 3.8%Males
- 2.7%Females
- Unemployment rate for two or more race residents
- 4.4%Males
- 4.9%Females
- Unemployment rate for Hispanic or Latino residents
- 3.8%Males
- 4.0%Females
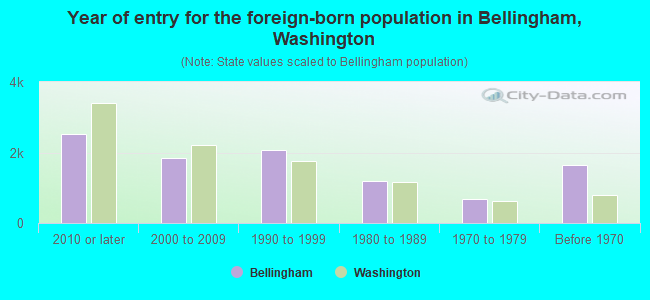
- Year of entry for the foreign-born population in Bellingham, Washington
- 2,5282010 or later
- 1,8452000 to 2009
- 2,0611990 to 1999
- 1,1891980 to 1989
- 6941970 to 1979
- 1,645Before 1970
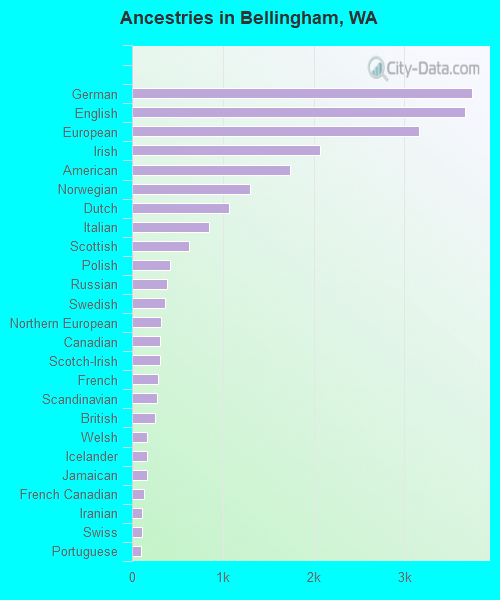
First ancestries reported:
- German: 3,744 (9.9%)
- English: 3,663 (9.7%)
- European: 3,160 (8.4%)
- Irish: 2,071 (5.5%)
- American: 1,745 (4.6%)
- Norwegian: 1,302 (3.5%)
- Dutch: 1,068 (2.8%)
- Italian: 852 (2.3%)
- Scottish: 626 (1.7%)
- Polish: 423 (1.1%)
- Russian: 387 (1.0%)
- Swedish: 360 (1.0%)
- Northern European: 318 (0.8%)
- Canadian: 312 (0.8%)
- Scotch-Irish: 307 (0.8%)
- French: 284 (0.8%)
- Scandinavian: 280 (0.7%)
- British: 257 (0.7%)
- Welsh: 162 (0.4%)
- Icelander: 161 (0.4%)
- Jamaican: 160 (0.4%)
- French Canadian: 133 (0.4%)
- Iranian: 107 (0.3%)
- Swiss: 106 (0.3%)
- Portuguese: 101 (0.3%)
- Serbian: 100 (0.3%)
- Lithuanian: 84 (0.2%)
- Celtic: 74 (0.2%)
- Ukrainian: 71 (0.2%)
- Eastern European: 71 (0.2%)
- Finnish: 71 (0.2%)
- Yugoslavian: 66 (0.2%)
- Danish: 66 (0.2%)
- Czech: 63 (0.2%)
- Bulgarian: 54 (0.1%)
- Austrian: 52 (0.1%)
- Romanian: 48 (0.1%)
- Egyptian: 45 (0.1%)
- Estonian: 41 (0.1%)
- Greek: 37 (0.10%)
- Ethiopian: 35 (0.09%)
- Turkish: 27 (0.07%)
- Arab: 23 (0.06%)
- Hungarian: 19 (0.05%)
- Slovene: 19 (0.05%)
- Australian: 18 (0.05%)
- Latvian: 16 (0.04%)
- Croatian: 14 (0.04%)
- Carpatho Rusyn: 11 (0.03%)
- Belgian: 10 (0.03%)
- Haitian: 10 (0.03%)
- African: 9 (0.02%)
- Somali: 5 (0.01%)
Most common places of birth for foreign-born residents (%):
| Bellingham: | 14.4% (1,278) |
| Washington: | 4.1% (47,238) |
| Bellingham: | 14.1% (1,250) |
| Washington: | 21.1% (241,655) |
| Bellingham: | 9.2% (813) |
| Washington: | 7.4% (84,470) |
| Bellingham: | 7.8% (686) |
| Washington: | 8.9% (101,353) |
| Bellingham: | 6.7% (594) |
| Washington: | 6.3% (71,661) |
| Bellingham: | 4.6% (408) |
| Washington: | 5.4% (62,003) |
| Bellingham: | 4.0% (353) |
| Washington: | 1.6% (17,761) |
| Bellingham: | 3.3% (289) |
| Washington: | 0.9% (9,937) |
| Bellingham: | 2.8% (247) |
| Washington: | 4.3% (48,886) |
| Bellingham: | 2.7% (241) |
| Washington: | 1.5% (17,453) |
| Bellingham: | 2.5% (219) |
| Washington: | 0.8% (9,457) |
| Bellingham: | 2.5% (218) |
| Washington: | 1.9% (21,540) |
| Bellingham: | 1.6% (138) |
| Washington: | 1.5% (16,607) |
| Bellingham: | 1.6% (138) |
| Washington: | 0.6% (6,500) |
Place of birth for U.S.-born residents:
- This state: 43,482
- Other state: 37,535
- Northeast: 5,066
- Midwest: 8,218
- South: 6,053
- West: 18,198
78.5% of Bellingham residents lived in the same house 1 years ago.
Out of people who lived in different houses, 30.9% lived in this county.
Out of people who lived in different counties, 71.8% lived in Washington.
| Bellingham: | 78.5% |
| State average: | 85.2% |
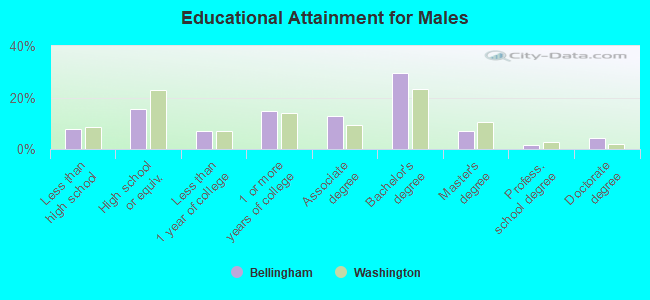
Education attainment for males 25 years and older:
- No schooling: 265
- Nursery to 4th grade: 148
- 5th and 6th grade: 312
- 7th and 8th grade: 117
- 9th grade: 256
- 10th grade: 453
- 11th grade: 464
- 12th grade, no diploma: 305
- High school graduate (or equivalency): 4,753
- Less than 1 year of college: 2,145
- Some college more than 1 year, no degree: 4,476
- Associate degree: 3,934
- Bachelor's degree: 8,984
- Master's degree: 2,089
- Professional school degree: 446
- Doctorate degree: 1,279
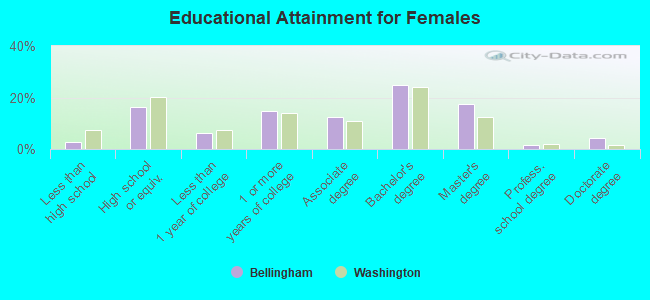
Education attainment for females 25 years and older:
- No schooling: 0
- Nursery to 4th grade: 42
- 5th and 6th grade: 308
- 7th and 8th grade: 0
- 9th grade: 53
- 10th grade: 51
- 11th grade: 38
- 12th grade, no diploma: 342
- High school graduate (or equivalency): 5,046
- Less than 1 year of college: 1,882
- Some college more than 1 year, no degree: 4,633
- Associate degree: 3,800
- Bachelor's degree: 7,686
- Master's degree: 5,386
- Professional school degree: 456
- Doctorate degree: 1,278
Housing units in structures:
- One, detached: 17,299
- One, attached: 1,779
- Two: 2,287
- 3 or 4: 2,714
- 5 to 9: 3,343
- 10 to 19: 5,585
- 20 to 49: 5,470
- 50 or more: 4,326
- Mobile homes: 1,115
- Boats, RVs, vans, etc.: 55
Median worth of mobile homes: $119,344
Housing units lacking complete kitchen facilities in 2022: 2.7%
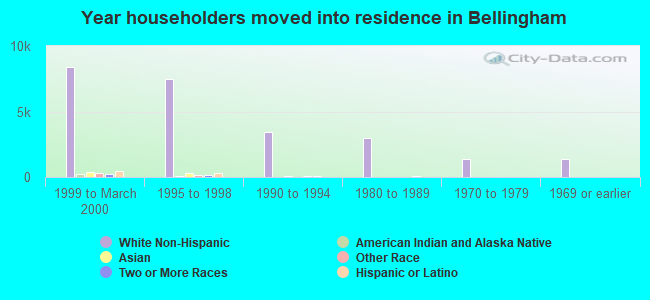
House/condo owner moved in on average 10 years ago
Renter moved in on average 2 years ago
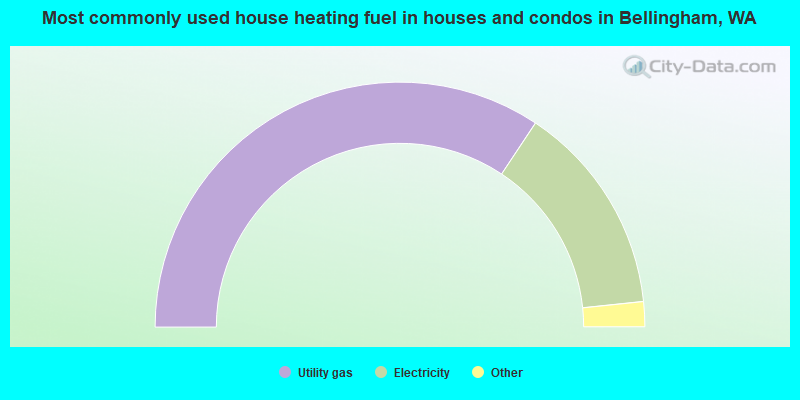
- 68.6%Utility gas
- 28.0%Electricity
- 1.3%Wood
- 1.0%Bottled, tank, or LP gas
- 0.6%Solar energy
- 0.2%Fuel oil, kerosene, etc.
- 0.1%Other fuel
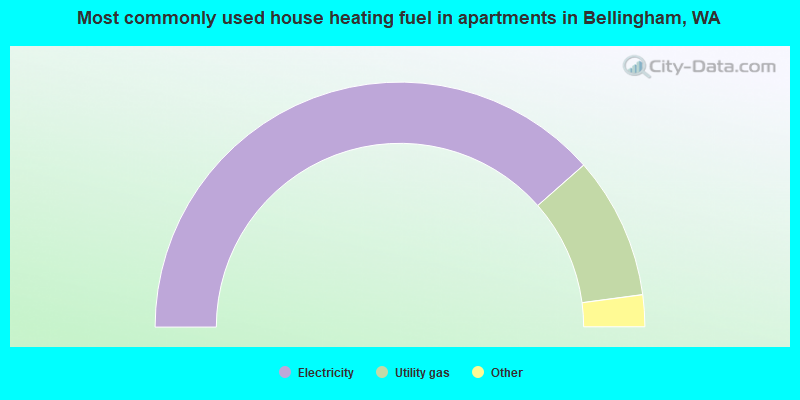
- 77.1%Electricity
- 18.8%Utility gas
- 1.5%No fuel used
- 1.3%Bottled, tank, or LP gas
- 0.9%Other fuel
- 0.3%Wood
- 0.2%Fuel oil, kerosene, etc.
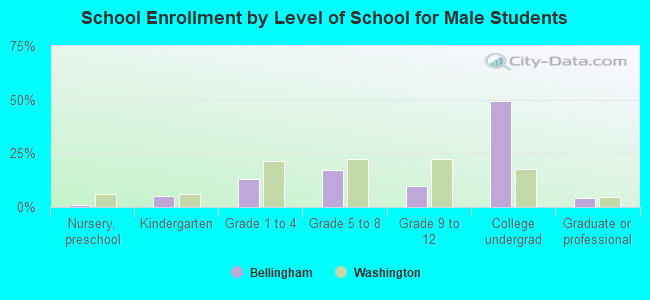
Private vs. public school enrollment:
| Here: | 33.9% |
| Washington: | 12.4% |
| Here: | 21.1% |
| Washington: | 9.2% |
| Here: | 6.3% |
| Washington: | 16.5% |