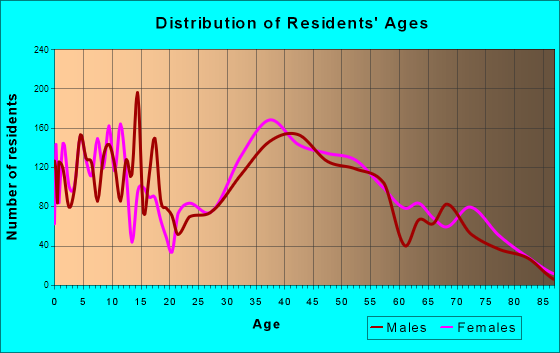
Bellmore, NY (New York) Houses and Residents
Estimated median house or condo value in 2022: $645,305 (it was $242,600 in 2000 )
Bellmore:
$645,305New York:
$400,400
Lower value quartile - upper value quartile: $540,840 - $764,623Total population: 16,218 (All urban)
Houses: 5,445 (5,257 occupied: 4,733 owner occupied, 515 renter occupied )
% of renters here:
10%State:
46%
Housing density: 2,199 houses/condos per square mile
Median price asked for vacant for-sale houses and condos in 2022: $273,508.
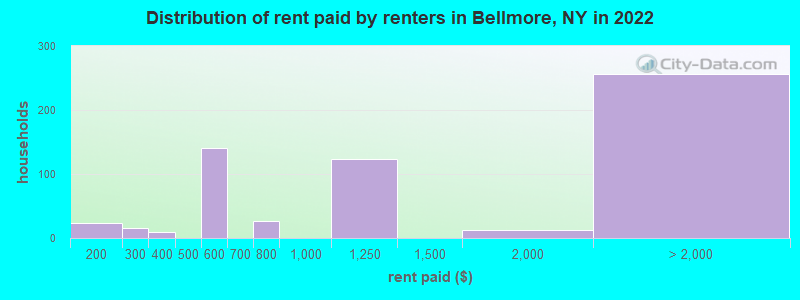
Median contract rent in 2022: $1,602 (lower quartile is $650, upper quartile is over $2,000)
Median rent asked for vacant for-rent units in 2022: $6,493
Median gross rent in Bellmore, NY in 2022: $1,592
Housing units in Bellmore with a mortgage: 3,128 (492 second mortgage, 2 home equity loan, 455 both second mortgage and home equity loan )Houses without a mortgage: 14
Median household income for houses/condos with a mortgage: $196,076
Median household income for apartments without a mortgage: $113,782
Median monthly housing costs: $2,791
Data:
Median house or condo value ($)
Median house or condo value ($ change since 2000)
Median house or condo value ($) - White
Median house or condo value ($) - Black or African American
Median house or condo value ($) - Asian
Median house or condo value ($) - Hispanic or Latino
Median house or condo value ($) - American Indian and Alaska Native
Median house or condo value ($) - Multirace
Median house or condo value ($) - Other Race
Median price asked for mobile homes ($)
Household density (households per square mile)
Mean house or condo value by units in structure - 1, detached ($)
Mean house or condo value by units in structure - 1, attached ($)
Mean house or condo value by units in structure - 2 ($)
Mean house or condo value by units in structure by units in structure - 3 or 4 ($)
Mean house or condo value by units in structure - 5 or more ($)
Mean house or condo value by units in structure - Boat, RV, van, etc. ($)
Mean house or condo value by units in structure - Mobile home ($)
Median contract rent ($)
Median contract rent - Lower quartile ($)
Median contract rent - Upper quartile ($)
Median gross rent ($)
Urban houses (%)
Rural houses (%)
Houses occupied (%)
Houses occupied (% change since 2000)
Houses owner occupied (%)
Houses owner occupied (% change since 2000)
Houses renter occupied (%)
Houses renter occupied (% change since 2000)
Vacant housing units - For rent (%)
Vacant housing units - For rent (% change since 2000)
Vacant housing units - For sale only (%)
Vacant housing units - For sale only (% change since 2000)
Vacant housing units - Rented or sold, not occupied (%)
Vacant housing units - Rented or sold, not occupied (% change since 2000)
Vacant housing units - For seasonal, recreational, or occasional use (%)
Vacant housing units - For seasonal, recreational, or occasional use (% change since 2000)
Vacant housing units - For migrant workers (%)
Vacant housing units - For migrant workers (% change since 2000)
Vacant housing units - Other vacant (%)
Vacant housing units - Other vacant (% change since 2000)
Median monthly housing costs ($)
Median household income for houses/condos with a mortgage ($)
Median household income for houses/condos without a mortgage ($)
Median household income ($)
Median household income ($) - White
Median household income ($) - Black or African American
Median household income ($) - Asian
Median household income ($) - Hispanic or Latino
Median household income ($) - American Indian and Alaska Native
Median household income ($) - Multirace
Median household income ($) - Other Race
Mortgage status - with mortgage (%)
Mortgage status - with second mortgage (%)
Mortgage status - with home equity loan (%)
Mortgage status - with both second mortgage and home equity loan (%)
Mortgage status - without a mortgage (%)
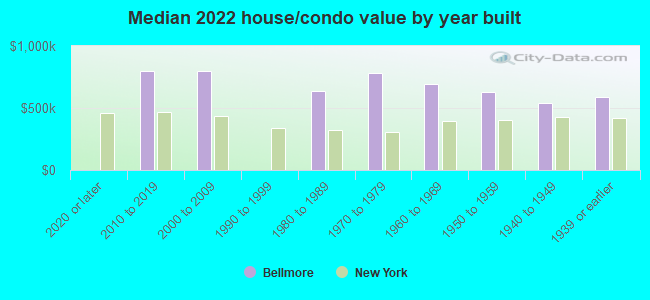
Median year house/condo built
Median year apartment built
Household type by relationship - Male householder living alone (%)
Household type by relationship - Male householder not living alone (%)
Household type by relationship - Female householder living alone (%)
Household type by relationship - Female householder not living alone (%)
Household type by relationship - Opposite-Sex spouse (%)
Household type by relationship - Same-Sex spouse (%)
Household type by relationship - Opposite-Sex unmarried partner (%)
Household type by relationship - Same-Sex unmarried partner (%)
Household type by relationship - In group quarters (%)
Size of family households - 2-person household (%)
Size of family households - 3-person household (%)
Size of family households - 4-person household (%)
Size of family households - 5-person household (%)
Size of family households - 6-person household (%)
Size of family households - 7-or-more-person household (%)
Size of nonfamily households - 1-person household (%)
Size of nonfamily households - 2-person household (%)
Size of nonfamily households - 3-person household (%)
Size of nonfamily households - 4-person household (%)
Size of nonfamily households - 5-person household (%)
Size of nonfamily households - 6-person household (%)
Size of nonfamily households - 7-or-moreperson household (%)
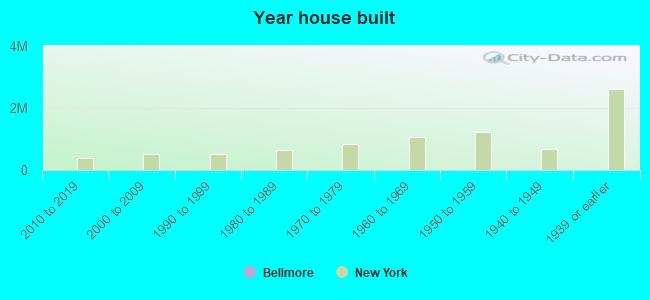
Year house built - Built 2010 or later (%)
Year house built - Built 2000 to 2009 (%)
Year house built - Built 1990 to 1999 (%)
Year house built - Built 1980 to 1989 (%)
Year house built - Built 1970 to 1979 (%)
Year house built - Built 1960 to 1969 (%)
Year house built - Built 1950 to 1959 (%)
Year house built - Built 1940 to 1949 (%)
Year house built - Built 1939 or earlier (%)
Median number of rooms in houses and condos
Median number of rooms in apartments
Median number of bedrooms in owner occupied houses
Mean number of bedrooms in owner occupied houses
Median number of bedrooms in renter occupied houses
Mean number of bedrooms in renter occupied houses
Median number of vehichles in owner occupied houses
Mean number of vehichles in owner occupied houses
Median number of vehichles in renter occupied houses
Mean number of vehichles in renter occupied houses
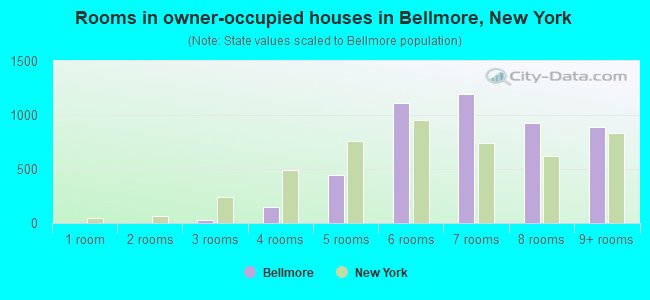
Rooms in owner-occupied houses - 1 room (%)
Rooms in owner-occupied houses - 2 rooms (%)
Rooms in owner-occupied houses - 3 rooms (%)
Rooms in owner-occupied houses - 4 rooms (%)
Rooms in owner-occupied houses - 5 rooms (%)
Rooms in owner-occupied houses - 6 rooms (%)
Rooms in owner-occupied houses - 7 rooms (%)
Rooms in owner-occupied houses - 8 rooms (%)
Rooms in owner-occupied houses - 9+ rooms (%)
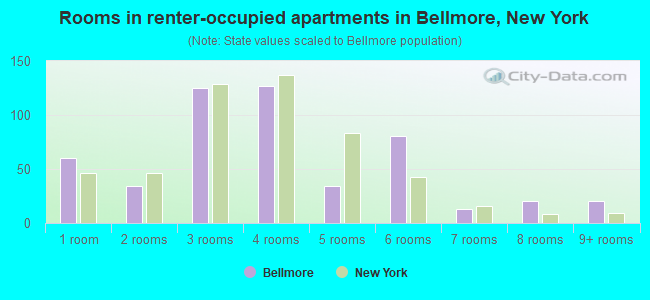
Rooms in renter-occupied houses - 1 room (%)
Rooms in renter-occupied houses - 2 rooms (%)
Rooms in renter-occupied houses - 3 rooms (%)
Rooms in renter-occupied houses - 4 rooms (%)
Rooms in renter-occupied houses - 5 rooms (%)
Rooms in renter-occupied houses - 6 rooms (%)
Rooms in renter-occupied houses - 7 rooms (%)
Rooms in renter-occupied houses - 8 rooms (%)
Rooms in renter-occupied houses - 9+ rooms (%)
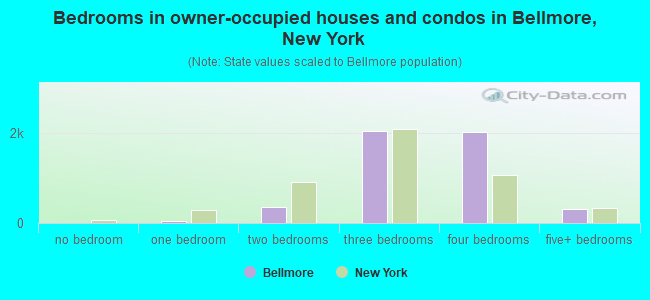
Bedrooms in owner-occupied houses - no bedrooms (%)
Bedrooms in owner-occupied houses - 1 bedroom (%)
Bedrooms in owner-occupied houses - 2 bedrooms (%)
Bedrooms in owner-occupied houses - 3 bedrooms (%)
Bedrooms in owner-occupied houses - 4 bedrooms (%)
Bedrooms in owner-occupied houses - 5+ bedrooms (%)
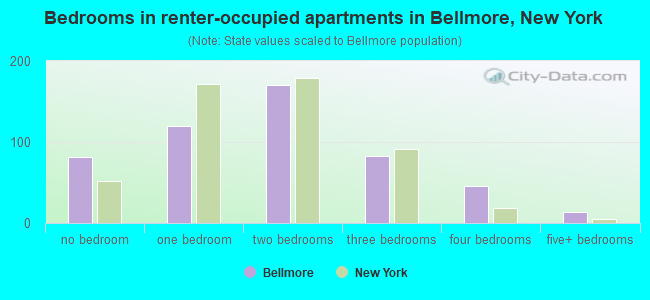
Bedrooms in renter-occupied houses - no bedrooms (%)
Bedrooms in renter-occupied houses - 1 bedroom (%)
Bedrooms in renter-occupied houses - 2 bedrooms (%)
Bedrooms in renter-occupied houses - 3 bedrooms (%)
Bedrooms in renter-occupied houses - 4 bedrooms (%)
Bedrooms in renter-occupied houses - 5+ bedrooms (%)
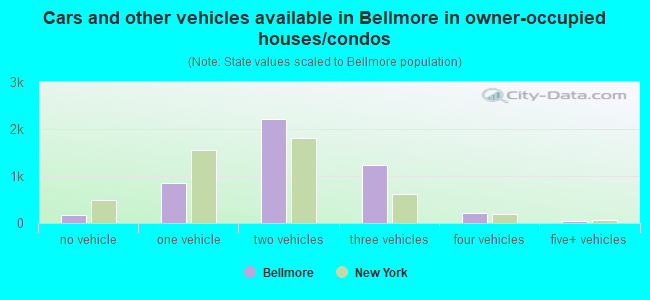
Vehicles available in owner-occupied houses - no vehicle available (%)
Vehicles available in owner-occupied houses - 1 vehicle available(%)
Vehicles available in owner-occupied houses - 2 Vehicles available (%)
Vehicles available in owner-occupied houses - 3 Vehicles available (%)
Vehicles available in owner-occupied houses - 4 Vehicles available (%)
Vehicles available in owner-occupied houses - 5+ Vehicles available (%)
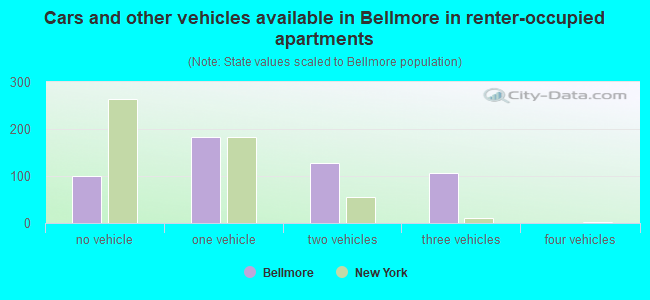
Vehicles available in renter-occupied houses - no vehicle available (%)
Vehicles available in renter-occupied houses - 1 vehicle available (%)
Vehicles available in renter-occupied houses - 2 Vehicles available (%)
Vehicles available in renter-occupied houses - 3 Vehicles available (%)
Vehicles available in renter-occupied houses - 4 Vehicles available (%)
Vehicles available in renter-occupied houses - 5+ Vehicles available (%)
Housing units in structures - 1, detached (%)
Housing units in structures - 1, attached (%)
Housing units in structures - 2 (%)
Housing units in structures - 3 or 4 (%)
Housing units in structures - 5 to 9 (%)
Housing units in structures - 10 to 19 (%)
Housing units in structures - 20 to 49 (%)
Housing units in structures - 50 or more (%)
Housing units in structures - Mobile home (%)
Housing units in structures - Boat, RV, van, etc. (%)
Housing units in structures - Owners - 1, detached (%)
Housing units in structures - Owners - 1, attached (%)
Housing units in structures - Owners - 2 (%)
Housing units in structures - Owners - 3 or 4 (%)
Housing units in structures - Owners - 5 to 9 (%)
Housing units in structures - Owners - 10 to 19 (%)
Housing units in structures - Owners - 20 to 49 (%)
Housing units in structures - Owners - 50 or more (%)
Housing units in structures - Owners - Mobile home (%)
Housing units in structures - Owners - Boat, RV, van, etc. (%)
Housing units in structures - Renters - 1, detached (%)
Housing units in structures - Renters - 1, attached (%)
Housing units in structures - Renters - 2 (%)
Housing units in structures - Renters - 3 or 4 (%)
Housing units in structures - Renters - 5 to 9 (%)
Housing units in structures - Renters - 10 to 19 (%)
Housing units in structures - Renters - 20 to 49 (%)
Housing units in structures - Renters - 50 or more (%)
Housing units in structures - Renters - Mobile home (%)
Housing units in structures - Renters - Boat, RV, van, etc. (%)
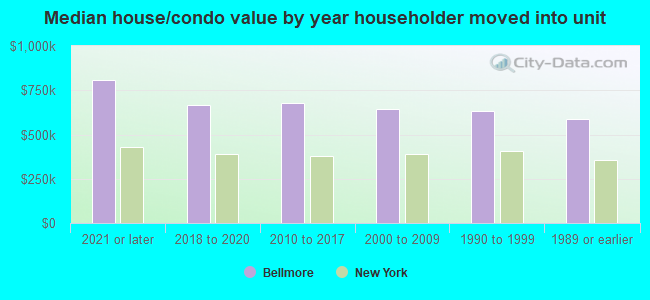
House/condo owner moved in on average (years ago)
Renter moved in on average (years ago)
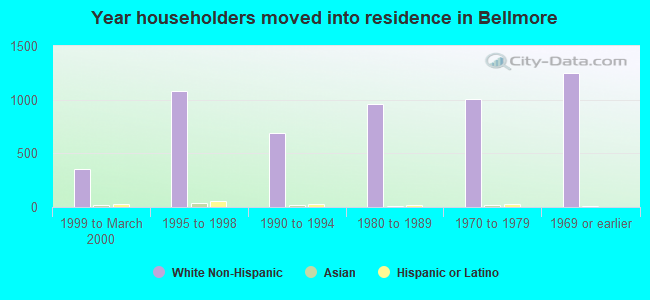
Year householder moved into unit - Moved in 1999 to March 2000 (%)
Year householder moved into unit - Moved in 1999 to March 2000 (%) - White
Year householder moved into unit - Moved in 1999 to March 2000 (%) - Black or African American
Year householder moved into unit - Moved in 1999 to March 2000 (%) - Asian
Year householder moved into unit - Moved in 1999 to March 2000 (%) - Hispanic or Latino
Year householder moved into unit - Moved in 1999 to March 2000 (%) - American Indian and Alaska Native
Year householder moved into unit - Moved in 1999 to March 2000 (%) - Multirace
Year householder moved into unit - Moved in 1999 to March 2000 (%) - Other Race
Year householder moved into unit - Moved in 1995 to 1998 (%)
Year householder moved into unit - Moved in 1995 to 1998 (%) - White
Year householder moved into unit - Moved in 1995 to 1998 (%) - Black or African American
Year householder moved into unit - Moved in 1995 to 1998 (%) - Asian
Year householder moved into unit - Moved in 1995 to 1998 (%) - Hispanic or Latino
Year householder moved into unit - Moved in 1995 to 1998 (%) - American Indian and Alaska Native
Year householder moved into unit - Moved in 1995 to 1998 (%) - Multirace
Year householder moved into unit - Moved in 1995 to 1998 (%) - Other Race
Year householder moved into unit - Moved in 1990 to 1994 (%)
Year householder moved into unit - Moved in 1990 to 1994 (%) - White
Year householder moved into unit - Moved in 1990 to 1994 (%) - Black or African American
Year householder moved into unit - Moved in 1990 to 1994 (%) - Asian
Year householder moved into unit - Moved in 1990 to 1994 (%) - Hispanic or Latino
Year householder moved into unit - Moved in 1990 to 1994 (%) - American Indian and Alaska Native
Year householder moved into unit - Moved in 1990 to 1994 (%) - Multirace
Year householder moved into unit - Moved in 1990 to 1994 (%) - Other Race
Year householder moved into unit - Moved in 1980 to 1989 (%)
Year householder moved into unit - Moved in 1980 to 1989 (%) - White
Year householder moved into unit - Moved in 1980 to 1989 (%) - Black or African American
Year householder moved into unit - Moved in 1980 to 1989 (%) - Asian
Year householder moved into unit - Moved in 1980 to 1989 (%) - Hispanic or Latino
Year householder moved into unit - Moved in 1980 to 1989 (%) - American Indian and Alaska Native
Year householder moved into unit - Moved in 1980 to 1989 (%) - Multirace
Year householder moved into unit - Moved in 1980 to 1989 (%) - Other Race
Year householder moved into unit - Moved in 1970 to 1979 (%)
Year householder moved into unit - Moved in 1970 to 1979 (%) - White
Year householder moved into unit - Moved in 1970 to 1979 (%) - Black or African American
Year householder moved into unit - Moved in 1970 to 1979 (%) - Asian
Year householder moved into unit - Moved in 1970 to 1979 (%) - Hispanic or Latino
Year householder moved into unit - Moved in 1970 to 1979 (%) - American Indian and Alaska Native
Year householder moved into unit - Moved in 1970 to 1979 (%) - Multirace
Year householder moved into unit - Moved in 1970 to 1979 (%) - Other Race
Year householder moved into unit - Moved in 1969 or earlier (%)
Year householder moved into unit - Moved in 1969 or earlier (%) - White
Year householder moved into unit - Moved in 1969 or earlier (%) - Black or African American
Year householder moved into unit - Moved in 1969 or earlier (%) - Asian
Year householder moved into unit - Moved in 1969 or earlier (%) - Hispanic or Latino
Year householder moved into unit - Moved in 1969 or earlier (%) - American Indian and Alaska Native
Year householder moved into unit - Moved in 1969 or earlier (%) - Multirace
Year householder moved into unit - Moved in 1969 or earlier (%) - Other Race
Housing units lacking complete plumbing facilities (%)
Housing units lacking complete kitchen facilities (%)
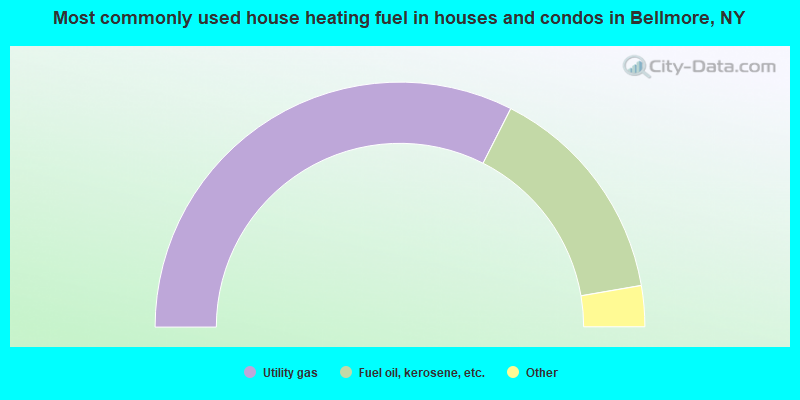
House heating fuel used in houses and condos - Utility gas (%)
House heating fuel used in houses and condos - Bottled, tank, or LP gas (%)
House heating fuel used in houses and condos - Electricity (%)
House heating fuel used in houses and condos - Fuel oil, kerosene, etc. (%)
House heating fuel used in houses and condos - Coal or coke (%)
House heating fuel used in houses and condos - Wood (%)
House heating fuel used in houses and condos - Solar energy (%)
House heating fuel used in houses and condos - Other fuel (%)
House heating fuel used in houses and condos - No fuel used (%)
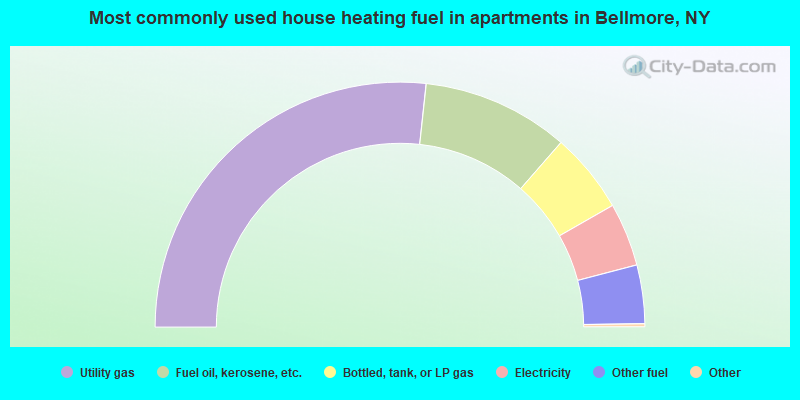
House heating fuel used in apartments - Utility gas (%)
House heating fuel used in apartments - Bottled, tank, or LP gas (%)
House heating fuel used in apartments - Electricity (%)
House heating fuel used in apartments - Fuel oil, kerosene, etc. (%)
House heating fuel used in apartments - Coal or coke (%)
House heating fuel used in apartments - Wood (%)
House heating fuel used in apartments - Solar energy (%)
House heating fuel used in apartments - Other fuel (%)
House heating fuel used in apartments - No fuel used (%)
Latest news about housing in Bellmore, NY collected exclusively by city-data.com from local newspapers, TV, and radio stations
Median year house/condo built: 1957Median year apartment built: 1956Household type by relationship:
Households: 15,874
Male householders: 2,546 (361 living alone ), Female householders: 2,665 (519 living alone )3,460 spouses (3,433 opposite-sex spouses ), 230 unmarried partners , (223 opposite-sex unmarried partners ), 5,681 children (5,556 natural , 54 adopted , 70 stepchildren ), 152 grandchildren , 131 brothers or sisters , 303 parents , 0 foster children , 395 other relatives , 250 non-relatives In group quarters: 56
Size of family households: 1,168 2-persons , 1,205 3-persons , 1,040 4-persons , 513 5-persons , 119 6-persons , 78 7-or-more-persons .
Size of nonfamily households: 919 1-person , 157 2-persons , 17 3-persons , 8 4-persons .
3,019 married couples with children. single-parent households (71 men , 214 women ).
84.0% of residents of Bellmore speak English at home. of residents speak Spanish at home (69% speak English very well , 23% speak English well , 9% speak English not well ).of residents speak other Indo-European language at home (80% speak English very well , 10% speak English well , 8% speak English not well , 2% don't speak English at all ).of residents speak Asian or Pacific Island language at home (52% speak English very well , 28% speak English well , 18% speak English not well , 2% don't speak English at all ).of residents speak other language at home (79% speak English very well , 21% speak English well ).
Foreign born population: 1,793 (11.3%)of them are naturalized citizens )
Median number of rooms in houses and condos:
Median number of rooms in apartments
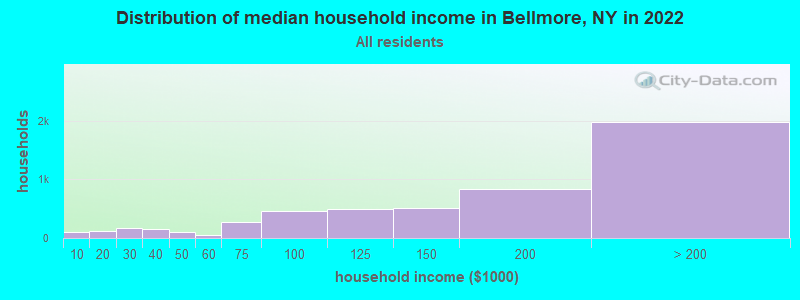
Bellmore, NY household income distribution 95 Less than $10,000116 $10,000 to $19,999167 $20,000 to $29,999160 $30,000 to $39,99999 $40,000 to $49,99952 $50,000 to $59,999270 $60,000 to $74,999457 $75,000 to $99,999500 $100,000 to $124,999516 $125,000 to $149,999840 $150,000 to $199,9991,978 $200,000 or more
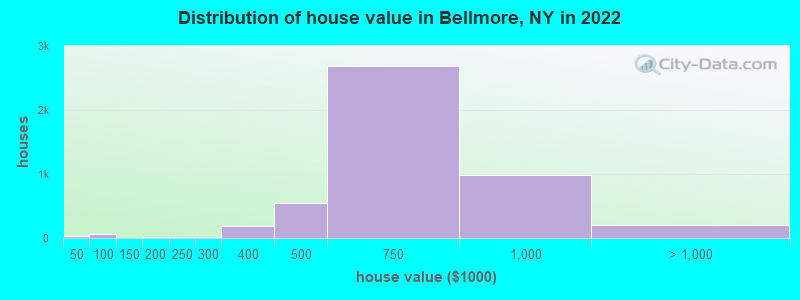
Home value of owner - occupied houses in 2022 in Bellmore, NY 11 Less than $10,00017 $35,000 to $39,99946 $50,000 to $59,99915 $60,000 to $69,9998 $150,000 to $174,99910 $200,000 to $249,9999 $250,000 to $299,999191 $300,000 to $399,999550 $400,000 to $499,9992,684 $500,000 to $749,999982 $750,000 to $999,999156 $1,000,000 to $1,499,99939 $2,000,000 or moreRent paid by renters in 2022 in Bellmore, NY 23 $150 to $19915 $250 to $29910 $300 to $349140 $500 to $54926 $700 to $749122 $1,000 to $1,24912 $1,500 to $1,999115 $2,000 to $2,49982 $2,500 to $2,9999 $3,000 to $3,49948 No cash rent
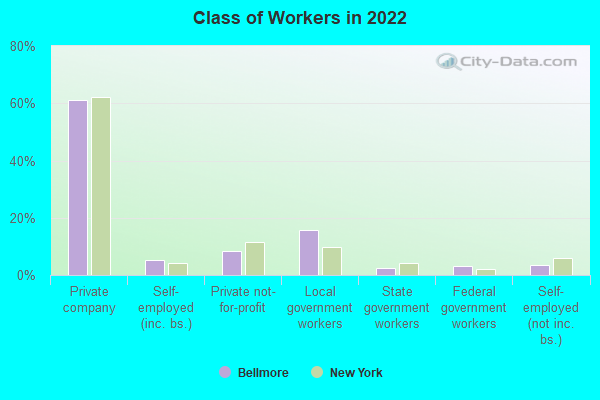
Percentage of workers working in this county: 58.6%Number of people working at home: 1,267 (14.5% of all workers )
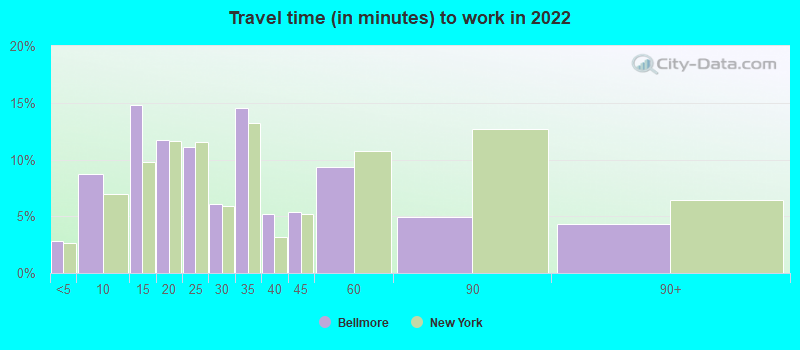
Travel time to work (commute)
Less than 5 minutes: 1515 to 9 minutes: 21210 to 14 minutes: 81615 to 19 minutes: 46920 to 24 minutes: 1,21025 to 29 minutes: 48130 to 34 minutes: 97035 to 39 minutes: 8340 to 44 minutes: 37045 to 59 minutes: 78960 to 89 minutes: 1,34390 or more minutes: 662
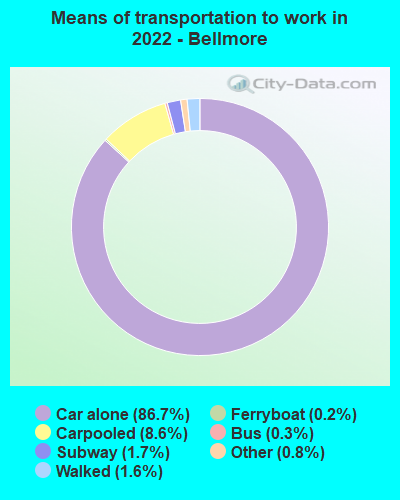
Means of transportation to work:
Drove a car alone: 3,594 (67.0%)Carpooled: 346 (6.5%)Bus : 14 (0.3%)Long-distance train or commuter rail : 61 (1.1%)Ferryboat: 8 (0.1%)Taxi: 47 (0.9%)Walked: 72 (1.3%)Worked at home: 1,267 (23.6%)
Unemployment by race in 2022
Unemployment rate for White non-Hispanic residents 2.8% Males2.1% FemalesUnemployment rate for Black residents 14.4% FemalesUnemployment rate for Asian residents 1.2% FemalesUnemployment rate for other race residents 38.2% MalesUnemployment rate for Hispanic or Latino residents 2.9% Males
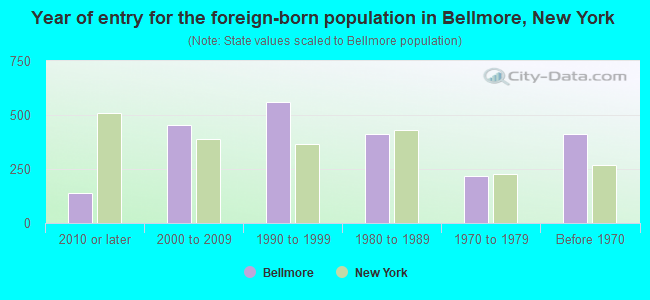
Year of entry for the foreign-born population in Bellmore, New York
137 2010 or later 456 2000 to 2009 561 1990 to 1999 413 1980 to 1989 218 1970 to 1979 414 Before 1970
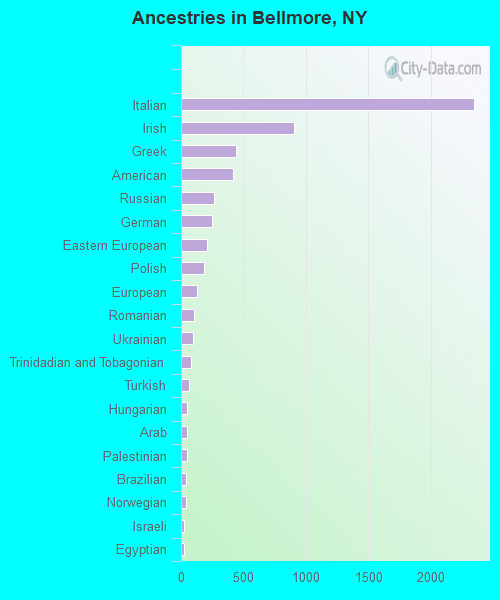
First ancestries reported:
Italian: 2,351 (32.6%)
Irish: 908 (12.6%)
Greek: 437 (6.1%)
American: 419 (5.8%)
Russian: 263 (3.6%)
German: 252 (3.5%)
Eastern European: 206 (2.9%)
Polish: 182 (2.5%)
European: 128 (1.8%)
Romanian: 106 (1.5%)
Ukrainian: 98 (1.4%)
Trinidadian and Tobagonian: 80 (1.1%)
Turkish: 63 (0.9%)
Hungarian: 52 (0.7%)
Arab: 49 (0.7%)
Palestinian: 47 (0.7%)
Brazilian: 43 (0.6%)
Norwegian: 42 (0.6%)
Israeli: 25 (0.3%)
Egyptian: 23 (0.3%)
Yugoslavian: 21 (0.3%)
English: 21 (0.3%)
Australian: 19 (0.3%)
Croatian: 18 (0.2%)
Scotch-Irish: 17 (0.2%)
French Canadian: 15 (0.2%)
Albanian: 10 (0.1%)
Bulgarian: 9 (0.1%)
Austrian: 9 (0.1%)
Lebanese: 8 (0.1%)
Haitian: 8 (0.1%)
Swiss: 6 (0.08%)
Latvian: 5 (0.07%) Most common places of birth for foreign-born residents (%): Greece Bellmore:
13.7% (237)New York:
0.6% (28,604)
Egypt Bellmore:
11.1% (193)New York:
0.6% (27,385)
Argentina Bellmore:
9.7% (169)New York:
0.5% (21,928)
China, excluding Hong Kong and Taiwan Bellmore:
7.6% (132)New York:
9.1% (410,910)
Italy Bellmore:
7.5% (130)New York:
1.8% (81,374)
Korea Bellmore:
6.1% (105)New York:
1.8% (82,786)
Ukraine Bellmore:
4.2% (73)New York:
1.7% (78,421)
Kuwait Bellmore:
3.9% (67)New York:
0.0% (1,860)
Mexico Bellmore:
3.6% (62)New York:
4.8% (214,559)
Brazil Bellmore:
3.5% (61)New York:
0.7% (30,658)
Trinidad and Tobago Bellmore:
3.3% (58)New York:
2.0% (91,428)
Israel Bellmore:
3.3% (57)New York:
0.7% (29,743)
Philippines Bellmore:
2.6% (45)New York:
2.0% (91,070)
Ireland Bellmore:
2.3% (40)New York:
0.6% (26,772)
Other South America Bellmore:
2.1% (36)New York:
0.2% (8,613)
Place of birth for U.S.-born residents:
This state: 12,955Other state: 800Northeast: 461Midwest: 63South: 181West: 76 93.5% of Bellmore residents lived in the same house 1 years ago.
Out of people who lived in different houses, 36.3% lived in this county.
Out of people who lived in different counties, 96.4% lived in New York.
Bellmore:
93.5%State average:
89.6%
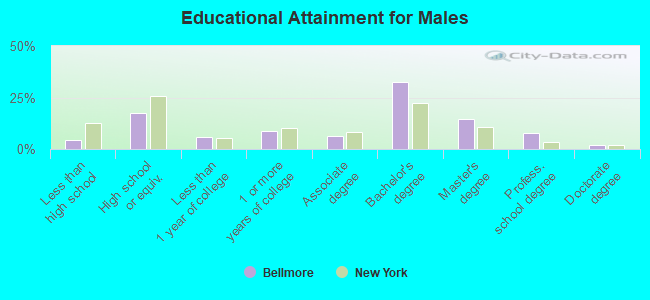
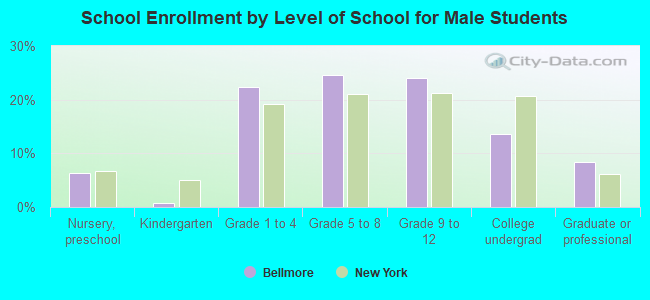
Education attainment for males 25 years and older:
No schooling: 107Nursery to 4th grade: 05th and 6th grade: 07th and 8th grade: 429th grade: 710th grade: 811th grade: 3512th grade, no diploma: 53High school graduate (or equivalency): 1,008Less than 1 year of college: 333Some college more than 1 year, no degree: 507Associate degree: 371Bachelor's degree: 1,856Master's degree: 837Professional school degree: 430Doctorate degree: 107
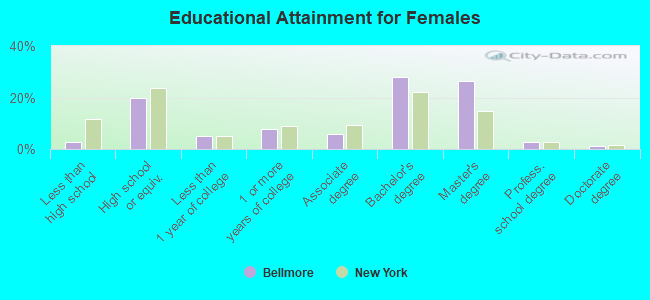
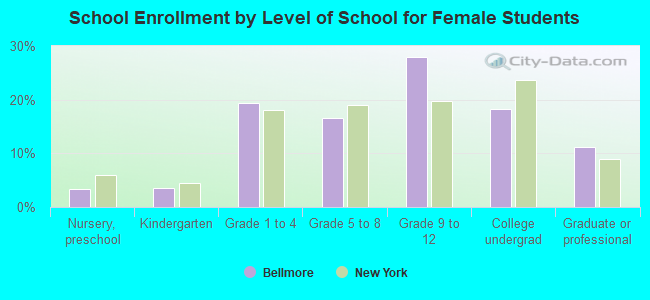
Education attainment for females 25 years and older:
No schooling: 46Nursery to 4th grade: 125th and 6th grade: 17th and 8th grade: 09th grade: 3510th grade: 311th grade: 012th grade, no diploma: 68High school graduate (or equivalency): 1,126Less than 1 year of college: 286Some college more than 1 year, no degree: 450Associate degree: 337Bachelor's degree: 1,598Master's degree: 1,503Professional school degree: 161Doctorate degree: 59
Housing units in structures:
One, detached: 5,025One, attached: 41Two: 923 or 4: 535 to 9: 2210 to 19: 8220 to 49: 114Mobile homes: 14Housing units lacking complete plumbing facilities in 2022: 0.6%Housing units lacking complete kitchen facilities in 2022: 0.6%House/condo owner moved in on average 15 years ago
Renter moved in on average 11 years ago
Private vs. public school enrollment:
Students in private schools in grades 1 to 8 (elementary and middle school): 7 Students in private schools in grades 9 to 12 (high school): 11 Students in private undergraduate colleges: 289