Belmont, NH (New Hampshire) Houses and Residents
Estimated median house or condo value in 2022: $280,267 (it was $86,400 in 2000 )
Belmont:
$280,267New Hampshire:
$384,700
Lower value quartile - upper value quartile: $227,689 - $421,226Total population: 7,356 (Urban population: 488 (all inside urban clusters), Rural population: 6,228 (14 farm, 6,214 nonfarm ))
Houses: 3,113 (2,641 occupied: 2,074 owner occupied, 567 renter occupied )
% of renters here:
21%State:
28%
Housing density: 102 houses/condos per square mile
Median price asked for vacant for-sale houses and condos in 2022 in this county: $93,849.
Median contract rent in 2022: $1,045 (lower quartile is $856, upper quartile is $1,321)
Median rent asked for vacant for-rent units in 2022: $960
Median gross rent in Belmont, NH in 2022: $1,303
Housing units in Belmont with a mortgage: 922 (61 second mortgage, 84 home equity loan, 0 both second mortgage and home equity loan )Houses without a mortgage: 227
Data:
Median house or condo value ($)
Median house or condo value ($ change since 2000)
Median house or condo value ($) - White
Median house or condo value ($) - Black or African American
Median house or condo value ($) - Asian
Median house or condo value ($) - Hispanic or Latino
Median house or condo value ($) - American Indian and Alaska Native
Median house or condo value ($) - Multirace
Median house or condo value ($) - Other Race
Median price asked for mobile homes ($)
Household density (households per square mile)
Mean house or condo value by units in structure - 1, detached ($)
Mean house or condo value by units in structure - 1, attached ($)
Mean house or condo value by units in structure - 2 ($)
Mean house or condo value by units in structure by units in structure - 3 or 4 ($)
Mean house or condo value by units in structure - 5 or more ($)
Mean house or condo value by units in structure - Boat, RV, van, etc. ($)
Mean house or condo value by units in structure - Mobile home ($)
Median contract rent ($)
Median contract rent - Lower quartile ($)
Median contract rent - Upper quartile ($)
Median gross rent ($)
Urban houses (%)
Rural houses (%)
Houses occupied (%)
Houses occupied (% change since 2000)
Houses owner occupied (%)
Houses owner occupied (% change since 2000)
Houses renter occupied (%)
Houses renter occupied (% change since 2000)
Vacant housing units - For rent (%)
Vacant housing units - For rent (% change since 2000)
Vacant housing units - For sale only (%)
Vacant housing units - For sale only (% change since 2000)
Vacant housing units - Rented or sold, not occupied (%)
Vacant housing units - Rented or sold, not occupied (% change since 2000)
Vacant housing units - For seasonal, recreational, or occasional use (%)
Vacant housing units - For seasonal, recreational, or occasional use (% change since 2000)
Vacant housing units - For migrant workers (%)
Vacant housing units - For migrant workers (% change since 2000)
Vacant housing units - Other vacant (%)
Vacant housing units - Other vacant (% change since 2000)
Median monthly housing costs ($)
Median household income for houses/condos with a mortgage ($)
Median household income for houses/condos without a mortgage ($)
Median household income ($)
Median household income ($) - White
Median household income ($) - Black or African American
Median household income ($) - Asian
Median household income ($) - Hispanic or Latino
Median household income ($) - American Indian and Alaska Native
Median household income ($) - Multirace
Median household income ($) - Other Race
Mortgage status - with mortgage (%)
Mortgage status - with second mortgage (%)
Mortgage status - with home equity loan (%)
Mortgage status - with both second mortgage and home equity loan (%)
Mortgage status - without a mortgage (%)
Median year house/condo built
Median year apartment built
Household type by relationship - Male householder living alone (%)
Household type by relationship - Male householder not living alone (%)
Household type by relationship - Female householder living alone (%)
Household type by relationship - Female householder not living alone (%)
Household type by relationship - Opposite-Sex spouse (%)
Household type by relationship - Same-Sex spouse (%)
Household type by relationship - Opposite-Sex unmarried partner (%)
Household type by relationship - Same-Sex unmarried partner (%)
Household type by relationship - In group quarters (%)
Size of family households - 2-person household (%)
Size of family households - 3-person household (%)
Size of family households - 4-person household (%)
Size of family households - 5-person household (%)
Size of family households - 6-person household (%)
Size of family households - 7-or-more-person household (%)
Size of nonfamily households - 1-person household (%)
Size of nonfamily households - 2-person household (%)
Size of nonfamily households - 3-person household (%)
Size of nonfamily households - 4-person household (%)
Size of nonfamily households - 5-person household (%)
Size of nonfamily households - 6-person household (%)
Size of nonfamily households - 7-or-moreperson household (%)
Year house built - Built 2010 or later (%)
Year house built - Built 2000 to 2009 (%)
Year house built - Built 1990 to 1999 (%)
Year house built - Built 1980 to 1989 (%)
Year house built - Built 1970 to 1979 (%)
Year house built - Built 1960 to 1969 (%)
Year house built - Built 1950 to 1959 (%)
Year house built - Built 1940 to 1949 (%)
Year house built - Built 1939 or earlier (%)
Median number of rooms in houses and condos
Median number of rooms in apartments
Median number of bedrooms in owner occupied houses
Mean number of bedrooms in owner occupied houses
Median number of bedrooms in renter occupied houses
Mean number of bedrooms in renter occupied houses
Median number of vehichles in owner occupied houses
Mean number of vehichles in owner occupied houses
Median number of vehichles in renter occupied houses
Mean number of vehichles in renter occupied houses
Rooms in owner-occupied houses - 1 room (%)
Rooms in owner-occupied houses - 2 rooms (%)
Rooms in owner-occupied houses - 3 rooms (%)
Rooms in owner-occupied houses - 4 rooms (%)
Rooms in owner-occupied houses - 5 rooms (%)
Rooms in owner-occupied houses - 6 rooms (%)
Rooms in owner-occupied houses - 7 rooms (%)
Rooms in owner-occupied houses - 8 rooms (%)
Rooms in owner-occupied houses - 9+ rooms (%)
Rooms in renter-occupied houses - 1 room (%)
Rooms in renter-occupied houses - 2 rooms (%)
Rooms in renter-occupied houses - 3 rooms (%)
Rooms in renter-occupied houses - 4 rooms (%)
Rooms in renter-occupied houses - 5 rooms (%)
Rooms in renter-occupied houses - 6 rooms (%)
Rooms in renter-occupied houses - 7 rooms (%)
Rooms in renter-occupied houses - 8 rooms (%)
Rooms in renter-occupied houses - 9+ rooms (%)
Bedrooms in owner-occupied houses - no bedrooms (%)
Bedrooms in owner-occupied houses - 1 bedroom (%)
Bedrooms in owner-occupied houses - 2 bedrooms (%)
Bedrooms in owner-occupied houses - 3 bedrooms (%)
Bedrooms in owner-occupied houses - 4 bedrooms (%)
Bedrooms in owner-occupied houses - 5+ bedrooms (%)
Bedrooms in renter-occupied houses - no bedrooms (%)
Bedrooms in renter-occupied houses - 1 bedroom (%)
Bedrooms in renter-occupied houses - 2 bedrooms (%)
Bedrooms in renter-occupied houses - 3 bedrooms (%)
Bedrooms in renter-occupied houses - 4 bedrooms (%)
Bedrooms in renter-occupied houses - 5+ bedrooms (%)
Vehicles available in owner-occupied houses - no vehicle available (%)
Vehicles available in owner-occupied houses - 1 vehicle available(%)
Vehicles available in owner-occupied houses - 2 Vehicles available (%)
Vehicles available in owner-occupied houses - 3 Vehicles available (%)
Vehicles available in owner-occupied houses - 4 Vehicles available (%)
Vehicles available in owner-occupied houses - 5+ Vehicles available (%)
Vehicles available in renter-occupied houses - no vehicle available (%)
Vehicles available in renter-occupied houses - 1 vehicle available (%)
Vehicles available in renter-occupied houses - 2 Vehicles available (%)
Vehicles available in renter-occupied houses - 3 Vehicles available (%)
Vehicles available in renter-occupied houses - 4 Vehicles available (%)
Vehicles available in renter-occupied houses - 5+ Vehicles available (%)
Housing units in structures - 1, detached (%)
Housing units in structures - 1, attached (%)
Housing units in structures - 2 (%)
Housing units in structures - 3 or 4 (%)
Housing units in structures - 5 to 9 (%)
Housing units in structures - 10 to 19 (%)
Housing units in structures - 20 to 49 (%)
Housing units in structures - 50 or more (%)
Housing units in structures - Mobile home (%)
Housing units in structures - Boat, RV, van, etc. (%)
Housing units in structures - Owners - 1, detached (%)
Housing units in structures - Owners - 1, attached (%)
Housing units in structures - Owners - 2 (%)
Housing units in structures - Owners - 3 or 4 (%)
Housing units in structures - Owners - 5 to 9 (%)
Housing units in structures - Owners - 10 to 19 (%)
Housing units in structures - Owners - 20 to 49 (%)
Housing units in structures - Owners - 50 or more (%)
Housing units in structures - Owners - Mobile home (%)
Housing units in structures - Owners - Boat, RV, van, etc. (%)
Housing units in structures - Renters - 1, detached (%)
Housing units in structures - Renters - 1, attached (%)
Housing units in structures - Renters - 2 (%)
Housing units in structures - Renters - 3 or 4 (%)
Housing units in structures - Renters - 5 to 9 (%)
Housing units in structures - Renters - 10 to 19 (%)
Housing units in structures - Renters - 20 to 49 (%)
Housing units in structures - Renters - 50 or more (%)
Housing units in structures - Renters - Mobile home (%)
Housing units in structures - Renters - Boat, RV, van, etc. (%)
House/condo owner moved in on average (years ago)
Renter moved in on average (years ago)
Year householder moved into unit - Moved in 1999 to March 2000 (%)
Year householder moved into unit - Moved in 1999 to March 2000 (%) - White
Year householder moved into unit - Moved in 1999 to March 2000 (%) - Black or African American
Year householder moved into unit - Moved in 1999 to March 2000 (%) - Asian
Year householder moved into unit - Moved in 1999 to March 2000 (%) - Hispanic or Latino
Year householder moved into unit - Moved in 1999 to March 2000 (%) - American Indian and Alaska Native
Year householder moved into unit - Moved in 1999 to March 2000 (%) - Multirace
Year householder moved into unit - Moved in 1999 to March 2000 (%) - Other Race
Year householder moved into unit - Moved in 1995 to 1998 (%)
Year householder moved into unit - Moved in 1995 to 1998 (%) - White
Year householder moved into unit - Moved in 1995 to 1998 (%) - Black or African American
Year householder moved into unit - Moved in 1995 to 1998 (%) - Asian
Year householder moved into unit - Moved in 1995 to 1998 (%) - Hispanic or Latino
Year householder moved into unit - Moved in 1995 to 1998 (%) - American Indian and Alaska Native
Year householder moved into unit - Moved in 1995 to 1998 (%) - Multirace
Year householder moved into unit - Moved in 1995 to 1998 (%) - Other Race
Year householder moved into unit - Moved in 1990 to 1994 (%)
Year householder moved into unit - Moved in 1990 to 1994 (%) - White
Year householder moved into unit - Moved in 1990 to 1994 (%) - Black or African American
Year householder moved into unit - Moved in 1990 to 1994 (%) - Asian
Year householder moved into unit - Moved in 1990 to 1994 (%) - Hispanic or Latino
Year householder moved into unit - Moved in 1990 to 1994 (%) - American Indian and Alaska Native
Year householder moved into unit - Moved in 1990 to 1994 (%) - Multirace
Year householder moved into unit - Moved in 1990 to 1994 (%) - Other Race
Year householder moved into unit - Moved in 1980 to 1989 (%)
Year householder moved into unit - Moved in 1980 to 1989 (%) - White
Year householder moved into unit - Moved in 1980 to 1989 (%) - Black or African American
Year householder moved into unit - Moved in 1980 to 1989 (%) - Asian
Year householder moved into unit - Moved in 1980 to 1989 (%) - Hispanic or Latino
Year householder moved into unit - Moved in 1980 to 1989 (%) - American Indian and Alaska Native
Year householder moved into unit - Moved in 1980 to 1989 (%) - Multirace
Year householder moved into unit - Moved in 1980 to 1989 (%) - Other Race
Year householder moved into unit - Moved in 1970 to 1979 (%)
Year householder moved into unit - Moved in 1970 to 1979 (%) - White
Year householder moved into unit - Moved in 1970 to 1979 (%) - Black or African American
Year householder moved into unit - Moved in 1970 to 1979 (%) - Asian
Year householder moved into unit - Moved in 1970 to 1979 (%) - Hispanic or Latino
Year householder moved into unit - Moved in 1970 to 1979 (%) - American Indian and Alaska Native
Year householder moved into unit - Moved in 1970 to 1979 (%) - Multirace
Year householder moved into unit - Moved in 1970 to 1979 (%) - Other Race
Year householder moved into unit - Moved in 1969 or earlier (%)
Year householder moved into unit - Moved in 1969 or earlier (%) - White
Year householder moved into unit - Moved in 1969 or earlier (%) - Black or African American
Year householder moved into unit - Moved in 1969 or earlier (%) - Asian
Year householder moved into unit - Moved in 1969 or earlier (%) - Hispanic or Latino
Year householder moved into unit - Moved in 1969 or earlier (%) - American Indian and Alaska Native
Year householder moved into unit - Moved in 1969 or earlier (%) - Multirace
Year householder moved into unit - Moved in 1969 or earlier (%) - Other Race
Housing units lacking complete plumbing facilities (%)
Housing units lacking complete kitchen facilities (%)
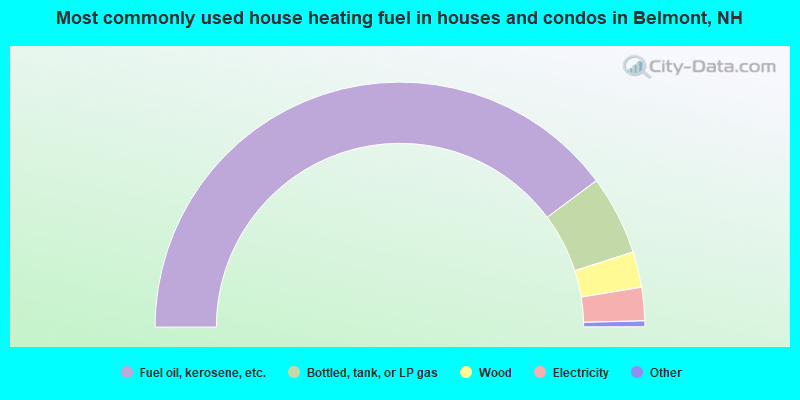
House heating fuel used in houses and condos - Utility gas (%)
House heating fuel used in houses and condos - Bottled, tank, or LP gas (%)
House heating fuel used in houses and condos - Electricity (%)
House heating fuel used in houses and condos - Fuel oil, kerosene, etc. (%)
House heating fuel used in houses and condos - Coal or coke (%)
House heating fuel used in houses and condos - Wood (%)
House heating fuel used in houses and condos - Solar energy (%)
House heating fuel used in houses and condos - Other fuel (%)
House heating fuel used in houses and condos - No fuel used (%)
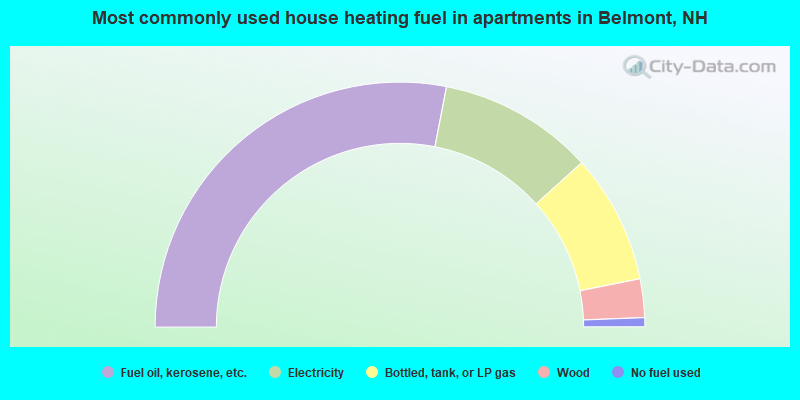
House heating fuel used in apartments - Utility gas (%)
House heating fuel used in apartments - Bottled, tank, or LP gas (%)
House heating fuel used in apartments - Electricity (%)
House heating fuel used in apartments - Fuel oil, kerosene, etc. (%)
House heating fuel used in apartments - Coal or coke (%)
House heating fuel used in apartments - Wood (%)
House heating fuel used in apartments - Solar energy (%)
House heating fuel used in apartments - Other fuel (%)
House heating fuel used in apartments - No fuel used (%)
Latest news about housing in Belmont, NH collected exclusively by city-data.com from local newspapers, TV, and radio stations
Household type by relationship:
Households: 59,230
In family households: 48,885 (11,375 male householders , 5,234 female householders )
12,991 spouses , 15,131 children (13,859 natural , 380 adopted , 892 stepchildren ), 967 grandchildren , 328 brothers or sisters , 471 parents , foster children , 404 other relatives , 1,667 non-relatives In nonfamily households: 10,345 (3,846 male householders (2,885 living alone )), 4,311 female householders (3,475 living alone )), 2,188 nonrelatives In group quarters: 858 (719 institutionalized population)
9,297 married couples with children. single-parent households (871 men , 2,240 women ).
96.7% of residents of Belmont speak English at home. of residents speak Spanish at home (100% speak English very well ).of residents speak other Indo-European language at home (82% speak English very well , 15% speak English well , 3% don't speak English at all ).
Foreign born population: 94 (1.2%)of them are naturalized citizens )
Median number of rooms in houses and condos:
Median number of rooms in apartments
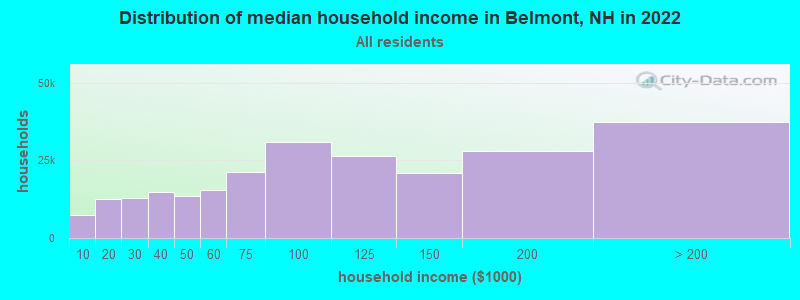
Belmont, NH household income distribution 6,958 Less than $10,00011,630 $10,000 to $19,99911,771 $20,000 to $29,99914,213 $30,000 to $39,99912,557 $40,000 to $49,99914,031 $50,000 to $59,99919,910 $60,000 to $74,99928,908 $75,000 to $99,99925,569 $100,000 to $124,99920,392 $125,000 to $149,99926,581 $150,000 to $199,99936,069 $200,000 or more
Percentage of workers working in this county: 77.6%Number of people working at home: 766 (17.4% of all workers )
Travel time to work (commute)
Less than 5 minutes: 1415 to 9 minutes: 34010 to 14 minutes: 79015 to 19 minutes: 88720 to 24 minutes: 32925 to 29 minutes: 15630 to 34 minutes: 31235 to 39 minutes: 8340 to 44 minutes: 9345 to 59 minutes: 21960 to 89 minutes: 22190 or more minutes: 104
Means of transportation to work:
Drove a car alone: 3,136 (83.0%)Carpooled: 373 (9.9%)Bus or trolley bus : 33 (0.9%)Motorcycle: 13 (0.3%)Walked: 104 (2.8%)Other means: 16 (0.4%)Worked at home: 102 (2.7%)
Year of entry for the foreign-born population in Belmont, New Hampshire
11 1995 to March 2000 8 1990 to 1994 0 1985 to 1989 0 1980 to 1984 9 1975 to 1979 0 1970 to 1974 0 1965 to 1969 37 Before 1965
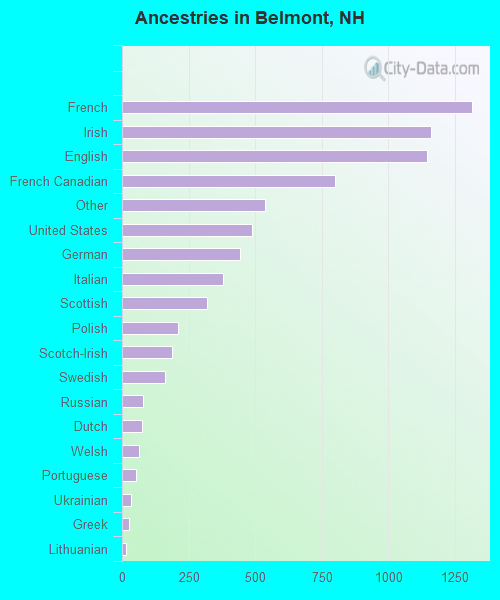
First ancestries reported:
French: 1,313 (17.5%)
Irish: 1,161 (15.4%)
English: 1,145 (15.2%)
French Canadian: 799 (10.6%)
Other: 539 (7.2%)
United States: 487 (6.5%)
German: 443 (5.9%)
Italian: 380 (5.1%)
Scottish: 318 (4.2%)
Polish: 212 (2.8%)
Scotch-Irish: 186 (2.5%)
Swedish: 160 (2.1%)
Russian: 79 (1.1%)
Dutch: 76 (1.0%)
Welsh: 62 (0.8%)
Portuguese: 52 (0.7%)
Ukrainian: 35 (0.5%)
Greek: 27 (0.4%)
Lithuanian: 16 (0.2%)
Danish: 10 (0.1%)
Hungarian: 9 (0.1%)
Swiss: 8 (0.1%)
Arab: 5 (0.07%) Most common places of birth for foreign-born residents (%): United Kingdom Belmont:
40.0% (26)New Hampshire:
8.1% (4,396)
Canada Belmont:
23.1% (15)New Hampshire:
22.9% (12,397)
Poland Belmont:
20.0% (13)New Hampshire:
1.7% (931)
Other Eastern Europe Belmont:
16.9% (11)New Hampshire:
1.5% (786)
Place of birth for U.S.-born residents:
This state: 4,031Other state: 2,586Northeast: 2,128Midwest: 192South: 161West: 105 61% of Belmont residents lived in the same house 5 years ago.
Out of people who lived in different houses, 59% lived in this county.
Out of people who lived in different counties, 55% lived in New Hampshire.
Education attainment for males 25 years and older:
No schooling: 18Nursery to 4th grade: 05th and 6th grade: 187th and 8th grade: 1039th grade: 10410th grade: 7411th grade: 5212th grade, no diploma: 60High school graduate (or equivalency): 848Less than 1 year of college: 122Some college more than 1 year, no degree: 246Associate degree: 141Bachelor's degree: 279Master's degree: 130Professional school degree: 7Doctorate degree: 0
Education attainment for females 25 years and older:
No schooling: 7Nursery to 4th grade: 05th and 6th grade: 347th and 8th grade: 969th grade: 7110th grade: 11011th grade: 4412th grade, no diploma: 60High school graduate (or equivalency): 882Less than 1 year of college: 190Some college more than 1 year, no degree: 260Associate degree: 295Bachelor's degree: 277Master's degree: 42Professional school degree: 11Doctorate degree: 0
Housing units in structures:
One, detached: 1,798One, attached: 32Two: 1063 or 4: 2315 to 9: 6620 to 49: 18Mobile homes: 854Boats, RVs, vans, etc.: 8Median worth of mobile homes: $103,795
Housing units lacking complete plumbing facilities: 0.7%Housing units lacking complete kitchen facilities: 1.3%Private vs. public school enrollment:
Students in private schools in grades 1 to 8 (elementary and middle school): 53 Here:
6.6%New Hampshire:
8.9%
Students in private schools in grades 9 to 12 (high school): 6 Here:
1.3%New Hampshire:
10.7%
Students in private undergraduate colleges: 42 Here:
17.2%New Hampshire:
36.4%