Belmont, NY (New York) Houses and Residents
| Belmont: | $90,692 |
| New York: | $400,400 |
Mean price in 2022:
Detached houses: $97,380
Here: $97,380 State: $476,719 In 2-unit structures: $90,166
Here: $90,166 State: $713,077 Mobile homes: $59,781
Here: $59,781 State: $88,925
Total population: 947 (Urban population: 0, Rural population: 943 (4 farm, 939 nonfarm))
Houses: 429 (347 occupied: 264 owner occupied, 86 renter occupied)
| % of renters here: | 25% |
| State: | 46% |
Housing density: 429 houses/condos per square mile
Median price asked for vacant for-sale houses and condos in 2022 in this county: $94,979.
Median contract rent in 2022: $522 (lower quartile is $381, upper quartile is $591)
Median rent asked for vacant for-rent units in 2022: $438
Median gross rent in Belmont, NY in 2022: $609
Housing units in Belmont with a mortgage: 105 (24 second mortgage, 0 home equity loan, 25 both second mortgage and home equity loan)
Houses without a mortgage: 7
Median household income for houses/condos with a mortgage: $90,951
Median household income for apartments without a mortgage: $58,378
Median monthly housing costs: $637
Compare current foreclosures near Belmont, NY:
| Photo | Address | Area | Beds / Baths | Price | Details |
|---|---|---|---|---|---|

|
#1
State Route 244
Belmont, NY 14813
|
- sq. feet
|
- baths - beds |
show details | |

|
#2
Genesee St Apt 2
Belmont, NY 14813
|
- sq. feet
|
- baths - beds |
show details | |

|
#3
State Route 244
Belmont, NY 14813
|
- sq. feet
|
- baths - beds |
show details | |

|
#4
Vandermark Rd
Scio, NY 14880
|
- sq. feet
|
1 baths 3 beds |
$34,900
|
show details |

|
#5
Main St
Almond, NY 14804
|
1,848 sq. feet
|
2 baths 3 beds |
show details | |

|
#6
County Road 9
Scio, NY 14880
|
1,152 sq. feet
|
1 baths 4 beds |
show details | |

|
#7
Olive St
Bolivar, NY 14715
|
1,176 sq. feet
|
1 baths 4 beds |
show details | |

|
#8
County Road 23
Houghton, NY 14744
|
1,296 sq. feet
|
1 baths 3 beds |
show details | |

|
#9
Clark Rd
Alfred Station, NY 14803
|
2,520 sq. feet
|
2 baths 4 beds |
show details | |

|
#10
Linwood Dr
Cuba, NY 14727
|
2,052 sq. feet
|
2 baths 3 beds |
show details |
| Photo | Address | Area | Beds / Baths | Price | Details |
|---|---|---|---|---|---|

|
#11
Route 305
Cuba, NY 14727
|
1,687 sq. feet
|
1 baths 3 beds |
show details | |

|
#12
Williams Ave
Wellsville, NY 14895
|
1,207 sq. feet
|
1 baths 3 beds |
show details | |

|
#13
Crescent Dr
Wellsville, NY 14895
|
1,075 sq. feet
|
1 baths 3 beds |
show details | |

|
#14
County Road 1
Friendship, NY 14739
|
- sq. feet
|
- baths - beds |
show details | |

|
#15
Lynch Rd
Andover, NY 14806
|
- sq. feet
|
- baths - beds |
show details | |

|
#16
Stone Dam Rd
Wellsville, NY 14895
|
- sq. feet
|
- baths - beds |
show details | |

|
#17
Abbott Rd
Hinsdale, NY 14743
|
- sq. feet
|
- baths - beds |
show details | |

|
#18
Clark Rd
Alfred Station, NY 14803
|
- sq. feet
|
- baths - beds |
show details | |

|
#19
Haskell Rd
Hinsdale, NY 14743
|
- sq. feet
|
- baths - beds |
show details | |

|
#20
Route 275
Friendship, NY 14739
|
- sq. feet
|
- baths - beds |
show details |
| Photo | Address | Area | Beds / Baths | Price | Details |
|---|---|---|---|---|---|

|
#21
Mcmahon Rd
Hinsdale, NY 14743
|
- sq. feet
|
- baths - beds |
show details | |

|
#22
Hallsport Rd
Wellsville, NY 14895
|
- sq. feet
|
- baths - beds |
show details | |

|
Check over 1 million property listings on Foreclosure.com!
|
browse all offers | |||

Latest news about housing in Belmont, NY collected exclusively by city-data.com from local newspapers, TV, and radio stations

 | Best value apartments (9 replies) |
| Syracuse named one of 12 up-and-coming housing markets (266 replies) |
| Rental communities or condo communties Upstate NY (58 replies) |
| Isles new home is finished (123 replies) |
| How is Saratoga Springs? (177 replies) |
| $1.82 billion in development for Niagara Falls area in the works.... (336 replies) |

Median year apartment built: 1953
Household type by relationship:
Households: 851- Male householders: 157 (60 living alone), Female householders: 181 (76 living alone)
130 spouses (130 opposite-sex spouses), 31 unmarried partners, (31 opposite-sex unmarried partners), 207 children (202 natural, 0 adopted, 4 stepchildren), 15 grandchildren, 19 brothers or sisters, 2 parents, 56 foster children, 10 other relatives, 7 non-relatives
- In group quarters: 29
Size of family households: 49 2-persons, 66 3-persons, 54 4-persons, 6 5-persons.
Size of nonfamily households: 146 1-person, 22 2-persons, 5 3-persons.
74 married couples with children.
76 single-parent households (0 men, 76 women).
99.1% of residents of Belmont speak English at home.
0.5% of residents speak Spanish at home (100% speak English very well).
0.5% of residents speak other Indo-European language at home (100% speak English very well).
Foreign born population: 5 (0.6%)
(100.0% of them are naturalized citizens)
| Here: | 7.6 |
| State: | 6.3 |
| Here: | 3.7 |
| State: | 3.8 |

- Bedrooms in owner-occupied houses and condos in Belmont, New York
- 0no bedroom
- 61 bedroom
- 212 bedrooms
- 1483 bedrooms
- 764 bedrooms
- 135+ bedrooms

- Bedrooms in renter-occupied apartments in Belmont, New York
- 0no bedroom
- 661 bedroom
- 132 bedrooms
- 73 bedrooms
- 04 bedrooms
- 05+ bedrooms

- Cars and other vehicles available in Belmont in owner-occupied houses/condos
- 10no vehicle
- 991 vehicle
- 1092 vehicles
- 313 vehicles
- 84 vehicles
- 75+ vehicles

- Cars and other vehicles available in Belmont in renter-occupied apartments
- 30no vehicle
- 531 vehicle
- 42 vehicles
- 03 vehicles
- 04 vehicles
- 05+ vehicles

- Rooms in owner-occupied houses in Belmont, New York
- 01 room
- 02 rooms
- 03 rooms
- 114 rooms
- 175 rooms
- 366 rooms
- 537 rooms
- 718 rooms
- 779+ rooms

- Rooms in renter-occupied apartments in Belmont, New York
- 01 room
- 02 rooms
- 373 rooms
- 354 rooms
- 55 rooms
- 76 rooms
- 07 rooms
- 38 rooms
- 09+ rooms


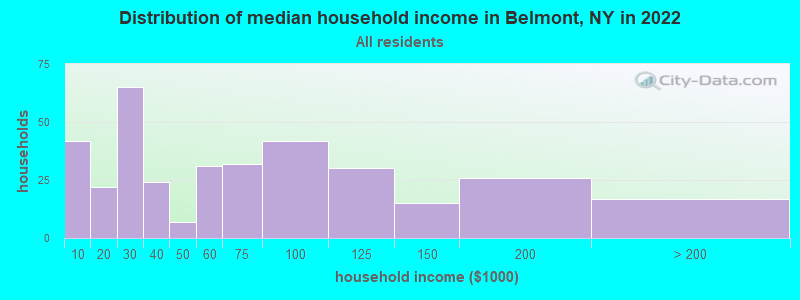
Belmont, NY household income distribution

- 42Less than $10,000
- 22$10,000 to $19,999
- 65$20,000 to $29,999
- 24$30,000 to $39,999
- 7$40,000 to $49,999
- 31$50,000 to $59,999
- 32$60,000 to $74,999
- 42$75,000 to $99,999
- 30$100,000 to $124,999
- 15$125,000 to $149,999
- 26$150,000 to $199,999
- 17$200,000 or more
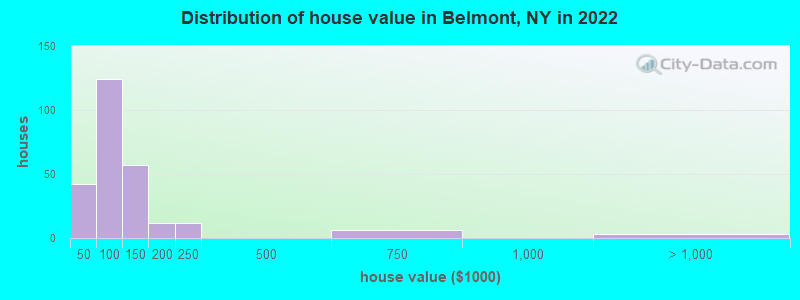
Home value of owner - occupied houses in 2022 in Belmont, NY
-
- 5$15,000 to $19,999
- 6$25,000 to $29,999
- 6$30,000 to $34,999
- 11$35,000 to $39,999
- 11$40,000 to $49,999
- 31$50,000 to $59,999
- 7$60,000 to $69,999
- 16$70,000 to $79,999
- 40$80,000 to $89,999
- 15$90,000 to $99,999
- 47$100,000 to $124,999
- 9$125,000 to $149,999
- 10$150,000 to $174,999
- 1$175,000 to $199,999
- 12$200,000 to $249,999
- 5$500,000 to $749,999
- 2$1,000,000 to $1,499,999
Rent paid by renters in 2022 in Belmont, NY
-
- 1$100 to $149
- 6$250 to $299
- 0$300 to $349
- 15$350 to $399
- 12$400 to $449
- 17$500 to $549
- 11$550 to $599
- 6$600 to $649
- 11$700 to $749
- 4$800 to $899
- 2No cash rent


Percentage of workers working in this county: 65.3%
Number of people working at home: 23 (6.4% of all workers)
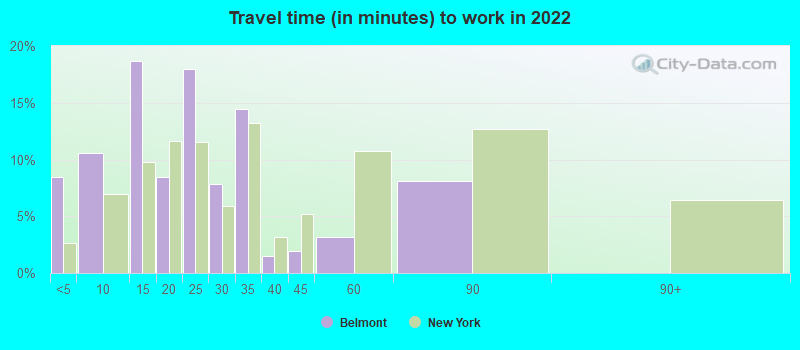
Travel time to work (commute)
- Less than 5 minutes: 67
- 5 to 9 minutes: 21
- 10 to 14 minutes: 38
- 15 to 19 minutes: 34
- 20 to 24 minutes: 42
- 25 to 29 minutes: 10
- 30 to 34 minutes: 19
- 35 to 39 minutes: 8
- 40 to 44 minutes: 33
- 45 to 59 minutes: 14
- 60 to 89 minutes: 40
- 90 or more minutes: 5
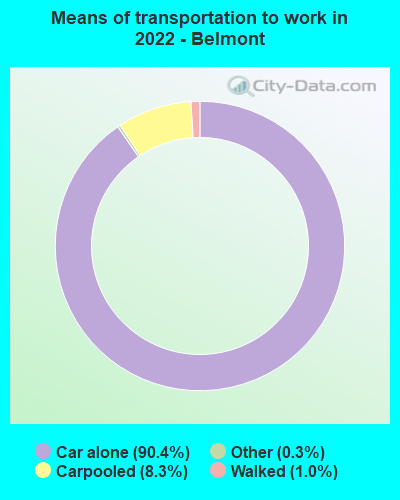
Means of transportation to work:
- Drove a car alone: 539 (85.3%)
- Carpooled: 52 (8.2%)
- Taxi: 2 (0.3%)
- Walked: 5 (0.8%)
- Worked at home: 23 (3.6%)

- Unemployment by race in 2022
- Unemployment rate for White non-Hispanic residents
- 1.1%Males
- 1.4%Females

- Year of entry for the foreign-born population in Belmont, New York
- 12010 or later
- 02000 to 2009
- 51990 to 1999
- 61980 to 1989
- 31970 to 1979
- 2Before 1970

First ancestries reported:
- Irish: 68 (25.8%)
- American: 50 (19.0%)
- English: 38 (14.4%)
- German: 25 (9.5%)
- Italian: 23 (8.7%)
- European: 13 (4.9%)
- Norwegian: 6 (2.3%)
- Scottish: 6 (2.3%)
- Pennsylvania German: 4 (1.5%)
- Czech: 3 (1.1%)
- Welsh: 3 (1.1%)
- British: 2 (0.8%)
- Dutch: 2 (0.8%)
- French: 2 (0.8%)
- Slavic: 2 (0.8%)
Most common places of birth for foreign-born residents (%):
| Belmont: | 80.0% (4) |
| New York: | 0.5% (23,058) |
| Belmont: | 20.0% (1) |
| New York: | 0.4% (19,652) |
Place of birth for U.S.-born residents:
- This state: 768
- Other state: 73
- Northeast: 49
- Midwest: 10
- South: 8
- West: 5
93.4% of Belmont residents lived in the same house 1 years ago.
Out of people who lived in different houses, 25.7% lived in this county.
Out of people who lived in different counties, 100.0% lived in New York.
| Belmont: | 93.4% |
| State average: | 89.6% |
Education attainment for males 25 years and older:
- No schooling: 0
- Nursery to 4th grade: 0
- 5th and 6th grade: 0
- 7th and 8th grade: 2
- 9th grade: 0
- 10th grade: 0
- 11th grade: 1
- 12th grade, no diploma: 2
- High school graduate (or equivalency): 117
- Less than 1 year of college: 6
- Some college more than 1 year, no degree: 27
- Associate degree: 34
- Bachelor's degree: 23
- Master's degree: 32
- Professional school degree: 0
- Doctorate degree: 0

Education attainment for females 25 years and older:
- No schooling: 18
- Nursery to 4th grade: 0
- 5th and 6th grade: 0
- 7th and 8th grade: 3
- 9th grade: 2
- 10th grade: 0
- 11th grade: 0
- 12th grade, no diploma: 1
- High school graduate (or equivalency): 88
- Less than 1 year of college: 18
- Some college more than 1 year, no degree: 23
- Associate degree: 73
- Bachelor's degree: 49
- Master's degree: 25
- Professional school degree: 2
- Doctorate degree: 0


Housing units in structures:
- One, detached: 291
- One, attached: 7
- Two: 33
- 3 or 4: 47
- 10 to 19: 19
- 20 to 49: 26
- Mobile homes: 5
House/condo owner moved in on average 18 years ago
Renter moved in on average 3 years ago

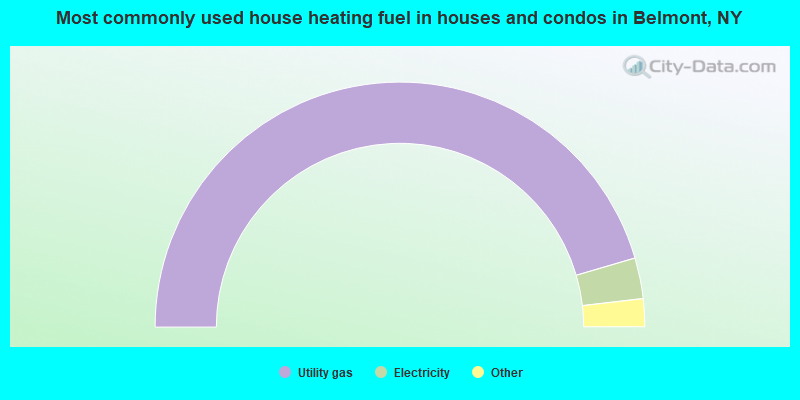
- 91.1%Utility gas
- 5.4%Electricity
- 1.9%Other fuel
- 1.5%Wood
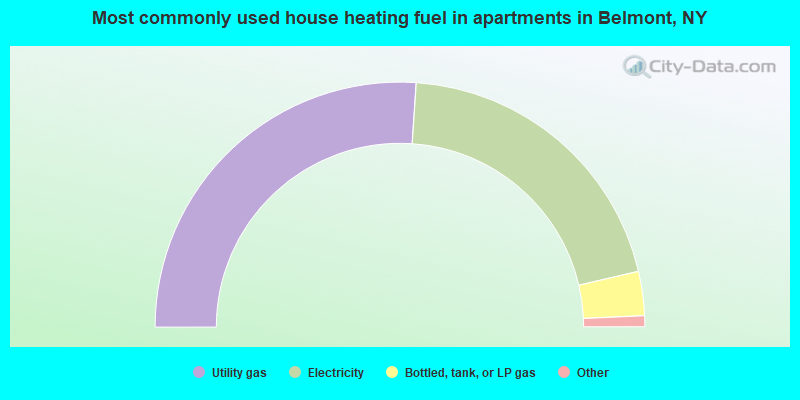
- 52.9%Utility gas
- 41.2%Electricity
- 5.9%Bottled, tank, or LP gas
Private vs. public school enrollment:
| Here: | 1.4% |
| New York: | 15.6% |
| Here: | 2.3% |
| New York: | 15.0% |
| Here: | 3.7% |
| New York: | 39.2% |


