Belton, SC (South Carolina) Houses and Residents
| Belton: | $131,085 |
| South Carolina: | $254,600 |
Total population: 4,289 (Urban population: 4,102, Rural population: 236 (all nonfarm))
Houses: 1,902 (1,663 occupied: 1,133 owner occupied, 579 renter occupied)
| % of renters here: | 34% |
| State: | 28% |
Housing density: 494 houses/condos per square mile
Median price asked for vacant for-sale houses and condos in 2022: $450,695.
Median contract rent in 2022: $585 (lower quartile is $420, upper quartile is $639)
Median rent asked for vacant for-rent units in 2022: $844
Median gross rent in Belton, SC in 2022: $829
Housing units in Belton with a mortgage: 463 (42 second mortgage, 0 home equity loan, 25 both second mortgage and home equity loan)
Houses without a mortgage: 0
Median household income for houses/condos with a mortgage: $77,658
Median household income for apartments without a mortgage: $39,448
Median monthly housing costs: $732
Compare current foreclosures near Belton, SC:
| Photo | Address | Area | Beds / Baths | Price | Details |
|---|---|---|---|---|---|

|
#1
Blue Ridge Ave
Belton, SC 29627
|
1,568 sq. feet
|
2 baths 3 beds |
$184,900
|
show details |

|
#2
W Oak Hill Rd
Belton, SC 29627
|
1,848 sq. feet
|
1 baths 3 beds |
show details | |

|
#3
Overlook Dr
Belton, SC 29627
|
- sq. feet
|
- baths - beds |
show details | |

|
#4
Oak Hill Ln
Belton, SC 29627
|
- sq. feet
|
- baths - beds |
show details | |

|
#5
Pelzer St
Belton, SC 29627
|
- sq. feet
|
- baths - beds |
show details | |

|
#6
Haynie Mill Rd
Belton, SC 29627
|
- sq. feet
|
- baths - beds |
show details | |

|
#7
Blue Heron Cir
Simpsonville, SC 29680
|
2,096 sq. feet
|
2 baths 3 beds |
$330,000
|
show details |

|
#8
Saluda St
Belton, SC 29627
|
- sq. feet
|
- baths - beds |
show details | |

|
#9
Calhoun Rd
Belton, SC 29627
|
- sq. feet
|
- baths - beds |
show details | |

|
#10
Haynie Mill Rd
Belton, SC 29627
|
- sq. feet
|
- baths - beds |
show details |
| Photo | Address | Area | Beds / Baths | Price | Details |
|---|---|---|---|---|---|

|
#11
Timberlane Dr
Belton, SC 29627
|
- sq. feet
|
- baths - beds |
show details | |

|
#12
N Archie St
Piedmont, SC 29673
|
- sq. feet
|
1 baths 3 beds |
$53,600
|
show details |

|
#13
N Prince St
Anderson, SC 29624
|
- sq. feet
|
2 baths 2 beds |
$59,900
|
show details |

|
#14
Shirley Ave
Honea Path, SC 29654
|
2,235 sq. feet
|
2 baths 4 beds |
show details | |

|
#15
Leftwich Ln
Anderson, SC 29621
|
1,527 sq. feet
|
2 baths 3 beds |
show details | |

|
#16
S Green St
Williamston, SC 29697
|
1,557 sq. feet
|
2 baths 3 beds |
show details | |

|
#17
Jadewood Dr
Williamston, SC 29697
|
1,995 sq. feet
|
2 baths 3 beds |
show details | |

|
#18
Gordon St
Due West, SC 29639
|
1,011 sq. feet
|
2 baths 4 beds |
show details | |

|
#19
Scott Rd
Anderson, SC 29621
|
1,648 sq. feet
|
2 baths 3 beds |
show details | |

|
#20
Harris Bridge Rd
Anderson, SC 29621
|
2,618 sq. feet
|
3 baths 3 beds |
show details |
| Photo | Address | Area | Beds / Baths | Price | Details |
|---|---|---|---|---|---|

|
#21
Watson Rd
Fountain Inn, SC 29644
|
1,664 sq. feet
|
2 baths 3 beds |
show details | |

|
#22
Howland Dr
Anderson, SC 29626
|
1,589 sq. feet
|
2 baths 3 beds |
show details | |

|
#23
Traditions Blvd
Anderson, SC 29625
|
- sq. feet
|
- baths 4 beds |
show details | |

|
#24
Beaver Pond Dr
Piedmont, SC 29673
|
- sq. feet
|
2 baths 3 beds |
show details | |

|
#25
Greenmeadow Cir
Anderson, SC 29626
|
1,788 sq. feet
|
2 baths 3 beds |
show details | |

|
#26
Deerfield Dr
Honea Path, SC 29654
|
1,794 sq. feet
|
1 baths 3 beds |
show details | |

|
#27
Plamondon Dr
Simpsonville, SC 29680
|
2,072 sq. feet
|
2 baths 4 beds |
show details | |

|
#28
Blakely Rd
Piedmont, SC 29673
|
2,403 sq. feet
|
2 baths 4 beds |
show details | |

|
#29
Picardy Dr
Greenville, SC 29605
|
1,820 sq. feet
|
2 baths 3 beds |
show details | |

|
#30
Labonte Dr
Piedmont, SC 29673
|
1,508 sq. feet
|
2 baths 4 beds |
show details |
| Photo | Address | Area | Beds / Baths | Price | Details |
|---|---|---|---|---|---|

|
#31
Glen Martin Ln
Piedmont, SC 29673
|
1,352 sq. feet
|
2 baths 3 beds |
show details | |

|
#32
Charterhouse Ave
Piedmont, SC 29673
|
1,228 sq. feet
|
2 baths 3 beds |
show details | |

|
#33
Fork Shoals Rd
Simpsonville, SC 29680
|
1,229 sq. feet
|
1 baths 3 beds |
show details | |

|
#34
Augusta Rd
Pelzer, SC 29669
|
1,110 sq. feet
|
1 baths 2 beds |
show details | |

|
#35
Augusta Rd
Piedmont, SC 29673
|
1,764 sq. feet
|
2 baths 3 beds |
show details | |

|
#36
Windy Meadow Way
Simpsonville, SC 29680
|
1,390 sq. feet
|
2 baths 3 beds |
show details | |

|
#37
Arbor Woods Ln
Piedmont, SC 29673
|
- sq. feet
|
- baths - beds |
show details | |

|
#38
Nautique Ct
Anderson, SC 29625
|
- sq. feet
|
- baths - beds |
show details | |

|
#39
Marchbanks Ave Apt 28h
Anderson, SC 29621
|
- sq. feet
|
- baths - beds |
show details | |

|
#40
Moore Rd
Liberty, SC 29657
|
- sq. feet
|
- baths - beds |
show details |
| Photo | Address | Area | Beds / Baths | Price | Details |
|---|---|---|---|---|---|

|
#41
Loftis Dr
Pelzer, SC 29669
|
- sq. feet
|
- baths - beds |
show details | |

|
#42
S Circle Dr
Piedmont, SC 29673
|
- sq. feet
|
- baths - beds |
show details | |

|
#43
Corinth Dr
Piedmont, SC 29673
|
- sq. feet
|
- baths - beds |
show details | |

|
#44
Knight Rd
Gray Court, SC 29645
|
- sq. feet
|
- baths - beds |
show details | |

|
#45
Ellis Ave
Williamston, SC 29697
|
- sq. feet
|
- baths - beds |
show details | |

|
#46
Valley Rd
Anderson, SC 29625
|
- sq. feet
|
- baths - beds |
show details | |

|
#47
Yellow Branch Trl
Piedmont, SC 29673
|
- sq. feet
|
- baths - beds |
show details | |

|
#48
Ridge Row St
Piedmont, SC 29673
|
720 sq. feet
|
- baths - beds |
show details | |

|
#49
Spear Rd
Pendleton, SC 29670
|
- sq. feet
|
- baths - beds |
show details | |

|
Check over 1 million property listings on Foreclosure.com!
|
browse all offers | |||

Latest news about housing in Belton, SC collected exclusively by city-data.com from local newspapers, TV, and radio stations

 | apartments around Anderson (4 replies) |
| Flood and small roads Belton (1 reply) |
| QuikTrip coming to Greer and 6 other Upstate locales (775 replies) |
| Belton-Honea Path (6 replies) |
| 70s/80s Anderson Memories... (14 replies) |
| Total Solar Eclipse - Aug 21, 2017 (189 replies) |

Median year apartment built: 1964
Household type by relationship:
Households: 4,463- Male householders: 698 (132 living alone), Female householders: 957 (410 living alone)
978 spouses (978 opposite-sex spouses), 81 unmarried partners, (81 opposite-sex unmarried partners), 1,136 children (887 natural, 121 adopted, 127 stepchildren), 359 grandchildren, 27 brothers or sisters, 10 parents, 0 foster children, 182 other relatives, 23 non-relatives
- In group quarters: 7
Size of family households: 669 2-persons, 152 3-persons, 120 4-persons, 84 5-persons, 160 6-persons, 32 7-or-more-persons.
Size of nonfamily households: 534 1-person, 13 2-persons.
396 married couples with children.
417 single-parent households (1 men, 416 women).
97.8% of residents of Belton speak English at home.
2.2% of residents speak Spanish at home (84% speak English very well, 16% speak English well).
0.2% of residents speak Asian or Pacific Island language at home (100% speak English very well).
Foreign born population: 110 (2.5%)
(68.2% of them are naturalized citizens)
| Here: | 6.1 |
| State: | 6.4 |
| Here: | 4.4 |
| State: | 4.5 |

- Bedrooms in owner-occupied houses and condos in Belton, South Carolina
- 0no bedroom
- 641 bedroom
- 3422 bedrooms
- 6013 bedrooms
- 1204 bedrooms
- 75+ bedrooms

- Bedrooms in renter-occupied apartments in Belton, South Carolina
- 33no bedroom
- 351 bedroom
- 3532 bedrooms
- 1593 bedrooms
- 04 bedrooms
- 05+ bedrooms

- Cars and other vehicles available in Belton in owner-occupied houses/condos
- 84no vehicle
- 3831 vehicle
- 3832 vehicles
- 2123 vehicles
- 634 vehicles
- 115+ vehicles

- Cars and other vehicles available in Belton in renter-occupied apartments
- 29no vehicle
- 3101 vehicle
- 1832 vehicles
- 573 vehicles
- 04 vehicles
- 05+ vehicles

- Rooms in owner-occupied houses in Belton, South Carolina
- 01 room
- 02 rooms
- 853 rooms
- 964 rooms
- 2375 rooms
- 2816 rooms
- 1367 rooms
- 1008 rooms
- 1999+ rooms

- Rooms in renter-occupied apartments in Belton, South Carolina
- 331 room
- 02 rooms
- 1013 rooms
- 1204 rooms
- 1765 rooms
- 906 rooms
- 487 rooms
- 08 rooms
- 139+ rooms


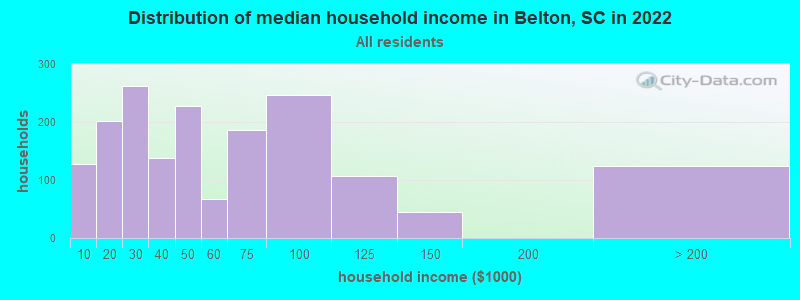
Belton, SC household income distribution

- 127Less than $10,000
- 202$10,000 to $19,999
- 262$20,000 to $29,999
- 138$30,000 to $39,999
- 227$40,000 to $49,999
- 68$50,000 to $59,999
- 186$60,000 to $74,999
- 246$75,000 to $99,999
- 107$100,000 to $124,999
- 45$125,000 to $149,999
- 124$200,000 or more
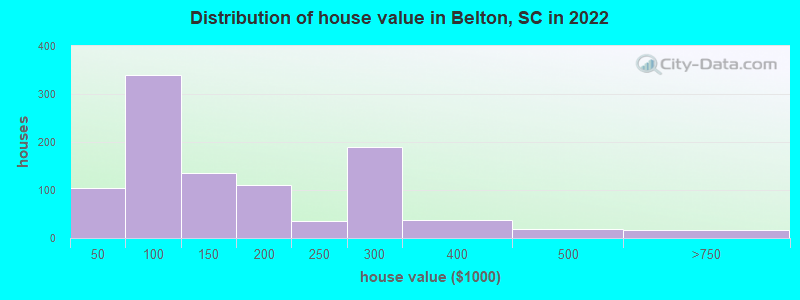
Home value of owner - occupied houses in 2022 in Belton, SC
-
- 27Less than $10,000
- 10$25,000 to $29,999
- 12$30,000 to $34,999
- 40$35,000 to $39,999
- 14$40,000 to $49,999
- 16$50,000 to $59,999
- 21$60,000 to $69,999
- 139$70,000 to $79,999
- 103$80,000 to $89,999
- 45$90,000 to $99,999
- 95$100,000 to $124,999
- 40$125,000 to $149,999
- 63$150,000 to $174,999
- 47$175,000 to $199,999
- 36$200,000 to $249,999
- 190$250,000 to $299,999
- 37$300,000 to $399,999
- 19$400,000 to $499,999
- 17$500,000 to $749,999
Rent paid by renters in 2022 in Belton, SC
-
- 69$200 to $249
- 22$250 to $299
- 12$300 to $349
- 9$350 to $399
- 45$400 to $449
- 56$450 to $499
- 57$500 to $549
- 108$550 to $599
- 57$600 to $649
- 13$650 to $699
- 3$750 to $799
- 14$800 to $899
- 33$900 to $999


Percentage of workers working in this county: 62.7%
Number of people working at home: 14 (0.7% of all workers)
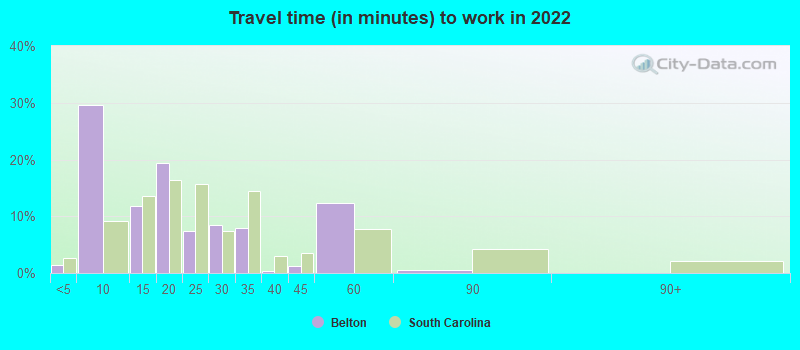
Travel time to work (commute)
- Less than 5 minutes: 30
- 5 to 9 minutes: 265
- 10 to 14 minutes: 113
- 15 to 19 minutes: 122
- 20 to 24 minutes: 276
- 25 to 29 minutes: 57
- 30 to 34 minutes: 212
- 35 to 39 minutes: 595
- 40 to 44 minutes: 112
- 45 to 59 minutes: 282
- 60 to 89 minutes: 56
- 90 or more minutes: 32
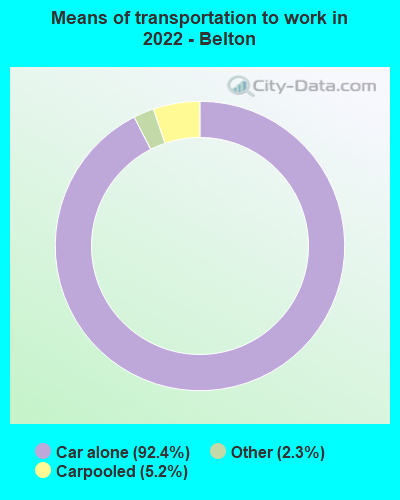
Means of transportation to work:
- Drove a car alone: 1,325 (88.4%)
- Carpooled: 78 (5.2%)
- Taxi: 36 (2.4%)
- Worked at home: 14 (0.9%)

- Unemployment by race in 2022
- Unemployment rate for White non-Hispanic residents
- 7.3%Males
- Unemployment rate for Black residents
- 26.8%Males
- Unemployment rate for two or more race residents
- 2.9%Males
- 21.7%Females

- Year of entry for the foreign-born population in Belton, South Carolina
- 02010 or later
- 152000 to 2009
- 291990 to 1999
- 01980 to 1989
- 131970 to 1979
- 16Before 1970

First ancestries reported:
- American: 321 (17.1%)
- English: 233 (12.4%)
- Irish: 176 (9.4%)
- Scotch-Irish: 81 (4.3%)
- Italian: 79 (4.2%)
- German: 58 (3.1%)
- Scottish: 31 (1.7%)
- European: 15 (0.8%)
- French Canadian: 15 (0.8%)
- Croatian: 11 (0.6%)
Most common places of birth for foreign-born residents (%):
| Belton: | 43.0% (46) |
| South Carolina: | 3.0% (8,193) |
| Belton: | 32.7% (35) |
| South Carolina: | 4.8% (12,834) |
| Belton: | 10.3% (11) |
| South Carolina: | 3.7% (9,982) |
| Belton: | 6.5% (7) |
| South Carolina: | 4.1% (11,031) |
| Belton: | 6.5% (7) |
| South Carolina: | 1.9% (5,117) |
Place of birth for U.S.-born residents:
- This state: 3,110
- Other state: 1,097
- Northeast: 301
- Midwest: 161
- South: 502
- West: 135
83.5% of Belton residents lived in the same house 1 years ago.
Out of people who lived in different houses, 29.5% lived in this county.
Out of people who lived in different counties, 37.1% lived in South Carolina.
| Belton: | 83.5% |
| State average: | 86.5% |
Education attainment for males 25 years and older:
- No schooling: 0
- Nursery to 4th grade: 0
- 5th and 6th grade: 6
- 7th and 8th grade: 0
- 9th grade: 0
- 10th grade: 60
- 11th grade: 96
- 12th grade, no diploma: 26
- High school graduate (or equivalency): 511
- Less than 1 year of college: 210
- Some college more than 1 year, no degree: 106
- Associate degree: 158
- Bachelor's degree: 104
- Master's degree: 30
- Professional school degree: 0
- Doctorate degree: 8

Education attainment for females 25 years and older:
- No schooling: 29
- Nursery to 4th grade: 0
- 5th and 6th grade: 0
- 7th and 8th grade: 48
- 9th grade: 34
- 10th grade: 95
- 11th grade: 25
- 12th grade, no diploma: 70
- High school graduate (or equivalency): 805
- Less than 1 year of college: 71
- Some college more than 1 year, no degree: 358
- Associate degree: 117
- Bachelor's degree: 117
- Master's degree: 81
- Professional school degree: 0
- Doctorate degree: 0


Housing units in structures:
- One, detached: 1,547
- One, attached: 32
- Two: 122
- 3 or 4: 15
- 5 to 9: 64
- 10 to 19: 3
- 20 to 49: 48
- Mobile homes: 67
Housing units lacking complete kitchen facilities in 2022: 6.8%
House/condo owner moved in on average 14 years ago
Renter moved in on average 2 years ago

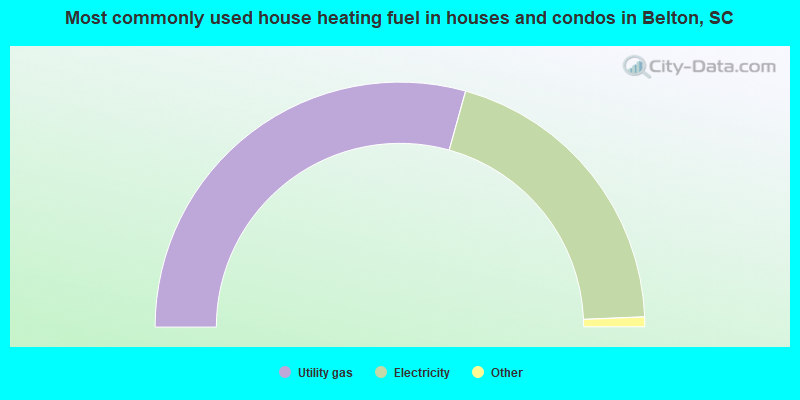
- 58.7%Utility gas
- 40.1%Electricity
- 1.0%Bottled, tank, or LP gas
- 0.2%Other fuel
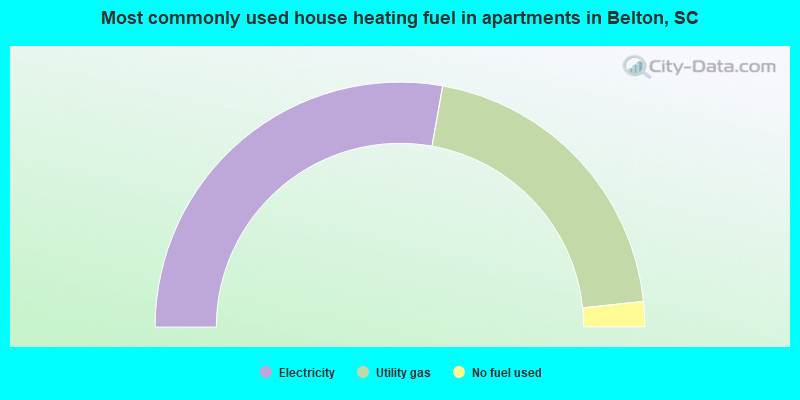
- 55.6%Electricity
- 41.1%Utility gas
- 3.3%No fuel used
Private vs. public school enrollment:
| Here: | 24.2% |
| South Carolina: | 14.4% |
| Here: | 61.2% |
| South Carolina: | 11.1% |
| Here: | 8.9% |
| South Carolina: | 21.9% |


