Belvedere, CA (California) Houses and Residents
| Belvedere: | over $2,270,476 |
| California: | $715,900 |
Mean price in 2022:
Detached houses: $5,405,743
Here: $5,405,743 State: $988,808
Total population: 2,129 (Urban population: 2,121, Rural population: 0)
Houses: 1,087 (888 occupied: 656 owner occupied, 226 renter occupied)
| % of renters here: | 26% |
| State: | 44% |
Housing density: 2,030 houses/condos per square mile
Median price asked for vacant for-sale houses and condos in 2022: $2,790,804.
Median contract rent in 2022: over $2,000
Median rent asked for vacant for-rent units in 2022: $2,406
Median gross rent in Belvedere, CA in 2022: over $2,000
Housing units in Belvedere with a mortgage: 414 (36 second mortgage, 0 home equity loan, 35 both second mortgage and home equity loan)
Houses without a mortgage: 6
Median household income for houses/condos with a mortgage: $263,303
Median household income for apartments without a mortgage: $264,041
Median monthly housing costs: $3,816
Compare current foreclosures near Belvedere, CA:
| Photo | Address | Area | Beds / Baths | Price | Details |
|---|---|---|---|---|---|

|
#1
Thorndale Dr Apt 435
San Rafael, CA 94903
|
1,096 sq. feet
|
2 baths 2 beds |
$139,900
|
show details |

|
#2
Seminary Ave
Oakland, CA 94605
|
1,552 sq. feet
|
1 baths 3 beds |
$556,400
|
show details |

|
#3
2nd St
Richmond, CA 94801
|
887 sq. feet
|
1 baths 3 beds |
$349,900
|
show details |

|
#4
Golden Gate Ave
Richmond, CA 94801
|
600 sq. feet
|
1 baths 1 beds |
$410,800
|
show details |

|
#5
Thorndale Dr Apt 206
San Rafael, CA 94903
|
660 sq. feet
|
1 baths 1 beds |
$53,900
|
show details |

|
#6
Van Ness Ave Apt 211
San Francisco, CA 94102
|
558 sq. feet
|
1 baths 1 beds |
show details | |

|
#7
Larkin St Apt 301
San Francisco, CA 94109
|
734 sq. feet
|
1 baths 2 beds |
show details | |

|
#8
Christie Ave Apt 2423
Emeryville, CA 94608
|
768 sq. feet
|
1 baths 1 beds |
show details | |

|
#9
21st St
San Pablo, CA 94806
|
1,665 sq. feet
|
2 baths 3 beds |
show details | |

|
#10
El Portal Dr Apt D
San Pablo, CA 94806
|
1,058 sq. feet
|
2 baths 2 beds |
show details |
| Photo | Address | Area | Beds / Baths | Price | Details |
|---|---|---|---|---|---|

|
#11
Valle Vista Ave
Oakland, CA 94610
|
2,163 sq. feet
|
2 baths 5 beds |
show details | |

|
#12
Larchmont Dr
Daly City, CA 94015
|
1,397 sq. feet
|
1 baths 3 beds |
show details | |

|
#13
Lausanne Ave
Daly City, CA 94014
|
1,490 sq. feet
|
1 baths 2 beds |
show details | |

|
#14
Lausanne Ave
Daly City, CA 94014
|
1,380 sq. feet
|
1 baths 3 beds |
show details | |

|
#15
Eastmoor Ave
Daly City, CA 94015
|
1,373 sq. feet
|
2 baths 4 beds |
show details | |

|
#16
Embarcadero W Apt 363
Oakland, CA 94607
|
476 sq. feet
|
1 baths 1 beds |
show details | |

|
#17
Redhawk Rd
Novato, CA 94949
|
1,731 sq. feet
|
2 baths 3 beds |
show details | |

|
#18
Athol Ave
Oakland, CA 94610
|
1,096 sq. feet
|
2 baths 2 beds |
show details | |

|
#19
Sunny Cove Dr
Novato, CA 94949
|
2,568 sq. feet
|
2 baths 4 beds |
show details | |

|
#20
Neds Way
Belvedere Tiburon, CA 94920
|
1,010 sq. feet
|
1 baths 2 beds |
show details |
| Photo | Address | Area | Beds / Baths | Price | Details |
|---|---|---|---|---|---|

|
#21
Hillside Blvd
Daly City, CA 94014
|
1,030 sq. feet
|
2 baths 3 beds |
show details | |

|
#22
Santa Clara Ave # 7
Oakland, CA 94610
|
904 sq. feet
|
1 baths 1 beds |
show details | |

|
#23
Caldecott Ln Unit 107
Oakland, CA 94618
|
773 sq. feet
|
1 baths 1 beds |
show details | |

|
#24
Mountain View Dr Apt 4
Daly City, CA 94014
|
1,443 sq. feet
|
2 baths 2 beds |
show details | |

|
#25
Heide Ct
El Sobrante, CA 94803
|
4,151 sq. feet
|
3 baths 5 beds |
show details | |

|
#26
Madison St Apt 202
Oakland, CA 94607
|
616 sq. feet
|
1 baths 1 beds |
show details | |

|
#27
Rancho Rd
El Sobrante, CA 94803
|
1,644 sq. feet
|
2 baths 4 beds |
show details | |

|
#28
Coleman Dr
San Rafael, CA 94901
|
1,815 sq. feet
|
2 baths 3 beds |
show details | |

|
#29
Cityview Dr
Daly City, CA 94014
|
1,487 sq. feet
|
3 baths 2 beds |
show details | |

|
#30
Jouett Sq
Alameda, CA 94501
|
3,179 sq. feet
|
2 baths 3 beds |
show details |
| Photo | Address | Area | Beds / Baths | Price | Details |
|---|---|---|---|---|---|

|
#31
Cedar Ct
Daly City, CA 94014
|
1,200 sq. feet
|
2 baths 3 beds |
show details | |

|
#32
Raymond Ave
San Francisco, CA 94134
|
975 sq. feet
|
1 baths 3 beds |
show details | |

|
#33
-1725 7th Ave
San Francisco, CA 94122
|
2,376 sq. feet
|
2 baths 4 beds |
show details | |

|
#34
Webster St
Oakland, CA 94609
|
1,705 sq. feet
|
2 baths 3 beds |
show details | |

|
#35
Santa Cruz Ave
Daly City, CA 94014
|
1,090 sq. feet
|
1 baths 2 beds |
show details | |

|
#36
Accacia St
Daly City, CA 94014
|
2,040 sq. feet
|
3 baths 4 beds |
show details | |

|
#37
16th St
Richmond, CA 94801
|
963 sq. feet
|
1 baths 2 beds |
show details | |

|
#38
Caldecott Ln Unit 206
Oakland, CA 94618
|
773 sq. feet
|
1 baths 1 beds |
show details | |

|
#39
Graystone Dr
South San Francisco, CA 94080
|
980 sq. feet
|
1 baths 3 beds |
show details | |

|
#40
Tahoe Cir
Novato, CA 94947
|
872 sq. feet
|
1 baths 2 beds |
show details |
| Photo | Address | Area | Beds / Baths | Price | Details |
|---|---|---|---|---|---|

|
#41
Stone Dr
Novato, CA 94947
|
1,444 sq. feet
|
2 baths 3 beds |
show details | |

|
#42
Coolidge Ave
Oakland, CA 94601
|
2,016 sq. feet
|
2 baths 3 beds |
show details | |

|
#43
Damonte Ct
South San Francisco, CA 94080
|
1,640 sq. feet
|
2 baths 4 beds |
show details | |

|
#44
Clay Ave
South San Francisco, CA 94080
|
1,030 sq. feet
|
1 baths 3 beds |
show details | |

|
#45
Cymbidium Cir
South San Francisco, CA 94080
|
1,610 sq. feet
|
2 baths 3 beds |
show details | |

|
#46
Balboa St
San Francisco, CA 94118
|
2,410 sq. feet
|
1 baths 3 beds |
show details | |

|
#47
Viola St
South San Francisco, CA 94080
|
3,390 sq. feet
|
4 baths 5 beds |
show details | |

|
#48
E 22nd St
Oakland, CA 94601
|
1,060 sq. feet
|
2 baths 3 beds |
show details | |

|
#49
Montebello Dr
Daly City, CA 94015
|
1,300 sq. feet
|
2 baths 3 beds |
show details | |

|
Check over 1 million property listings on Foreclosure.com!
|
browse all offers | |||

Latest news about housing in Belvedere, CA collected exclusively by city-data.com from local newspapers, TV, and radio stations


Median year apartment built: 1964
Household type by relationship:
Households: 2,287- Male householders: 447 (59 living alone), Female householders: 423 (131 living alone)
539 spouses (534 opposite-sex spouses), 34 unmarried partners, (29 opposite-sex unmarried partners), 727 children (663 natural, 49 adopted, 14 stepchildren), 0 grandchildren, 0 brothers or sisters, 5 parents, 0 foster children, 19 other relatives, 89 non-relatives
Size of family households: 303 2-persons, 115 3-persons, 145 4-persons, 57 5-persons, 18 6-persons.
Size of nonfamily households: 208 1-person, 19 2-persons, 8 5-persons.
445 married couples with children.
89 single-parent households (66 men, 23 women).
89.1% of residents of Belvedere speak English at home.
2.1% of residents speak Spanish at home (100% speak English very well).
5.7% of residents speak other Indo-European language at home (73% speak English very well, 21% speak English well, 6% don't speak English at all).
3.1% of residents speak Asian or Pacific Island language at home (18% speak English very well, 71% speak English well, 12% speak English not well).
Foreign born population: 390 (17.1%)
(41.8% of them are naturalized citizens)
| Here: | 8.0 |
| State: | 6.0 |
| Here: | 5.8 |
| State: | 3.9 |

- Bedrooms in owner-occupied houses and condos in Belvedere, California
- 0no bedroom
- 01 bedroom
- 612 bedrooms
- 1843 bedrooms
- 2764 bedrooms
- 1355+ bedrooms

- Bedrooms in renter-occupied apartments in Belvedere, California
- 0no bedroom
- 331 bedroom
- 902 bedrooms
- 473 bedrooms
- 394 bedrooms
- 185+ bedrooms

- Cars and other vehicles available in Belvedere in owner-occupied houses/condos
- 5no vehicle
- 1291 vehicle
- 3152 vehicles
- 1243 vehicles
- 484 vehicles
- 355+ vehicles

- Cars and other vehicles available in Belvedere in renter-occupied apartments
- 4no vehicle
- 1061 vehicle
- 632 vehicles
- 483 vehicles
- 04 vehicles
- 65+ vehicles

- Rooms in owner-occupied houses in Belvedere, California
- 01 room
- 02 rooms
- 03 rooms
- 44 rooms
- 575 rooms
- 1136 rooms
- 807 rooms
- 1588 rooms
- 2459+ rooms

- Rooms in renter-occupied apartments in Belvedere, California
- 01 room
- 02 rooms
- 123 rooms
- 704 rooms
- 45 rooms
- 456 rooms
- 197 rooms
- 218 rooms
- 569+ rooms


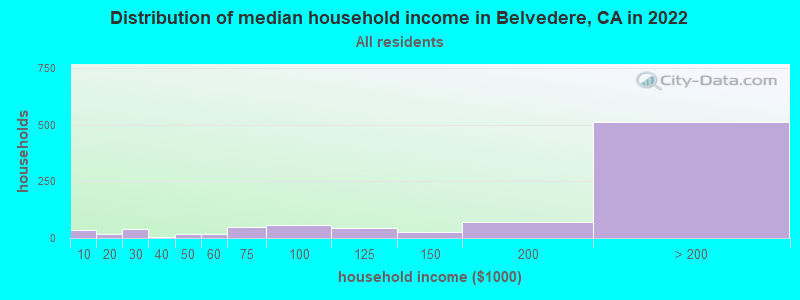
Belvedere, CA household income distribution

- 36Less than $10,000
- 17$10,000 to $19,999
- 38$20,000 to $29,999
- 3$30,000 to $39,999
- 17$40,000 to $49,999
- 17$50,000 to $59,999
- 47$60,000 to $74,999
- 56$75,000 to $99,999
- 46$100,000 to $124,999
- 25$125,000 to $149,999
- 69$150,000 to $199,999
- 513$200,000 or more
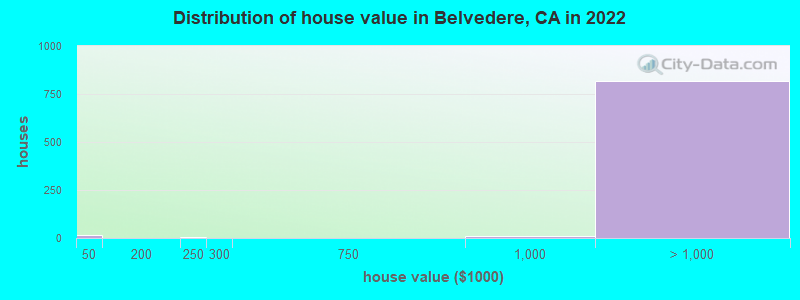
Home value of owner - occupied houses in 2022 in Belvedere, CA
-
- 13Less than $10,000
- 3$200,000 to $249,999
- 2$250,000 to $299,999
- 10$750,000 to $999,999
- 13$1,500,000 to $1,999,999
- 803$2,000,000 or more
Rent paid by renters in 2022 in Belvedere, CA
-
- 16$1,000 to $1,249
- 22$1,500 to $1,999
- 15$2,000 to $2,499
- 16$2,500 to $2,999
- 13$3,000 to $3,499
- 128$3,500 or more
- 3No cash rent


Percentage of workers working in this county: 72.3%
Number of people working at home: 456 (54.2% of all workers)
Travel time to work (commute)
- Less than 5 minutes: 22
- 5 to 9 minutes: 42
- 10 to 14 minutes: 33
- 15 to 19 minutes: 32
- 20 to 24 minutes: 19
- 25 to 29 minutes: 22
- 30 to 34 minutes: 64
- 35 to 39 minutes: 15
- 40 to 44 minutes: 37
- 45 to 59 minutes: 55
- 60 to 89 minutes: 59
- 90 or more minutes: 19
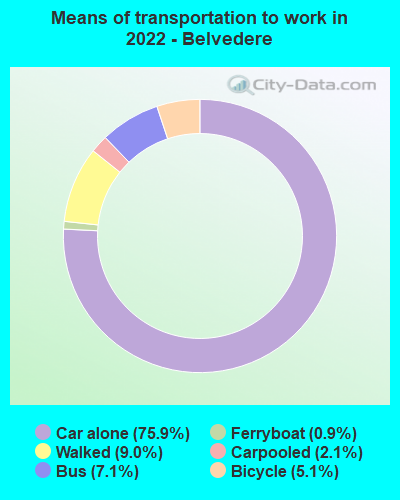
Means of transportation to work:
- Drove a car alone: 293 (36.4%)
- Carpooled: 7 (0.9%)
- Bus: 37 (4.6%)
- Ferryboat: 4 (0.5%)
- Bicycle: 40 (5.0%)
- Walked: 44 (5.5%)
- Worked at home: 456 (56.7%)

- Unemployment by race in 2022
- Unemployment rate for White non-Hispanic residents
- 1.8%Males
- 1.3%Females

- Year of entry for the foreign-born population in Belvedere, California
- 1622010 or later
- 1152000 to 2009
- 481990 to 1999
- 361980 to 1989
- 161970 to 1979
- 111Before 1970

First ancestries reported:
- English: 124 (12.1%)
- Irish: 109 (10.7%)
- European: 108 (10.6%)
- German: 61 (6.0%)
- Scandinavian: 56 (5.5%)
- Dutch: 37 (3.6%)
- Norwegian: 35 (3.4%)
- Northern European: 32 (3.1%)
- Russian: 32 (3.1%)
- Eastern European: 25 (2.4%)
- Italian: 24 (2.3%)
- American: 21 (2.1%)
- Portuguese: 18 (1.8%)
- Ukrainian: 18 (1.8%)
- Polish: 17 (1.7%)
- South African: 11 (1.1%)
- Scottish: 9 (0.9%)
- Turkish: 9 (0.9%)
- British: 8 (0.8%)
- Hungarian: 8 (0.8%)
- Scotch-Irish: 8 (0.8%)
- Swedish: 8 (0.8%)
- Armenian: 7 (0.7%)
- French: 7 (0.7%)
- Lithuanian: 6 (0.6%)
- Greek: 5 (0.5%)
- African: 5 (0.5%)
- French Canadian: 3 (0.3%)
Most common places of birth for foreign-born residents (%):
| Belvedere: | 20.6% (81) |
| California: | 1.2% (127,477) |
| Belvedere: | 14.8% (58) |
| California: | 0.6% (60,582) |
| Belvedere: | 13.2% (52) |
| California: | 0.2% (20,474) |
| Belvedere: | 10.4% (41) |
| California: | 37.2% (3,881,193) |
| Belvedere: | 5.6% (22) |
| California: | 0.7% (71,932) |
| Belvedere: | 5.1% (20) |
| California: | 0.0% (3,677) |
| Belvedere: | 4.8% (19) |
| California: | 0.4% (40,224) |
| Belvedere: | 3.6% (14) |
| California: | 0.7% (73,304) |
| Belvedere: | 2.8% (11) |
| California: | 6.6% (684,672) |
| Belvedere: | 2.5% (10) |
| California: | 0.2% (20,614) |
| Belvedere: | 2.0% (8) |
| California: | 1.7% (176,274) |
| Belvedere: | 2.0% (8) |
| California: | 0.5% (55,249) |
| Belvedere: | 1.5% (6) |
| California: | 0.2% (20,997) |
Place of birth for U.S.-born residents:
- This state: 1,023
- Other state: 836
- Northeast: 334
- Midwest: 207
- South: 189
- West: 105
87.2% of Belvedere residents lived in the same house 1 years ago.
Out of people who lived in different houses, 41.9% lived in this county.
Out of people who lived in different counties, 83.6% lived in California.
| Belvedere: | 87.2% |
| State average: | 88.9% |
Education attainment for males 25 years and older:
- No schooling: 4
- Nursery to 4th grade: 0
- 5th and 6th grade: 0
- 7th and 8th grade: 0
- 9th grade: 0
- 10th grade: 0
- 11th grade: 0
- 12th grade, no diploma: 0
- High school graduate (or equivalency): 31
- Less than 1 year of college: 0
- Some college more than 1 year, no degree: 36
- Associate degree: 10
- Bachelor's degree: 242
- Master's degree: 266
- Professional school degree: 117
- Doctorate degree: 46

Education attainment for females 25 years and older:
- No schooling: 0
- Nursery to 4th grade: 0
- 5th and 6th grade: 0
- 7th and 8th grade: 0
- 9th grade: 0
- 10th grade: 0
- 11th grade: 0
- 12th grade, no diploma: 7
- High school graduate (or equivalency): 44
- Less than 1 year of college: 7
- Some college more than 1 year, no degree: 72
- Associate degree: 25
- Bachelor's degree: 474
- Master's degree: 205
- Professional school degree: 32
- Doctorate degree: 31


Housing units in structures:
- One, detached: 921
- One, attached: 32
- Two: 26
- 3 or 4: 75
- 10 to 19: 14
- 20 to 49: 19
Housing units lacking complete kitchen facilities in 2022: 2.7%
House/condo owner moved in on average 12 years ago
Renter moved in on average 4 years ago

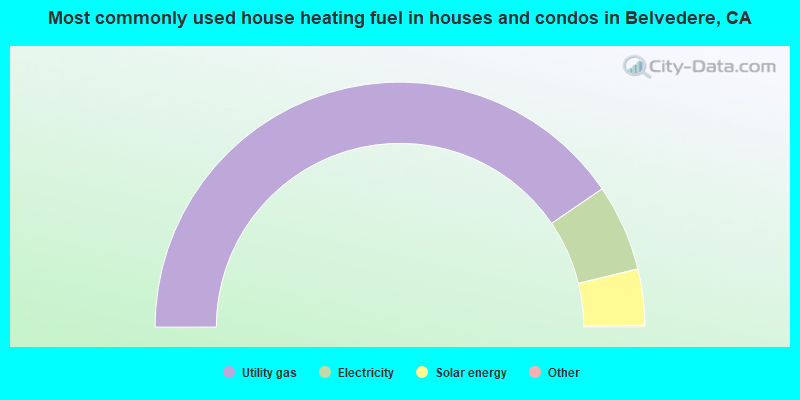
- 81.0%Utility gas
- 11.5%Electricity
- 7.4%Solar energy
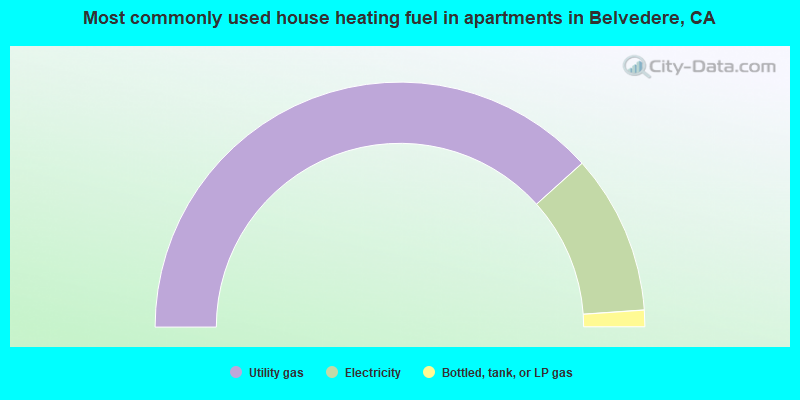
- 76.7%Utility gas
- 21.1%Electricity
- 2.2%Bottled, tank, or LP gas
Private vs. public school enrollment:
| Here: | 40.9% |
| California: | 10.5% |
| Here: | 43.6% |
| California: | 8.5% |
| Here: | 84.4% |
| California: | 15.9% |


