Belvidere, VT (Vermont) Houses and Residents
| Belvidere: | $230,540 |
| Vermont: | $304,700 |
Total population: 348 (Urban population: 0, Rural population: 286 (16 farm, 270 nonfarm))
Houses: 179 (110 occupied: 92 owner occupied, 18 renter occupied)
| % of renters here: | 16% |
| State: | 26% |
Housing density: 6 houses/condos per square mile
Median price asked for vacant for-sale houses and condos in 2022 in this county: $661,473.
Median contract rent in 2022: $992 (lower quartile is $651, upper quartile is $1,057)
Median gross rent in Belvidere, VT in 2022: $1,218
Housing units in Belvidere with a mortgage: 21 (3 second mortgage, 0 home equity loan, 0 both second mortgage and home equity loan)
Houses without a mortgage: 13


Household type by relationship:
Households: 23,781- In family households: 18,801 (4,207 male householders, 2,067 female householders)
4,833 spouses, 6,226 children (5,773 natural, 174 adopted, 279 stepchildren), 261 grandchildren, 99 brothers or sisters, 129 parents, foster children, 119 other relatives, 775 non-relatives
- In nonfamily households: 4,980 (1,954 male householders (1,345 living alone)), 1,786 female householders (1,390 living alone)), 1,240 nonrelatives
- In group quarters: 694 (75 institutionalized population)
3,943 married couples with children.
1,354 single-parent households (421 men, 933 women).
96.3% of residents of Belvidere speak English at home.
1.1% of residents speak Spanish at home (100% speak English very well).
2.6% of residents speak other Indo-European language at home (100% speak English very well).
Foreign born population: 2 (0.6%)
(100.0% of them are naturalized citizens)
| Here: | 5.3 |
| State: | 6.4 |
| Here: | 4.3 |
| State: | 3.9 |

- Bedrooms in owner-occupied houses and condos in Belvidere, Vermont
- 0no bedroom
- 21 bedroom
- 342 bedrooms
- 323 bedrooms
- 224 bedrooms
- 25+ bedrooms

- Bedrooms in renter-occupied apartments in Belvidere, Vermont
- 0no bedroom
- 01 bedroom
- 82 bedrooms
- 53 bedrooms
- 54 bedrooms
- 05+ bedrooms

- Cars and other vehicles available in Belvidere in owner-occupied houses/condos
- 3no vehicle
- 211 vehicle
- 472 vehicles
- 153 vehicles
- 64 vehicles
- 05+ vehicles

- Cars and other vehicles available in Belvidere in renter-occupied apartments
- 0no vehicle
- 141 vehicle
- 42 vehicles
- 03 vehicles
- 04 vehicles
- 05+ vehicles

- Rooms in owner-occupied houses in Belvidere, Vermont
- 01 room
- 22 rooms
- 53 rooms
- 184 rooms
- 235 rooms
- 156 rooms
- 157 rooms
- 138 rooms
- 19+ rooms

- Rooms in renter-occupied apartments in Belvidere, Vermont
- 01 room
- 02 rooms
- 33 rooms
- 74 rooms
- 35 rooms
- 26 rooms
- 37 rooms
- 08 rooms
- 09+ rooms


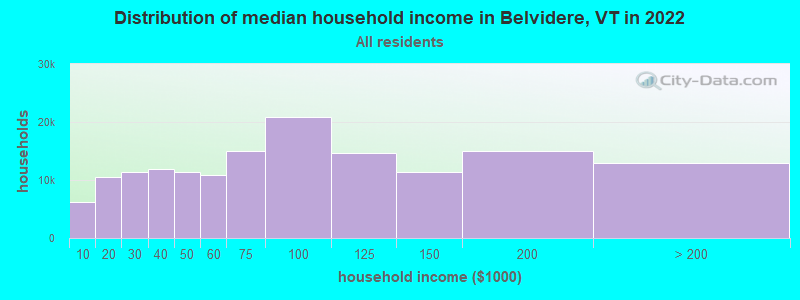
Belvidere, VT household income distribution

- 5,494Less than $10,000
- 11,217$10,000 to $19,999
- 12,878$20,000 to $29,999
- 14,988$30,000 to $39,999
- 13,902$40,000 to $49,999
- 13,546$50,000 to $59,999
- 18,030$60,000 to $74,999
- 27,290$75,000 to $99,999
- 18,071$100,000 to $124,999
- 14,428$125,000 to $149,999
- 18,321$150,000 to $199,999
- 16,549$200,000 or more
Percentage of workers working in this county: 64.8%
Number of people working at home: 28 (17.3% of all workers)
Travel time to work (commute)
- Less than 5 minutes: 5
- 5 to 9 minutes: 0
- 10 to 14 minutes: 2
- 15 to 19 minutes: 13
- 20 to 24 minutes: 10
- 25 to 29 minutes: 13
- 30 to 34 minutes: 26
- 35 to 39 minutes: 6
- 40 to 44 minutes: 3
- 45 to 59 minutes: 28
- 60 to 89 minutes: 18
- 90 or more minutes: 5
Means of transportation to work:
- Drove a car alone: 107 (71.8%)
- Carpooled: 14 (9.4%)
- Bus or trolley bus: 3 (2.0%)
- Walked: 5 (3.4%)
- Worked at home: 20 (13.4%)


- Year of entry for the foreign-born population in Belvidere, Vermont
- 01995 to March 2000
- 01990 to 1994
- 01985 to 1989
- 01980 to 1984
- 01975 to 1979
- 01970 to 1974
- 01965 to 1969
- 2Before 1965

First ancestries reported:
- Irish: 40 (16.0%)
- United States: 36 (14.4%)
- Other: 35 (14.0%)
- English: 31 (12.4%)
- French: 26 (10.4%)
- French Canadian: 23 (9.2%)
- German: 16 (6.4%)
- Scottish: 10 (4.0%)
- Russian: 7 (2.8%)
- Welsh: 7 (2.8%)
- Italian: 6 (2.4%)
- Ukrainian: 5 (2.0%)
- Scotch-Irish: 4 (1.6%)
- Polish: 3 (1.2%)
- Swedish: 1 (0.4%)
Most common places of birth for foreign-born residents (%):
| Belvidere: | 100.0% (2) |
| Vermont: | 34.0% (7,912) |
Place of birth for U.S.-born residents:
- This state: 210
- Other state: 71
- Northeast: 59
- Midwest: 11
- South: 1
- West: 0
69% of Belvidere residents lived in the same house 5 years ago.
Out of people who lived in different houses, 16% lived in this county.
Out of people who lived in different counties, 51% lived in Vermont.
Education attainment for males 25 years and older:
- No schooling: 0
- Nursery to 4th grade: 0
- 5th and 6th grade: 3
- 7th and 8th grade: 3
- 9th grade: 7
- 10th grade: 9
- 11th grade: 0
- 12th grade, no diploma: 0
- High school graduate (or equivalency): 36
- Less than 1 year of college: 2
- Some college more than 1 year, no degree: 14
- Associate degree: 3
- Bachelor's degree: 9
- Master's degree: 4
- Professional school degree: 2
- Doctorate degree: 2

Education attainment for females 25 years and older:
- No schooling: 0
- Nursery to 4th grade: 0
- 5th and 6th grade: 0
- 7th and 8th grade: 10
- 9th grade: 6
- 10th grade: 3
- 11th grade: 0
- 12th grade, no diploma: 1
- High school graduate (or equivalency): 41
- Less than 1 year of college: 4
- Some college more than 1 year, no degree: 16
- Associate degree: 3
- Bachelor's degree: 12
- Master's degree: 2
- Professional school degree: 0
- Doctorate degree: 0


Housing units in structures:
- One, detached: 141
- Two: 5
- Mobile homes: 33
Median worth of mobile homes: $78,423
Housing units lacking complete kitchen facilities: 4.5%

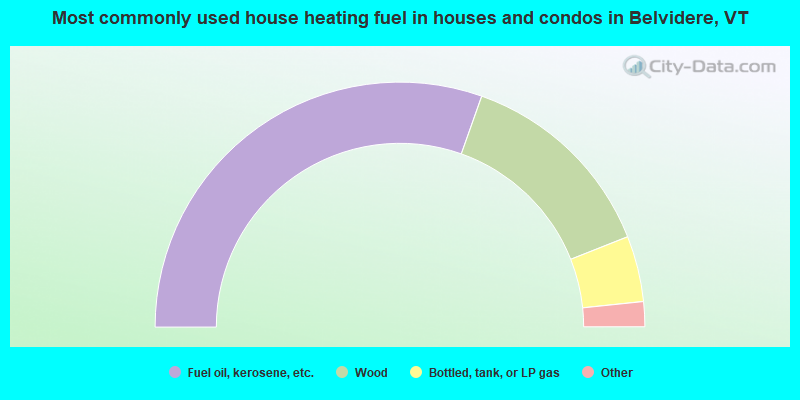
- 60.9%Fuel oil, kerosene, etc.
- 27.2%Wood
- 8.7%Bottled, tank, or LP gas
- 2.2%Coal or coke
- 1.1%Electricity
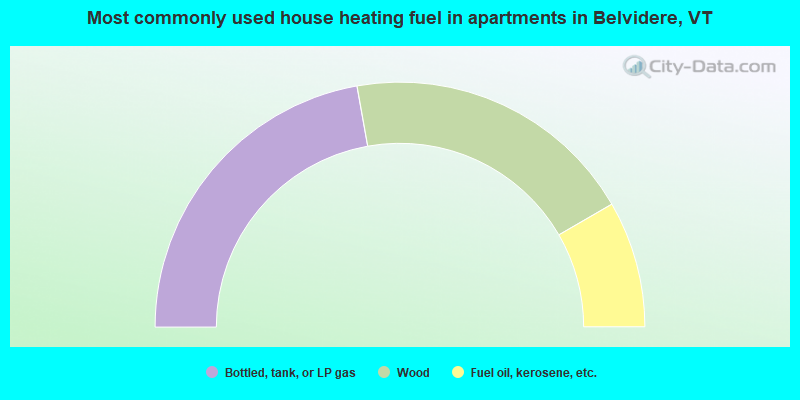
- 44.4%Bottled, tank, or LP gas
- 38.9%Wood
- 16.7%Fuel oil, kerosene, etc.
Private vs. public school enrollment:
| Here: | 9.3% |
| Vermont: | 7.2% |
| Here: | 0.0% |
| Vermont: | 10.4% |
| Here: | 40.0% |
| Vermont: | 37.7% |


