Bement, IL (Illinois) Houses and Residents
| Bement: | $103,018 |
| Illinois: | $251,600 |
Total population: 1,692 (Urban population: 0, Rural population: 1,792 (all nonfarm))
Houses: 706 (637 occupied: 528 owner occupied, 118 renter occupied)
| % of renters here: | 18% |
| State: | 33% |
Housing density: 869 houses/condos per square mile
Median price asked for vacant for-sale houses and condos in 2022: $29,135.
Median contract rent in 2022: $529 (lower quartile is $449, upper quartile is $702)
Median gross rent in Bement, IL in 2022: $764
Housing units in Bement with a mortgage: 290 (39 second mortgage, 0 home equity loan, 29 both second mortgage and home equity loan)
Houses without a mortgage: 4
Median household income for houses/condos with a mortgage: $87,278
Median household income for apartments without a mortgage: $51,659
Median monthly housing costs: $734
Compare current foreclosures near Bement, IL:
| Photo | Address | Area | Beds / Baths | Price | Details |
|---|---|---|---|---|---|

|
#1
W Wilson St
Bement, IL 61813
|
- sq. feet
|
2 baths 3 beds |
show details | |

|
#2
N Piatt St
Bement, IL 61813
|
- sq. feet
|
- baths - beds |
show details | |

|
#3
E 5th St
Hammond, IL 61929
|
- sq. feet
|
1 baths 4 beds |
$14,900
|
show details |

|
#4
N Champaign St
Bement, IL 61813
|
- sq. feet
|
- baths - beds |
show details | |

|
#5
Maple St
Weldon, IL 61882
|
879 sq. feet
|
1 baths 2 beds |
show details | |

|
#6
S Hickory St
Pesotum, IL 61863
|
1,155 sq. feet
|
1 baths 3 beds |
show details | |

|
#7
Birch Church Rd
Oreana, IL 62554
|
1,832 sq. feet
|
2 baths 3 beds |
show details | |

|
#8
E North 2nd St
La Place, IL 61936
|
984 sq. feet
|
1 baths 2 beds |
show details | |

|
#9
N Glendale Ave
Decatur, IL 62521
|
1,543 sq. feet
|
1 baths 2 beds |
show details | |

|
#10
S Walnut St
Pesotum, IL 61863
|
1,010 sq. feet
|
1 baths - beds |
show details |
| Photo | Address | Area | Beds / Baths | Price | Details |
|---|---|---|---|---|---|

|
#11
E Broadway St
Argenta, IL 62501
|
1,632 sq. feet
|
1 baths - beds |
show details | |

|
#12
N Kenwood St
Argenta, IL 62501
|
1,014 sq. feet
|
2 baths - beds |
show details | |

|
#13
W Austin St
Tolono, IL 61880
|
- sq. feet
|
- baths - beds |
show details | |

|
#14
N Main St
Argenta, IL 62501
|
- sq. feet
|
- baths - beds |
show details | |

|
#15
N Fork Rd
Decatur, IL 62521
|
- sq. feet
|
- baths - beds |
show details | |

|
#16
E Melwood Ct
Decatur, IL 62521
|
- sq. feet
|
- baths - beds |
show details | |

|
#17
Tilton St
Ivesdale, IL 61851
|
- sq. feet
|
- baths - beds |
show details | |

|
#18
Haynes Dr
Decatur, IL 62521
|
- sq. feet
|
- baths - beds |
show details | |

|
#19
Excelsior School Rd
Decatur, IL 62521
|
- sq. feet
|
- baths - beds |
show details | |

|
#20
N 1450 East Rd
White Heath, IL 61884
|
- sq. feet
|
- baths - beds |
show details |
| Photo | Address | Area | Beds / Baths | Price | Details |
|---|---|---|---|---|---|

|
#21
E Us Route 36
Decatur, IL 62521
|
- sq. feet
|
- baths - beds |
show details | |

|
#22
Wilcar Ct
Decatur, IL 62521
|
- sq. feet
|
- baths - beds |
show details | |

|
#23
Birch Church Rd
Oreana, IL 62554
|
- sq. feet
|
- baths - beds |
show details | |

|
#24
Reas Ridge Ct
Decatur, IL 62521
|
- sq. feet
|
- baths - beds |
show details | |

|
#25
Graces Ln
Decatur, IL 62521
|
- sq. feet
|
- baths - beds |
show details | |

|
#26
N Chestnut St
Pesotum, IL 61863
|
- sq. feet
|
- baths - beds |
show details | |

|
#27
Prairie St
Arthur, IL 61911
|
- sq. feet
|
- baths - beds |
show details | |

|
#28
E East St
Argenta, IL 62501
|
- sq. feet
|
- baths - beds |
show details | |

|
#29
E Elm St
Argenta, IL 62501
|
- sq. feet
|
- baths - beds |
show details | |

|
#30
E 1500 North Rd
Cisco, IL 61830
|
- sq. feet
|
- baths - beds |
show details |
| Photo | Address | Area | Beds / Baths | Price | Details |
|---|---|---|---|---|---|

|
#31
W Forest Ave
Atwood, IL 61913
|
- sq. feet
|
- baths - beds |
show details | |

|
#32
N 1225 East Rd
Monticello, IL 61856
|
- sq. feet
|
- baths - beds |
show details | |

|
#33
N Juniper Dr
Atwood, IL 61913
|
- sq. feet
|
- baths - beds |
show details | |

|
#34
N Union Dr
Monticello, IL 61856
|
- sq. feet
|
- baths - beds |
show details | |

|
#35
W William St
Monticello, IL 61856
|
- sq. feet
|
- baths - beds |
show details | |

|
#36
N Country Club Rd
Decatur, IL 62521
|
- sq. feet
|
- baths - beds |
show details | |

|
Check over 1 million property listings on Foreclosure.com!
|
browse all offers | |||

Latest news about housing in Bement, IL collected exclusively by city-data.com from local newspapers, TV, and radio stations

 | Relocating to Central IL possibly! (14 replies) |

Median year apartment built: 1977
Household type by relationship:
Households: 1,527- Male householders: 324 (119 living alone), Female householders: 301 (100 living alone)
298 spouses (298 opposite-sex spouses), 92 unmarried partners, (85 opposite-sex unmarried partners), 392 children (355 natural, 0 adopted, 37 stepchildren), 32 grandchildren, 3 brothers or sisters, 0 parents, 0 foster children, 25 other relatives, 16 non-relatives
- In group quarters: 38
Size of family households: 164 2-persons, 92 3-persons, 97 4-persons, 19 5-persons, 2 6-persons.
Size of nonfamily households: 231 1-person, 40 2-persons.
188 married couples with children.
68 single-parent households (10 men, 58 women).
97.3% of residents of Bement speak English at home.
1.5% of residents speak Spanish at home (77% speak English very well, 23% speak English not well).
0.2% of residents speak other Indo-European language at home (100% speak English very well).
Foreign born population: 12 (0.8%)
(25.0% of them are naturalized citizens)
| Here: | 6.4 |
| State: | 6.4 |
| Here: | 4.2 |
| State: | 4.1 |

- Bedrooms in owner-occupied houses and condos in Bement, Illinois
- 3no bedroom
- 41 bedroom
- 1102 bedrooms
- 3093 bedrooms
- 864 bedrooms
- 155+ bedrooms

- Bedrooms in renter-occupied apartments in Bement, Illinois
- 0no bedroom
- 371 bedroom
- 492 bedrooms
- 203 bedrooms
- 94 bedrooms
- 35+ bedrooms

- Cars and other vehicles available in Bement in owner-occupied houses/condos
- 11no vehicle
- 1601 vehicle
- 1732 vehicles
- 943 vehicles
- 654 vehicles
- 255+ vehicles

- Cars and other vehicles available in Bement in renter-occupied apartments
- 18no vehicle
- 421 vehicle
- 532 vehicles
- 33 vehicles
- 04 vehicles
- 25+ vehicles

- Rooms in owner-occupied houses in Bement, Illinois
- 01 room
- 32 rooms
- 03 rooms
- 224 rooms
- 1245 rooms
- 1276 rooms
- 1167 rooms
- 458 rooms
- 919+ rooms

- Rooms in renter-occupied apartments in Bement, Illinois
- 01 room
- 02 rooms
- 263 rooms
- 434 rooms
- 185 rooms
- 186 rooms
- 57 rooms
- 08 rooms
- 79+ rooms


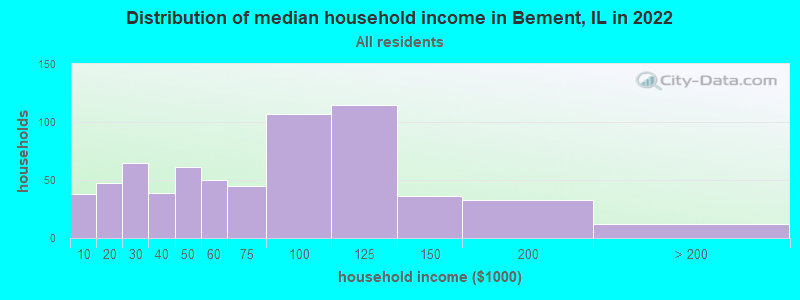
Bement, IL household income distribution

- 38Less than $10,000
- 47$10,000 to $19,999
- 65$20,000 to $29,999
- 39$30,000 to $39,999
- 61$40,000 to $49,999
- 50$50,000 to $59,999
- 45$60,000 to $74,999
- 107$75,000 to $99,999
- 115$100,000 to $124,999
- 36$125,000 to $149,999
- 33$150,000 to $199,999
- 12$200,000 or more
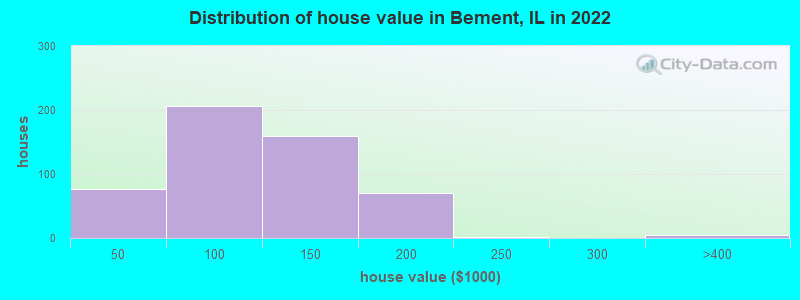
Home value of owner - occupied houses in 2022 in Bement, IL
-
- 6Less than $10,000
- 22$10,000 to $14,999
- 23$20,000 to $24,999
- 2$25,000 to $29,999
- 2$30,000 to $34,999
- 18$40,000 to $49,999
- 13$50,000 to $59,999
- 11$60,000 to $69,999
- 46$70,000 to $79,999
- 65$80,000 to $89,999
- 51$90,000 to $99,999
- 91$100,000 to $124,999
- 67$125,000 to $149,999
- 60$150,000 to $174,999
- 8$175,000 to $199,999
- 1$200,000 to $249,999
- 2$300,000 to $399,999
- 3$500,000 to $749,999
Rent paid by renters in 2022 in Bement, IL
-
- 16$150 to $199
- 5$300 to $349
- 3$350 to $399
- 4$400 to $449
- 14$450 to $499
- 20$500 to $549
- 6$550 to $599
- 3$600 to $649
- 11$650 to $699
- 15$700 to $749
- 14$800 to $899
- 4No cash rent


Percentage of workers working in this county: 53.2%
Number of people working at home: 70 (7.6% of all workers)
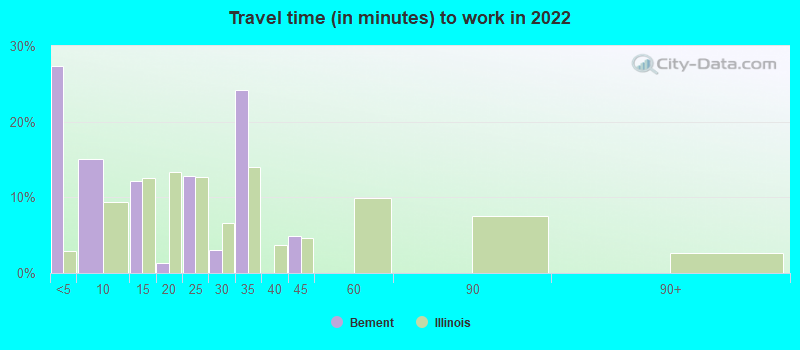
Travel time to work (commute)
- Less than 5 minutes: 126
- 5 to 9 minutes: 79
- 10 to 14 minutes: 123
- 15 to 19 minutes: 96
- 20 to 24 minutes: 67
- 25 to 29 minutes: 29
- 30 to 34 minutes: 92
- 35 to 39 minutes: 82
- 40 to 44 minutes: 46
- 45 to 59 minutes: 60
- 60 to 89 minutes: 2
- 90 or more minutes: 30
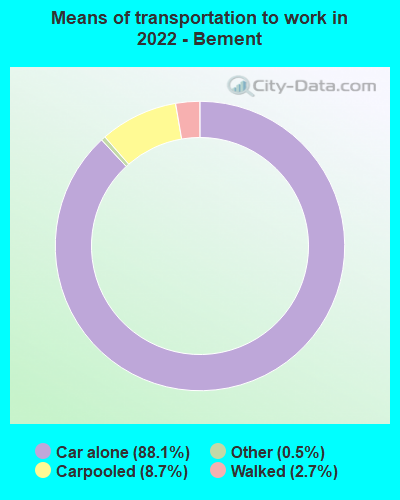
Means of transportation to work:
- Drove a car alone: 343 (74.9%)
- Carpooled: 36 (7.9%)
- Taxi: 2 (0.4%)
- Walked: 10 (2.2%)
- Worked at home: 70 (15.3%)

- Unemployment by race in 2022
- Unemployment rate for White non-Hispanic residents
- 2.1%Males
- 3.4%Females
- Unemployment rate for two or more race residents
- 28.2%Males

- Year of entry for the foreign-born population in Bement, Illinois
- 02010 or later
- 02000 to 2009
- 91990 to 1999
- 41980 to 1989
- 01970 to 1979
- 2Before 1970

First ancestries reported:
- American: 106 (18.2%)
- Irish: 105 (18.0%)
- English: 98 (16.8%)
- German: 93 (15.9%)
- Italian: 20 (3.4%)
- British: 19 (3.3%)
- European: 18 (3.1%)
- Swedish: 11 (1.9%)
- Scotch-Irish: 6 (1.0%)
- Norwegian: 5 (0.9%)
- Scottish: 4 (0.7%)
- French Canadian: 3 (0.5%)
- Polish: 3 (0.5%)
- Danish: 2 (0.3%)
- Dutch: 2 (0.3%)
Most common places of birth for foreign-born residents (%):
| Bement: | 66.7% (8) |
| Illinois: | 34.7% (626,958) |
| Bement: | 25.0% (3) |
| Illinois: | 0.1% (1,224) |
Place of birth for U.S.-born residents:
- This state: 1,293
- Other state: 215
- Northeast: 24
- Midwest: 71
- South: 71
- West: 47
91.6% of Bement residents lived in the same house 1 years ago.
Out of people who lived in different houses, 40.4% lived in this county.
Out of people who lived in different counties, 100.0% lived in Illinois.
| Bement: | 91.6% |
| State average: | 88.3% |
Education attainment for males 25 years and older:
- No schooling: 2
- Nursery to 4th grade: 0
- 5th and 6th grade: 0
- 7th and 8th grade: 0
- 9th grade: 0
- 10th grade: 4
- 11th grade: 12
- 12th grade, no diploma: 0
- High school graduate (or equivalency): 263
- Less than 1 year of college: 68
- Some college more than 1 year, no degree: 55
- Associate degree: 28
- Bachelor's degree: 53
- Master's degree: 16
- Professional school degree: 2
- Doctorate degree: 8

Education attainment for females 25 years and older:
- No schooling: 0
- Nursery to 4th grade: 0
- 5th and 6th grade: 0
- 7th and 8th grade: 0
- 9th grade: 0
- 10th grade: 1
- 11th grade: 9
- 12th grade, no diploma: 4
- High school graduate (or equivalency): 249
- Less than 1 year of college: 68
- Some college more than 1 year, no degree: 73
- Associate degree: 70
- Bachelor's degree: 82
- Master's degree: 24
- Professional school degree: 0
- Doctorate degree: 3


Housing units in structures:
- One, detached: 619
- Two: 31
- 3 or 4: 19
- 5 to 9: 14
- Mobile homes: 19
- Boats, RVs, vans, etc.: 3
Housing units lacking complete kitchen facilities in 2022: 2.1%
House/condo owner moved in on average 14 years ago
Renter moved in on average 2 years ago

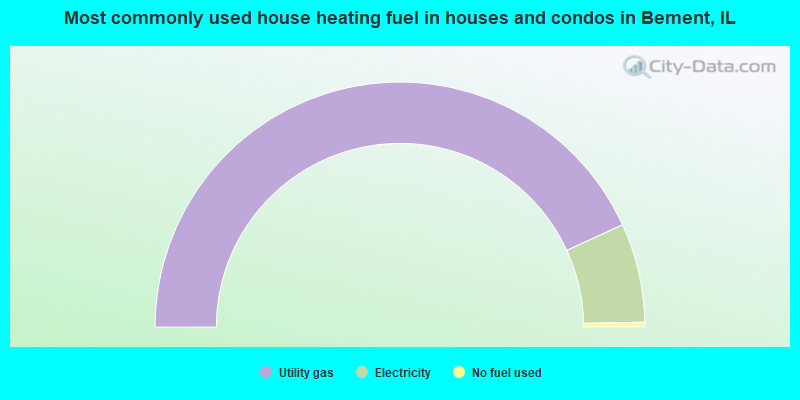
- 86.3%Utility gas
- 13.1%Electricity
- 0.6%No fuel used
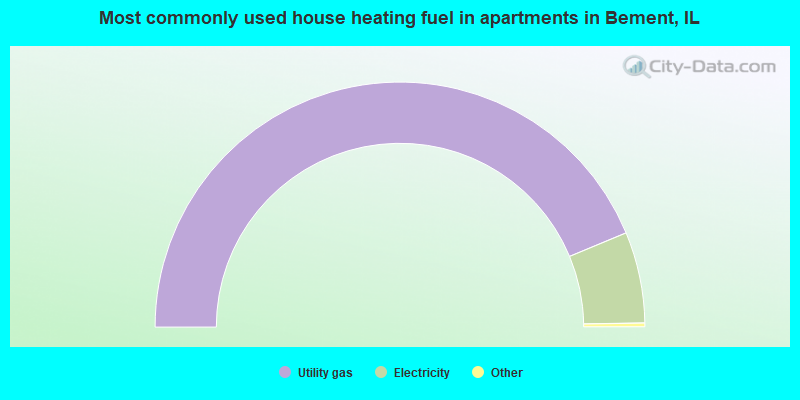
- 87.9%Utility gas
- 12.1%Electricity
Private vs. public school enrollment:
| Here: | 6.9% |
| Illinois: | 13.3% |
| Here: | 9.0% |
| Illinois: | 9.9% |
| Here: | 14.3% |
| Illinois: | 27.4% |


