Benbrook, TX (Texas) Houses and Residents
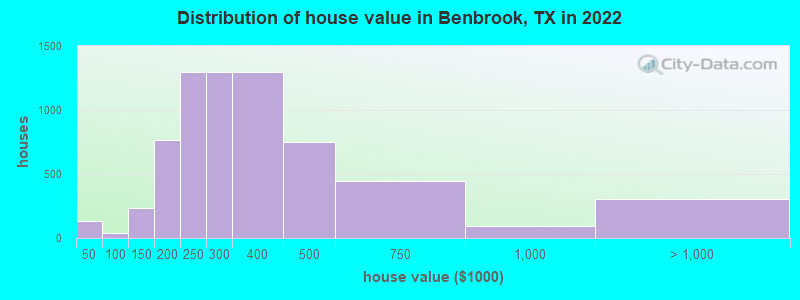
Estimated median house or condo value in 2022: $292,218 (it was $90,800 in 2000 )
Benbrook:
$292,218Texas:
$275,400
Lower value quartile - upper value quartile: $234,381 - $390,111Mean price in 2022: Detached houses: $282,128 Here:
$282,128State:
$369,058
Townhouses or other attached units: $230,585 Here:
$230,585State:
$327,631
In 3-to-4-unit structures: $116,604 Here:
$116,604State:
$209,652
In 5-or-more-unit structures: $388,921 Here:
$388,921State:
$413,944
Mobile homes: $58,547 Here:
$58,547State:
$124,413
Total population: 22,419 (Urban population: 19,784, Rural population: 77 (all nonfarm) )
Houses: 11,102 (10,120 occupied: 6,890 owner occupied, 3,263 renter occupied )
% of renters here:
32%State:
38%
Housing density: 969 houses/condos per square mile
Median price asked for vacant for-sale houses and condos in 2022: $259,548.
Median contract rent in 2022: $1,226 (lower quartile is $987, upper quartile is $1,536)
Median rent asked for vacant for-rent units in 2022: $1,504
Median gross rent in Benbrook, TX in 2022: $1,427
Housing units in Benbrook with a mortgage: 3,942 (117 second mortgage, 0 home equity loan, 103 both second mortgage and home equity loan )Houses without a mortgage: 106
Median household income for houses/condos with a mortgage: $117,490
Median household income for apartments without a mortgage: $74,572
Median monthly housing costs: $1,385
Data:
Median house or condo value ($)
Median house or condo value ($ change since 2000)
Median house or condo value ($) - White
Median house or condo value ($) - Black or African American
Median house or condo value ($) - Asian
Median house or condo value ($) - Hispanic or Latino
Median house or condo value ($) - American Indian and Alaska Native
Median house or condo value ($) - Multirace
Median house or condo value ($) - Other Race
Median price asked for mobile homes ($)
Household density (households per square mile)
Mean house or condo value by units in structure - 1, detached ($)
Mean house or condo value by units in structure - 1, attached ($)
Mean house or condo value by units in structure - 2 ($)
Mean house or condo value by units in structure by units in structure - 3 or 4 ($)
Mean house or condo value by units in structure - 5 or more ($)
Mean house or condo value by units in structure - Boat, RV, van, etc. ($)
Mean house or condo value by units in structure - Mobile home ($)
Median contract rent ($)
Median contract rent - Lower quartile ($)
Median contract rent - Upper quartile ($)
Median gross rent ($)
Urban houses (%)
Rural houses (%)
Houses occupied (%)
Houses occupied (% change since 2000)
Houses owner occupied (%)
Houses owner occupied (% change since 2000)
Houses renter occupied (%)
Houses renter occupied (% change since 2000)
Vacant housing units - For rent (%)
Vacant housing units - For rent (% change since 2000)
Vacant housing units - For sale only (%)
Vacant housing units - For sale only (% change since 2000)
Vacant housing units - Rented or sold, not occupied (%)
Vacant housing units - Rented or sold, not occupied (% change since 2000)
Vacant housing units - For seasonal, recreational, or occasional use (%)
Vacant housing units - For seasonal, recreational, or occasional use (% change since 2000)
Vacant housing units - For migrant workers (%)
Vacant housing units - For migrant workers (% change since 2000)
Vacant housing units - Other vacant (%)
Vacant housing units - Other vacant (% change since 2000)
Median monthly housing costs ($)
Median household income for houses/condos with a mortgage ($)
Median household income for houses/condos without a mortgage ($)
Median household income ($)
Median household income ($) - White
Median household income ($) - Black or African American
Median household income ($) - Asian
Median household income ($) - Hispanic or Latino
Median household income ($) - American Indian and Alaska Native
Median household income ($) - Multirace
Median household income ($) - Other Race
Mortgage status - with mortgage (%)
Mortgage status - with second mortgage (%)
Mortgage status - with home equity loan (%)
Mortgage status - with both second mortgage and home equity loan (%)
Mortgage status - without a mortgage (%)
Median year house/condo built
Median year apartment built
Household type by relationship - Male householder living alone (%)
Household type by relationship - Male householder not living alone (%)
Household type by relationship - Female householder living alone (%)
Household type by relationship - Female householder not living alone (%)
Household type by relationship - Opposite-Sex spouse (%)
Household type by relationship - Same-Sex spouse (%)
Household type by relationship - Opposite-Sex unmarried partner (%)
Household type by relationship - Same-Sex unmarried partner (%)
Household type by relationship - In group quarters (%)
Size of family households - 2-person household (%)
Size of family households - 3-person household (%)
Size of family households - 4-person household (%)
Size of family households - 5-person household (%)
Size of family households - 6-person household (%)
Size of family households - 7-or-more-person household (%)
Size of nonfamily households - 1-person household (%)
Size of nonfamily households - 2-person household (%)
Size of nonfamily households - 3-person household (%)
Size of nonfamily households - 4-person household (%)
Size of nonfamily households - 5-person household (%)
Size of nonfamily households - 6-person household (%)
Size of nonfamily households - 7-or-moreperson household (%)
Year house built - Built 2010 or later (%)
Year house built - Built 2000 to 2009 (%)
Year house built - Built 1990 to 1999 (%)
Year house built - Built 1980 to 1989 (%)
Year house built - Built 1970 to 1979 (%)
Year house built - Built 1960 to 1969 (%)
Year house built - Built 1950 to 1959 (%)
Year house built - Built 1940 to 1949 (%)
Year house built - Built 1939 or earlier (%)
Median number of rooms in houses and condos
Median number of rooms in apartments
Median number of bedrooms in owner occupied houses
Mean number of bedrooms in owner occupied houses
Median number of bedrooms in renter occupied houses
Mean number of bedrooms in renter occupied houses
Median number of vehichles in owner occupied houses
Mean number of vehichles in owner occupied houses
Median number of vehichles in renter occupied houses
Mean number of vehichles in renter occupied houses
Rooms in owner-occupied houses - 1 room (%)
Rooms in owner-occupied houses - 2 rooms (%)
Rooms in owner-occupied houses - 3 rooms (%)
Rooms in owner-occupied houses - 4 rooms (%)
Rooms in owner-occupied houses - 5 rooms (%)
Rooms in owner-occupied houses - 6 rooms (%)
Rooms in owner-occupied houses - 7 rooms (%)
Rooms in owner-occupied houses - 8 rooms (%)
Rooms in owner-occupied houses - 9+ rooms (%)
Rooms in renter-occupied houses - 1 room (%)
Rooms in renter-occupied houses - 2 rooms (%)
Rooms in renter-occupied houses - 3 rooms (%)
Rooms in renter-occupied houses - 4 rooms (%)
Rooms in renter-occupied houses - 5 rooms (%)
Rooms in renter-occupied houses - 6 rooms (%)
Rooms in renter-occupied houses - 7 rooms (%)
Rooms in renter-occupied houses - 8 rooms (%)
Rooms in renter-occupied houses - 9+ rooms (%)
Bedrooms in owner-occupied houses - no bedrooms (%)
Bedrooms in owner-occupied houses - 1 bedroom (%)
Bedrooms in owner-occupied houses - 2 bedrooms (%)
Bedrooms in owner-occupied houses - 3 bedrooms (%)
Bedrooms in owner-occupied houses - 4 bedrooms (%)
Bedrooms in owner-occupied houses - 5+ bedrooms (%)
Bedrooms in renter-occupied houses - no bedrooms (%)
Bedrooms in renter-occupied houses - 1 bedroom (%)
Bedrooms in renter-occupied houses - 2 bedrooms (%)
Bedrooms in renter-occupied houses - 3 bedrooms (%)
Bedrooms in renter-occupied houses - 4 bedrooms (%)
Bedrooms in renter-occupied houses - 5+ bedrooms (%)
Vehicles available in owner-occupied houses - no vehicle available (%)
Vehicles available in owner-occupied houses - 1 vehicle available(%)
Vehicles available in owner-occupied houses - 2 Vehicles available (%)
Vehicles available in owner-occupied houses - 3 Vehicles available (%)
Vehicles available in owner-occupied houses - 4 Vehicles available (%)
Vehicles available in owner-occupied houses - 5+ Vehicles available (%)
Vehicles available in renter-occupied houses - no vehicle available (%)
Vehicles available in renter-occupied houses - 1 vehicle available (%)
Vehicles available in renter-occupied houses - 2 Vehicles available (%)
Vehicles available in renter-occupied houses - 3 Vehicles available (%)
Vehicles available in renter-occupied houses - 4 Vehicles available (%)
Vehicles available in renter-occupied houses - 5+ Vehicles available (%)
Housing units in structures - 1, detached (%)
Housing units in structures - 1, attached (%)
Housing units in structures - 2 (%)
Housing units in structures - 3 or 4 (%)
Housing units in structures - 5 to 9 (%)
Housing units in structures - 10 to 19 (%)
Housing units in structures - 20 to 49 (%)
Housing units in structures - 50 or more (%)
Housing units in structures - Mobile home (%)
Housing units in structures - Boat, RV, van, etc. (%)
Housing units in structures - Owners - 1, detached (%)
Housing units in structures - Owners - 1, attached (%)
Housing units in structures - Owners - 2 (%)
Housing units in structures - Owners - 3 or 4 (%)
Housing units in structures - Owners - 5 to 9 (%)
Housing units in structures - Owners - 10 to 19 (%)
Housing units in structures - Owners - 20 to 49 (%)
Housing units in structures - Owners - 50 or more (%)
Housing units in structures - Owners - Mobile home (%)
Housing units in structures - Owners - Boat, RV, van, etc. (%)
Housing units in structures - Renters - 1, detached (%)
Housing units in structures - Renters - 1, attached (%)
Housing units in structures - Renters - 2 (%)
Housing units in structures - Renters - 3 or 4 (%)
Housing units in structures - Renters - 5 to 9 (%)
Housing units in structures - Renters - 10 to 19 (%)
Housing units in structures - Renters - 20 to 49 (%)
Housing units in structures - Renters - 50 or more (%)
Housing units in structures - Renters - Mobile home (%)
Housing units in structures - Renters - Boat, RV, van, etc. (%)
House/condo owner moved in on average (years ago)
Renter moved in on average (years ago)
Year householder moved into unit - Moved in 1999 to March 2000 (%)
Year householder moved into unit - Moved in 1999 to March 2000 (%) - White
Year householder moved into unit - Moved in 1999 to March 2000 (%) - Black or African American
Year householder moved into unit - Moved in 1999 to March 2000 (%) - Asian
Year householder moved into unit - Moved in 1999 to March 2000 (%) - Hispanic or Latino
Year householder moved into unit - Moved in 1999 to March 2000 (%) - American Indian and Alaska Native
Year householder moved into unit - Moved in 1999 to March 2000 (%) - Multirace
Year householder moved into unit - Moved in 1999 to March 2000 (%) - Other Race
Year householder moved into unit - Moved in 1995 to 1998 (%)
Year householder moved into unit - Moved in 1995 to 1998 (%) - White
Year householder moved into unit - Moved in 1995 to 1998 (%) - Black or African American
Year householder moved into unit - Moved in 1995 to 1998 (%) - Asian
Year householder moved into unit - Moved in 1995 to 1998 (%) - Hispanic or Latino
Year householder moved into unit - Moved in 1995 to 1998 (%) - American Indian and Alaska Native
Year householder moved into unit - Moved in 1995 to 1998 (%) - Multirace
Year householder moved into unit - Moved in 1995 to 1998 (%) - Other Race
Year householder moved into unit - Moved in 1990 to 1994 (%)
Year householder moved into unit - Moved in 1990 to 1994 (%) - White
Year householder moved into unit - Moved in 1990 to 1994 (%) - Black or African American
Year householder moved into unit - Moved in 1990 to 1994 (%) - Asian
Year householder moved into unit - Moved in 1990 to 1994 (%) - Hispanic or Latino
Year householder moved into unit - Moved in 1990 to 1994 (%) - American Indian and Alaska Native
Year householder moved into unit - Moved in 1990 to 1994 (%) - Multirace
Year householder moved into unit - Moved in 1990 to 1994 (%) - Other Race
Year householder moved into unit - Moved in 1980 to 1989 (%)
Year householder moved into unit - Moved in 1980 to 1989 (%) - White
Year householder moved into unit - Moved in 1980 to 1989 (%) - Black or African American
Year householder moved into unit - Moved in 1980 to 1989 (%) - Asian
Year householder moved into unit - Moved in 1980 to 1989 (%) - Hispanic or Latino
Year householder moved into unit - Moved in 1980 to 1989 (%) - American Indian and Alaska Native
Year householder moved into unit - Moved in 1980 to 1989 (%) - Multirace
Year householder moved into unit - Moved in 1980 to 1989 (%) - Other Race
Year householder moved into unit - Moved in 1970 to 1979 (%)
Year householder moved into unit - Moved in 1970 to 1979 (%) - White
Year householder moved into unit - Moved in 1970 to 1979 (%) - Black or African American
Year householder moved into unit - Moved in 1970 to 1979 (%) - Asian
Year householder moved into unit - Moved in 1970 to 1979 (%) - Hispanic or Latino
Year householder moved into unit - Moved in 1970 to 1979 (%) - American Indian and Alaska Native
Year householder moved into unit - Moved in 1970 to 1979 (%) - Multirace
Year householder moved into unit - Moved in 1970 to 1979 (%) - Other Race
Year householder moved into unit - Moved in 1969 or earlier (%)
Year householder moved into unit - Moved in 1969 or earlier (%) - White
Year householder moved into unit - Moved in 1969 or earlier (%) - Black or African American
Year householder moved into unit - Moved in 1969 or earlier (%) - Asian
Year householder moved into unit - Moved in 1969 or earlier (%) - Hispanic or Latino
Year householder moved into unit - Moved in 1969 or earlier (%) - American Indian and Alaska Native
Year householder moved into unit - Moved in 1969 or earlier (%) - Multirace
Year householder moved into unit - Moved in 1969 or earlier (%) - Other Race
Housing units lacking complete plumbing facilities (%)
Housing units lacking complete kitchen facilities (%)
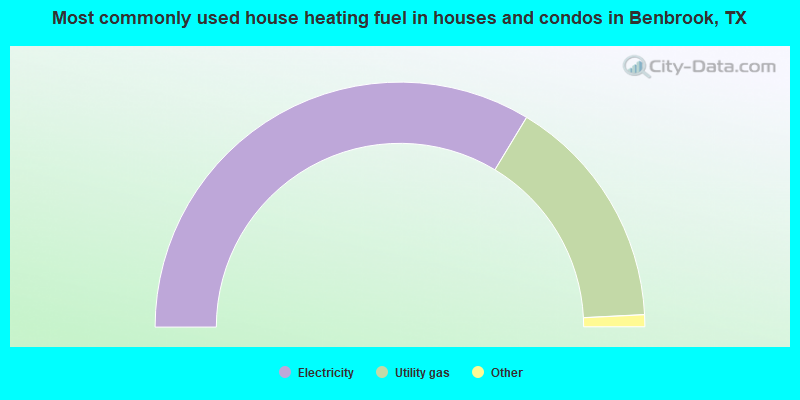
House heating fuel used in houses and condos - Utility gas (%)
House heating fuel used in houses and condos - Bottled, tank, or LP gas (%)
House heating fuel used in houses and condos - Electricity (%)
House heating fuel used in houses and condos - Fuel oil, kerosene, etc. (%)
House heating fuel used in houses and condos - Coal or coke (%)
House heating fuel used in houses and condos - Wood (%)
House heating fuel used in houses and condos - Solar energy (%)
House heating fuel used in houses and condos - Other fuel (%)
House heating fuel used in houses and condos - No fuel used (%)
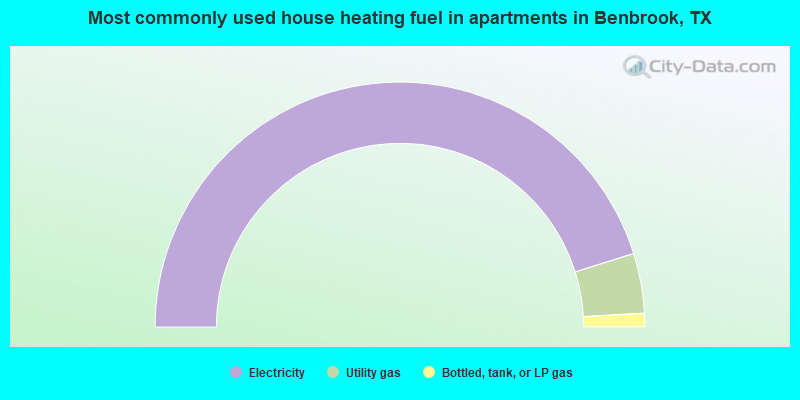
House heating fuel used in apartments - Utility gas (%)
House heating fuel used in apartments - Bottled, tank, or LP gas (%)
House heating fuel used in apartments - Electricity (%)
House heating fuel used in apartments - Fuel oil, kerosene, etc. (%)
House heating fuel used in apartments - Coal or coke (%)
House heating fuel used in apartments - Wood (%)
House heating fuel used in apartments - Solar energy (%)
House heating fuel used in apartments - Other fuel (%)
House heating fuel used in apartments - No fuel used (%)
Latest news about housing in Benbrook, TX collected exclusively by city-data.com from local newspapers, TV, and radio stations
Median year house/condo built: 1981Median year apartment built: 1991Household type by relationship:
Households: 24,835
Male householders: 4,859 (1,275 living alone ), Female householders: 5,066 (1,668 living alone )4,916 spouses (4,916 opposite-sex spouses ), 576 unmarried partners , (480 opposite-sex unmarried partners ), 7,419 children (6,780 natural , 159 adopted , 480 stepchildren ), 492 grandchildren , 243 brothers or sisters , 427 parents , 10 foster children , 387 other relatives , 321 non-relatives In group quarters: 114
Size of family households: 3,218 2-persons , 1,300 3-persons , 1,074 4-persons , 554 5-persons , 326 6-persons , 29 7-or-more-persons .
Size of nonfamily households: 3,187 1-person , 451 2-persons , 31 3-persons , 2 5-persons .
4,384 married couples with children. single-parent households (557 men , 654 women ).
87.0% of residents of Benbrook speak English at home. of residents speak Spanish at home (71% speak English very well , 16% speak English well , 12% speak English not well , 1% don't speak English at all ).of residents speak other Indo-European language at home (64% speak English very well , 18% speak English well , 16% speak English not well , 3% don't speak English at all ).of residents speak Asian or Pacific Island language at home (87% speak English very well , 13% speak English well ).of residents speak other language at home (97% speak English very well , 3% speak English well ).
Foreign born population: 1,339 (5.4%)of them are naturalized citizens )
Median number of rooms in houses and condos:
Median number of rooms in apartments
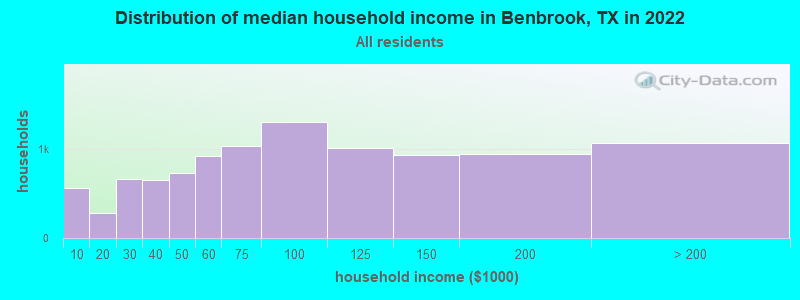
Benbrook, TX household income distribution 567 Less than $10,000287 $10,000 to $19,999665 $20,000 to $29,999649 $30,000 to $39,999734 $40,000 to $49,999927 $50,000 to $59,9991,037 $60,000 to $74,9991,308 $75,000 to $99,9991,018 $100,000 to $124,999939 $125,000 to $149,999951 $150,000 to $199,9991,066 $200,000 or more
Home value of owner - occupied houses in 2022 in Benbrook, TX 14 Less than $10,00026 $10,000 to $14,99980 $20,000 to $24,9996 $30,000 to $34,9995 $40,000 to $49,9993 $50,000 to $59,9997 $80,000 to $89,99923 $90,000 to $99,99996 $100,000 to $124,999141 $125,000 to $149,999332 $150,000 to $174,999435 $175,000 to $199,9991,296 $200,000 to $249,9991,296 $250,000 to $299,9991,293 $300,000 to $399,999748 $400,000 to $499,999446 $500,000 to $749,99990 $750,000 to $999,999104 $1,000,000 to $1,499,999151 $1,500,000 to $1,999,99949 $2,000,000 or moreRent paid by renters in 2022 in Benbrook, TX 32 $600 to $649107 $700 to $749213 $750 to $799137 $800 to $899301 $900 to $999848 $1,000 to $1,249706 $1,250 to $1,499707 $1,500 to $1,9997 $2,000 to $2,49983 No cash rent
Percentage of workers working in this county: 90.2%Number of people working at home: 1,691 (13.5% of all workers )
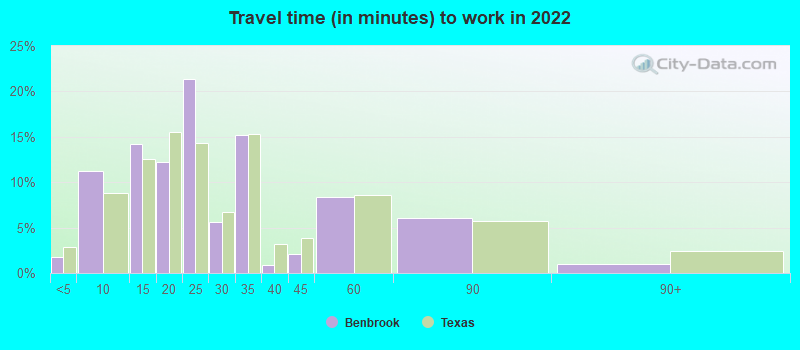
Travel time to work (commute)
Less than 5 minutes: 1595 to 9 minutes: 86510 to 14 minutes: 1,61215 to 19 minutes: 2,19420 to 24 minutes: 2,19625 to 29 minutes: 74630 to 34 minutes: 1,25935 to 39 minutes: 20640 to 44 minutes: 18145 to 59 minutes: 69260 to 89 minutes: 32590 or more minutes: 200
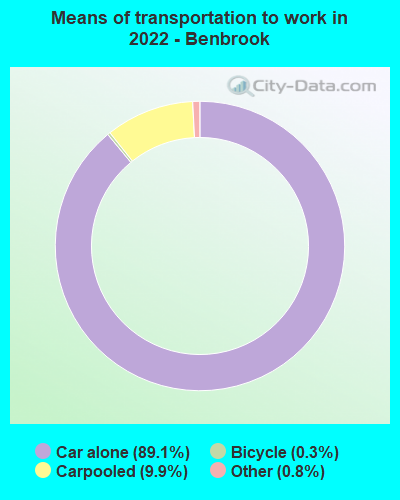
Means of transportation to work:
Drove a car alone: 4,095 (67.2%)Carpooled: 469 (7.7%)Taxi: 45 (0.7%)Bicycle: 8 (0.1%)Worked at home: 1,691 (27.7%)
Unemployment by race in 2022
Unemployment rate for White non-Hispanic residents 5.2% Males1.7% FemalesUnemployment rate for Black residents 8.1% Males1.3% FemalesUnemployment rate for Asian residents 33.7% MalesUnemployment rate for other race residents 18.6% FemalesUnemployment rate for two or more race residents 3.4% MalesUnemployment rate for Hispanic or Latino residents 0.8% Males2.8% Females
Year of entry for the foreign-born population in Benbrook, Texas
196 2010 or later 495 2000 to 2009 179 1990 to 1999 149 1980 to 1989 243 1970 to 1979 256 Before 1970
First ancestries reported:
English: 1,790 (13.4%)
German: 1,701 (12.7%)
American: 1,005 (7.5%)
Irish: 790 (5.9%)
European: 356 (2.7%)
Italian: 211 (1.6%)
Scotch-Irish: 166 (1.2%)
Welsh: 151 (1.1%)
Scottish: 119 (0.9%)
Norwegian: 102 (0.8%)
Polish: 85 (0.6%)
Russian: 74 (0.6%)
Dutch: 63 (0.5%)
British: 59 (0.4%)
Canadian: 34 (0.3%)
Trinidadian and Tobagonian: 31 (0.2%)
Swedish: 28 (0.2%)
Eastern European: 27 (0.2%)
Northern European: 25 (0.2%)
French: 23 (0.2%)
Pennsylvania German: 19 (0.1%)
Jamaican: 19 (0.1%)
Portuguese: 14 (0.1%)
Albanian: 12 (0.09%)
Yugoslavian: 10 (0.07%)
South African: 9 (0.07%)
Swiss: 9 (0.07%)
Hungarian: 9 (0.07%)
French Canadian: 9 (0.07%)
Danish: 8 (0.06%)
New Zealander: 8 (0.06%)
Ethiopian: 7 (0.05%)
Luxembourger: 7 (0.05%)
Nigerian: 5 (0.04%)
Scandinavian: 4 (0.03%)
Czechoslovakian: 2 (0.01%)
Lebanese: 2 (0.01%)
Slovak: 2 (0.01%) Most common places of birth for foreign-born residents (%): Mexico Benbrook:
48.2% (655)Texas:
48.4% (2,411,723)
El Salvador Benbrook:
6.4% (87)Texas:
4.5% (224,455)
Indonesia Benbrook:
5.8% (79)Texas:
0.2% (8,808)
England Benbrook:
4.1% (56)Texas:
0.4% (20,885)
Other Australian and New Zealand Subregion Benbrook:
3.2% (44)Texas:
0.0% (2,147)
Cuba Benbrook:
3.0% (41)Texas:
1.3% (62,978)
Trinidad and Tobago Benbrook:
2.8% (38)Texas:
0.2% (9,664)
Czechoslovakia (includes Czech Republic and Slovakia) Benbrook:
2.7% (37)Texas:
0.0% (2,130)
Philippines Benbrook:
2.5% (34)Texas:
2.1% (103,148)
Spain Benbrook:
2.2% (30)Texas:
0.2% (9,236)
China, excluding Hong Kong and Taiwan Benbrook:
1.8% (25)Texas:
2.3% (115,558)
Nepal Benbrook:
1.8% (25)Texas:
0.6% (27,480)
Canada Benbrook:
1.8% (24)Texas:
1.1% (55,371)
Place of birth for U.S.-born residents:
This state: 15,773Other state: 7,248Northeast: 740Midwest: 2,071South: 2,173West: 2,288 87.6% of Benbrook residents lived in the same house 1 years ago.
Out of people who lived in different houses, 34.9% lived in this county.
Out of people who lived in different counties, 51.5% lived in Texas.
Benbrook:
87.6%State average:
85.7%
Education attainment for males 25 years and older:
No schooling: 111Nursery to 4th grade: 15th and 6th grade: 1287th and 8th grade: 39th grade: 2110th grade: 6111th grade: 4512th grade, no diploma: 124High school graduate (or equivalency): 1,361Less than 1 year of college: 675Some college more than 1 year, no degree: 1,349Associate degree: 607Bachelor's degree: 2,229Master's degree: 921Professional school degree: 257Doctorate degree: 131
Education attainment for females 25 years and older:
No schooling: 71Nursery to 4th grade: 265th and 6th grade: 1177th and 8th grade: 09th grade: 3210th grade: 3111th grade: 4512th grade, no diploma: 88High school graduate (or equivalency): 1,916Less than 1 year of college: 812Some college more than 1 year, no degree: 1,420Associate degree: 473Bachelor's degree: 2,626Master's degree: 1,021Professional school degree: 238Doctorate degree: 103
Housing units in structures:
One, detached: 7,621One, attached: 359Two: 1903 or 4: 8305 to 9: 66110 to 19: 72020 to 49: 16850 or more: 519Mobile homes: 31Median worth of mobile homes: $198,018
Housing units lacking complete plumbing facilities in 2022: 0.4%Housing units lacking complete kitchen facilities in 2022: 2.0%House/condo owner moved in on average 12 years ago
Renter moved in on average 3 years ago
Private vs. public school enrollment:
Students in private schools in grades 1 to 8 (elementary and middle school): 390 Students in private schools in grades 9 to 12 (high school): 507 Students in private undergraduate colleges: 203