Bennington, NE (Nebraska) Houses and Residents
| Bennington: | $359,588 |
| Nebraska: | $232,400 |
Mean price in 2022:
Detached houses: $288,566
Here: $288,566 State: $274,677
Total population: 1,482 (Urban population: 0, Rural population: 935 (all nonfarm))
Houses: 1,044 (961 occupied: 670 owner occupied, 299 renter occupied)
| % of renters here: | 31% |
| State: | 34% |
Housing density: 2,706 houses/condos per square mile
Median price asked for vacant for-sale houses and condos in 2022 in this county: $104,036.
Median contract rent in 2022: $1,040 (lower quartile is $673, upper quartile is $1,573)
Median rent asked for vacant for-rent units in 2022: $1,689
Median gross rent in Bennington, NE in 2022: $1,200
Housing units in Bennington with a mortgage: 479 (65 second mortgage, 3 home equity loan, 56 both second mortgage and home equity loan)
Houses without a mortgage: 8
Median household income for houses/condos with a mortgage: $129,281
Median household income for apartments without a mortgage: $115,170
Median monthly housing costs: $1,565
Compare current foreclosures near Bennington, NE:
| Photo | Address | Area | Beds / Baths | Price | Details |
|---|---|---|---|---|---|

|
#1
Filmore Cir
Bennington, NE 68007
|
1,348 sq. feet
|
2 baths 3 beds |
show details | |

|
#2
N 153rd St
Bennington, NE 68007
|
3,560 sq. feet
|
2 baths 4 beds |
show details | |

|
#3
N 161st St
Bennington, NE 68007
|
2,071 sq. feet
|
2 baths 3 beds |
show details | |

|
#4
Willit St
Bennington, NE 68007
|
1,244 sq. feet
|
2 baths 3 beds |
show details | |

|
#5
Grebe St
Bennington, NE 68007
|
1,280 sq. feet
|
2 baths 3 beds |
show details | |

|
#6
Tucker St
Bennington, NE 68007
|
1,570 sq. feet
|
2 baths 3 beds |
show details | |

|
#7
Young St
Bennington, NE 68007
|
1,572 sq. feet
|
2 baths 3 beds |
show details | |

|
#8
N 164th St
Bennington, NE 68007
|
2,783 sq. feet
|
- baths 3 beds |
show details | |

|
#9
Kilpatrick Pkwy
Bennington, NE 68007
|
- sq. feet
|
- baths - beds |
show details | |

|
#10
Weber St
Bennington, NE 68007
|
- sq. feet
|
- baths - beds |
show details |
| Photo | Address | Area | Beds / Baths | Price | Details |
|---|---|---|---|---|---|

|
#11
N 146th St
Bennington, NE 68007
|
- sq. feet
|
- baths - beds |
show details | |

|
#12
S Allen St
Bennington, NE 68007
|
- sq. feet
|
- baths - beds |
show details | |

|
#13
Girard St
Bennington, NE 68007
|
- sq. feet
|
- baths - beds |
show details | |

|
#14
N 152nd Ave
Bennington, NE 68007
|
- sq. feet
|
- baths - beds |
show details | |

|
#15
Clay Plz, Apt 304
Bennington, NE 68007
|
- sq. feet
|
- baths - beds |
show details | |

|
#16
Bondesson St
Bennington, NE 68007
|
- sq. feet
|
- baths - beds |
show details | |

|
#17
N 172nd St
Bennington, NE 68007
|
- sq. feet
|
- baths - beds |
show details | |

|
#18
N 147th St
Bennington, NE 68007
|
- sq. feet
|
- baths - beds |
show details | |

|
#19
South 13th Court
Omaha, NE 68108
|
- sq. feet
|
- baths - beds |
$100,000
|
show details |

|
#20
Fort St
Omaha, NE 68104
|
1,453 sq. feet
|
1 baths 3 beds |
show details |
| Photo | Address | Area | Beds / Baths | Price | Details |
|---|---|---|---|---|---|

|
#21
Shamrock Cir
Omaha, NE 68118
|
2,242 sq. feet
|
3 baths 4 beds |
show details | |

|
#22
N 36th St
Omaha, NE 68112
|
- sq. feet
|
1 baths 2 beds |
show details | |

|
#23
N 211th St
Elkhorn, NE 68022
|
1,628 sq. feet
|
2 baths 3 beds |
show details | |

|
#24
7th Ave
Council Bluffs, IA 51501
|
864 sq. feet
|
2 baths 4 beds |
show details | |

|
#25
S 77th Ave
Omaha, NE 68127
|
- sq. feet
|
1 baths 3 beds |
show details | |

|
#26
5th Ave
Council Bluffs, IA 51501
|
1,167 sq. feet
|
2 baths 2 beds |
show details | |

|
#27
Ames Ave
Omaha, NE 68111
|
1,503 sq. feet
|
1 baths 3 beds |
show details | |

|
#28
S 165th St
Omaha, NE 68135
|
2,118 sq. feet
|
2 baths 4 beds |
show details | |

|
#29
S 191st Ave
Omaha, NE 68135
|
1,385 sq. feet
|
2 baths 3 beds |
show details | |

|
#30
Y Cir
Omaha, NE 68137
|
1,741 sq. feet
|
2 baths 3 beds |
show details |
| Photo | Address | Area | Beds / Baths | Price | Details |
|---|---|---|---|---|---|

|
#31
Spaulding St
Omaha, NE 68111
|
1,388 sq. feet
|
1 baths 3 beds |
show details | |

|
#32
Florence Blvd
Omaha, NE 68110
|
1,602 sq. feet
|
1 baths 2 beds |
show details | |

|
#33
S 152nd St
Omaha, NE 68137
|
1,273 sq. feet
|
1 baths 3 beds |
show details | |

|
#34
W Cir
Omaha, NE 68137
|
1,536 sq. feet
|
2 baths 3 beds |
show details | |

|
#35
N 23rd St
Omaha, NE 68110
|
1,777 sq. feet
|
2 baths 2 beds |
show details | |

|
#36
S 61st St
Omaha, NE 68106
|
1,554 sq. feet
|
1 baths 3 beds |
show details | |

|
#37
S 55th St
Omaha, NE 68106
|
927 sq. feet
|
1 baths 2 beds |
show details | |

|
#38
Weir St
Omaha, NE 68127
|
3,069 sq. feet
|
2 baths 3 beds |
show details | |

|
#39
N 34th St
Omaha, NE 68111
|
768 sq. feet
|
1 baths 2 beds |
show details | |

|
#40
Madison Cir
Omaha, NE 68137
|
2,045 sq. feet
|
2 baths 3 beds |
show details |
| Photo | Address | Area | Beds / Baths | Price | Details |
|---|---|---|---|---|---|

|
#41
S 172nd Ave
Omaha, NE 68135
|
2,862 sq. feet
|
2 baths 4 beds |
show details | |

|
#42
S 140th Ave
Omaha, NE 68137
|
1,346 sq. feet
|
1 baths 3 beds |
show details | |

|
#43
W St
Omaha, NE 68135
|
1,337 sq. feet
|
2 baths 3 beds |
show details | |

|
#44
S 169th St
Omaha, NE 68135
|
4,032 sq. feet
|
3 baths 1 beds |
show details | |

|
#45
Decatur St
Omaha, NE 68111
|
624 sq. feet
|
1 baths 1 beds |
show details | |

|
#46
V Cir
Omaha, NE 68135
|
2,000 sq. feet
|
2 baths 3 beds |
show details | |

|
#47
Edna St
Omaha, NE 68138
|
1,794 sq. feet
|
2 baths 3 beds |
show details | |

|
#48
Poppleton Ave
Omaha, NE 68106
|
1,732 sq. feet
|
1 baths 2 beds |
show details | |

|
#49
S 152nd St
Omaha, NE 68137
|
2,054 sq. feet
|
2 baths 3 beds |
show details | |

|
Check over 1 million property listings on Foreclosure.com!
|
browse all offers | |||

Latest news about housing in Bennington, NE collected exclusively by city-data.com from local newspapers, TV, and radio stations


Median year apartment built: 1993
Household type by relationship:
Households: 2,447- Male householders: 434 (140 living alone), Female householders: 511 (156 living alone)
522 spouses (522 opposite-sex spouses), 46 unmarried partners, (46 opposite-sex unmarried partners), 785 children (740 natural, 19 adopted, 26 stepchildren), 22 grandchildren, 18 brothers or sisters, 30 parents, 12 foster children, 21 other relatives, 31 non-relatives
- In group quarters: 12
Size of family households: 234 2-persons, 122 3-persons, 168 4-persons, 92 5-persons, 12 6-persons, 4 7-or-more-persons.
Size of nonfamily households: 314 1-person, 22 2-persons.
534 married couples with children.
126 single-parent households (13 men, 113 women).
99.0% of residents of Bennington speak English at home.
0.4% of residents speak Spanish at home (100% speak English very well).
0.9% of residents speak other Indo-European language at home (100% speak English very well).
Foreign born population: 25 (1.0%)
(40.0% of them are naturalized citizens)
| Here: | 7.1 |
| State: | 7.1 |
| Here: | 3.0 |
| State: | 4.2 |

- Bedrooms in owner-occupied houses and condos in Bennington, Nebraska
- 0no bedroom
- 171 bedroom
- 532 bedrooms
- 2563 bedrooms
- 2744 bedrooms
- 715+ bedrooms

- Bedrooms in renter-occupied apartments in Bennington, Nebraska
- 6no bedroom
- 1621 bedroom
- 902 bedrooms
- 413 bedrooms
- 04 bedrooms
- 05+ bedrooms

- Cars and other vehicles available in Bennington in owner-occupied houses/condos
- 4no vehicle
- 1031 vehicle
- 3822 vehicles
- 1423 vehicles
- 364 vehicles
- 35+ vehicles

- Cars and other vehicles available in Bennington in renter-occupied apartments
- 115no vehicle
- 1071 vehicle
- 372 vehicles
- 323 vehicles
- 84 vehicles
- 05+ vehicles

- Rooms in owner-occupied houses in Bennington, Nebraska
- 01 room
- 02 rooms
- 33 rooms
- 314 rooms
- 1035 rooms
- 1476 rooms
- 1087 rooms
- 1168 rooms
- 1639+ rooms

- Rooms in renter-occupied apartments in Bennington, Nebraska
- 61 room
- 732 rooms
- 1163 rooms
- 514 rooms
- 85 rooms
- 306 rooms
- 127 rooms
- 38 rooms
- 09+ rooms


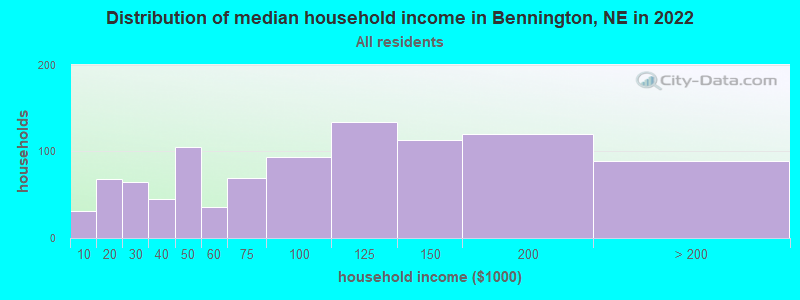
Bennington, NE household income distribution

- 31Less than $10,000
- 68$10,000 to $19,999
- 65$20,000 to $29,999
- 45$30,000 to $39,999
- 105$40,000 to $49,999
- 36$50,000 to $59,999
- 69$60,000 to $74,999
- 94$75,000 to $99,999
- 134$100,000 to $124,999
- 113$125,000 to $149,999
- 120$150,000 to $199,999
- 89$200,000 or more
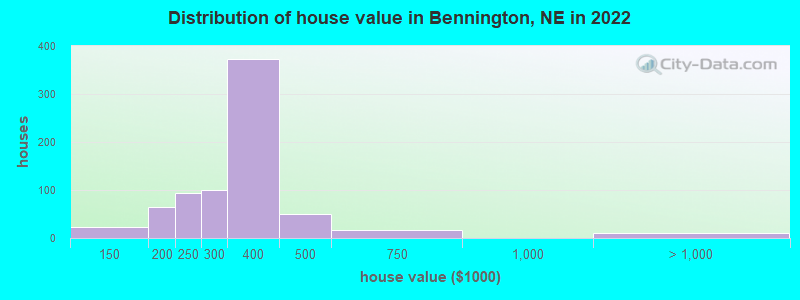
Home value of owner - occupied houses in 2022 in Bennington, NE
-
- 9$100,000 to $124,999
- 12$125,000 to $149,999
- 49$150,000 to $174,999
- 15$175,000 to $199,999
- 93$200,000 to $249,999
- 100$250,000 to $299,999
- 372$300,000 to $399,999
- 50$400,000 to $499,999
- 17$500,000 to $749,999
- 9$1,500,000 to $1,999,999
Rent paid by renters in 2022 in Bennington, NE
-
- 1$150 to $199
- 9$200 to $249
- 4$250 to $299
- 14$300 to $349
- 19$350 to $399
- 12$550 to $599
- 4$600 to $649
- 9$650 to $699
- 6$700 to $749
- 16$750 to $799
- 3$800 to $899
- 39$900 to $999
- 16$1,000 to $1,249
- 53$1,250 to $1,499
- 27$1,500 to $1,999
- 17$3,000 to $3,499
- 17$3,500 or more
- 9No cash rent


Percentage of workers working in this county: 87.4%
Number of people working at home: 147 (12.4% of all workers)
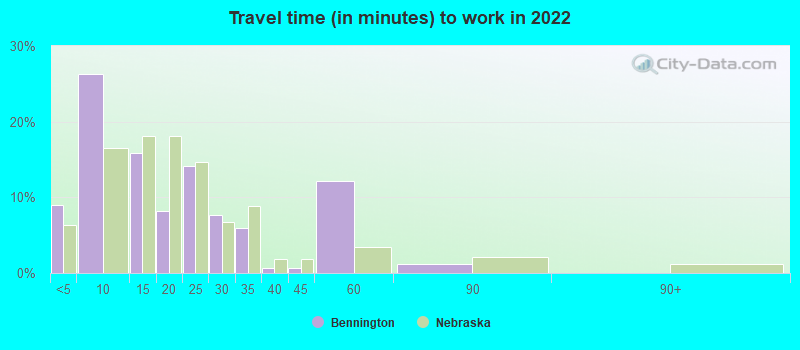
Travel time to work (commute)
- Less than 5 minutes: 57
- 5 to 9 minutes: 30
- 10 to 14 minutes: 66
- 15 to 19 minutes: 123
- 20 to 24 minutes: 267
- 25 to 29 minutes: 168
- 30 to 34 minutes: 246
- 35 to 39 minutes: 36
- 40 to 44 minutes: 1
- 45 to 59 minutes: 5
- 60 to 89 minutes: 9
- 90 or more minutes: 22
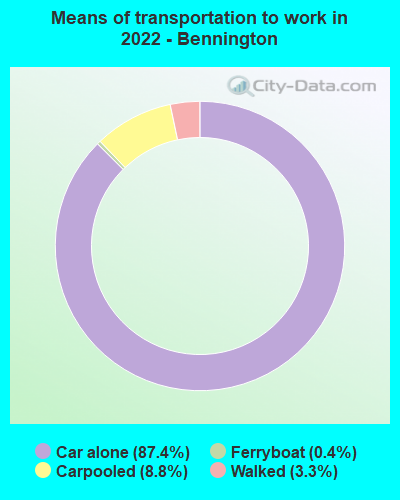
Means of transportation to work:
- Drove a car alone: 591 (72.1%)
- Carpooled: 64 (7.8%)
- Ferryboat: 3 (0.4%)
- Walked: 19 (2.3%)
- Worked at home: 147 (17.9%)

- Unemployment by race in 2022
- Unemployment rate for White non-Hispanic residents
- 0.3%Males
- 3.1%Females
- Unemployment rate for two or more race residents
- 100.0%Females

- Year of entry for the foreign-born population in Bennington, Nebraska
- 92010 or later
- 62000 to 2009
- 41990 to 1999
- 211980 to 1989
- 01970 to 1979
- 0Before 1970

First ancestries reported:
- German: 397 (41.9%)
- European: 76 (8.0%)
- English: 72 (7.6%)
- American: 62 (6.5%)
- Italian: 44 (4.6%)
- Irish: 42 (4.4%)
- Czech: 28 (3.0%)
- Norwegian: 19 (2.0%)
- Danish: 18 (1.9%)
- Polish: 17 (1.8%)
- Swedish: 11 (1.2%)
- French: 9 (0.9%)
- Pennsylvania German: 9 (0.9%)
- Scotch-Irish: 5 (0.5%)
- Bulgarian: 4 (0.4%)
- Icelander: 3 (0.3%)
- Portuguese: 3 (0.3%)
- African: 3 (0.3%)
- British: 2 (0.2%)
- French Canadian: 2 (0.2%)
Most common places of birth for foreign-born residents (%):
| Bennington: | 23.1% (6) |
| Nebraska: | 1.1% (1,612) |
| Bennington: | 23.1% (6) |
| Nebraska: | 7.2% (10,604) |
| Bennington: | 19.2% (5) |
| Nebraska: | 4.0% (5,832) |
| Bennington: | 11.5% (3) |
| Nebraska: | 1.6% (2,312) |
| Bennington: | 7.7% (2) |
| Nebraska: | 2.6% (3,808) |
| Bennington: | 7.7% (2) |
| Nebraska: | 31.7% (46,610) |
Place of birth for U.S.-born residents:
- This state: 1,797
- Other state: 609
- Northeast: 21
- Midwest: 371
- South: 75
- West: 142
95.7% of Bennington residents lived in the same house 1 years ago.
Out of people who lived in different houses, 47.2% lived in this county.
Out of people who lived in different counties, 89.2% lived in Nebraska.
| Bennington: | 95.7% |
| State average: | 87.4% |
Education attainment for males 25 years and older:
- No schooling: 2
- Nursery to 4th grade: 0
- 5th and 6th grade: 0
- 7th and 8th grade: 0
- 9th grade: 2
- 10th grade: 0
- 11th grade: 2
- 12th grade, no diploma: 17
- High school graduate (or equivalency): 167
- Less than 1 year of college: 71
- Some college more than 1 year, no degree: 131
- Associate degree: 70
- Bachelor's degree: 201
- Master's degree: 72
- Professional school degree: 8
- Doctorate degree: 11

Education attainment for females 25 years and older:
- No schooling: 0
- Nursery to 4th grade: 0
- 5th and 6th grade: 0
- 7th and 8th grade: 0
- 9th grade: 0
- 10th grade: 24
- 11th grade: 5
- 12th grade, no diploma: 30
- High school graduate (or equivalency): 216
- Less than 1 year of college: 44
- Some college more than 1 year, no degree: 105
- Associate degree: 92
- Bachelor's degree: 221
- Master's degree: 101
- Professional school degree: 20
- Doctorate degree: 6


Housing units in structures:
- One, detached: 696
- One, attached: 28
- 3 or 4: 96
- 5 to 9: 58
- 20 to 49: 63
- 50 or more: 101
Housing units lacking complete kitchen facilities in 2022: 10.7%
House/condo owner moved in on average 9 years ago
Renter moved in on average 5 years ago

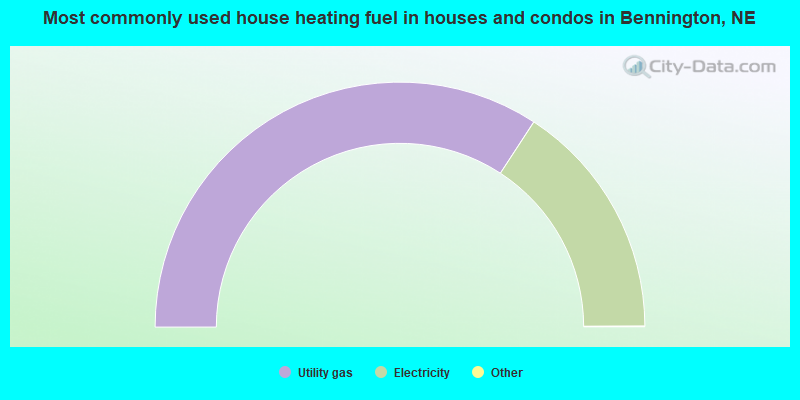
- 68.5%Utility gas
- 31.5%Electricity
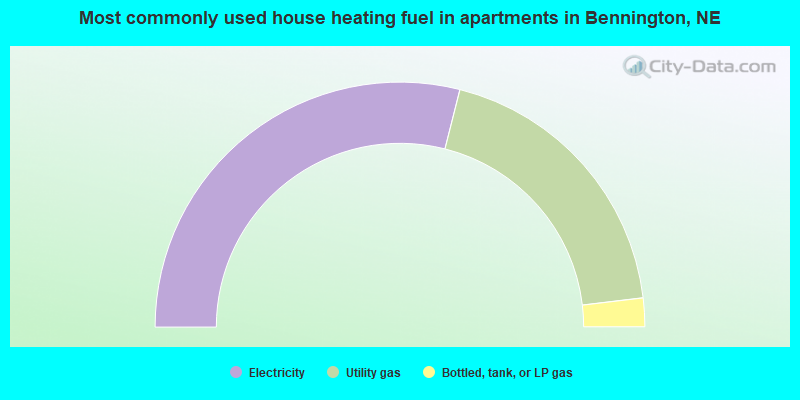
- 57.9%Electricity
- 38.3%Utility gas
- 3.8%Bottled, tank, or LP gas
Private vs. public school enrollment:
| Here: | 2.8% |
| Nebraska: | 14.1% |
| Here: | 8.5% |
| Nebraska: | 12.5% |
| Here: | 20.0% |
| Nebraska: | 18.0% |


