Bensley, VA (Virginia) Houses and Residents
| Bensley: | $196,638 |
| Virginia: | $365,700 |
Total population: 5,819 (Urban population: 5,450, Rural population: 0)
Houses: 2,504 (2,352 occupied: 922 owner occupied, 1,433 renter occupied)
| % of renters here: | 61% |
| State: | 33% |
Housing density: 867 houses/condos per square mile
Median price asked for vacant for-sale houses and condos in 2022: $197,368.
Median contract rent in 2022: $1,025 (lower quartile is $836, upper quartile is $1,219)
Median rent asked for vacant for-rent units in 2022: $3,132
Median gross rent in Bensley, VA in 2022: $1,157
Housing units in Bensley with a mortgage: 547 (133 second mortgage, 0 home equity loan, 56 both second mortgage and home equity loan)
Houses without a mortgage: 4
Median household income for houses/condos with a mortgage: $62,999
Median household income for apartments without a mortgage: $51,349
Median monthly housing costs: $1,066
Compare current foreclosures near Bensley, VA:
| Photo | Address | Area | Beds / Baths | Price | Details |
|---|---|---|---|---|---|

|
#1
Halifax St
Petersburg, VA 23803
|
1,536 sq. feet
|
1 baths 2 beds |
$179,900
|
show details |

|
#2
Wales Dr
Highland Springs, VA 23075
|
4,488 sq. feet
|
3 baths 6 beds |
show details | |

|
#3
W Clay St
Richmond, VA 23220
|
3,175 sq. feet
|
3 baths 8 beds |
show details | |

|
#4
Black Isle Way
Chesterfield, VA 23838
|
3,270 sq. feet
|
3 baths 5 beds |
show details | |

|
#5
Alderwood Turn
Chester, VA 23831
|
1,886 sq. feet
|
2 baths 3 beds |
show details | |

|
#6
Petersburg St
Chester, VA 23831
|
2,210 sq. feet
|
2 baths 3 beds |
show details | |

|
#7
Bridgeton Rd
Richmond, VA 23234
|
1,379 sq. feet
|
1 baths 3 beds |
show details | |

|
#8
Gorham Ct
Midlothian, VA 23114
|
2,604 sq. feet
|
2 baths 4 beds |
show details | |

|
#9
Hopkins Rd
Richmond, VA 23234
|
1,876 sq. feet
|
2 baths 3 beds |
show details | |

|
#10
Groundhog Dr
Richmond, VA 23235
|
1,505 sq. feet
|
2 baths 3 beds |
show details |
| Photo | Address | Area | Beds / Baths | Price | Details |
|---|---|---|---|---|---|

|
#11
Auger Pl
Midlothian, VA 23113
|
4,102 sq. feet
|
3 baths 4 beds |
show details | |

|
#12
Jarrett Ct
Petersburg, VA 23803
|
1,327 sq. feet
|
1 baths 4 beds |
show details | |

|
#13
Courthouse Rd
Chesterfield, VA 23832
|
1,512 sq. feet
|
2 baths 3 beds |
show details | |

|
#14
N Cottonwood Rd
Richmond, VA 23236
|
1,486 sq. feet
|
1 baths 3 beds |
show details | |

|
#15
Rockland Rd
Richmond, VA 23225
|
1,794 sq. feet
|
1 baths 3 beds |
show details | |

|
#16
Blue Heron Cir
Chesterfield, VA 23838
|
3,726 sq. feet
|
3 baths 4 beds |
show details | |

|
#17
Clintwood Rd
Midlothian, VA 23112
|
1,431 sq. feet
|
2 baths 4 beds |
show details | |

|
#18
Olde Coach Dr
Midlothian, VA 23113
|
1,923 sq. feet
|
2 baths 4 beds |
show details | |

|
#19
Stanley Dr
Richmond, VA 23234
|
1,416 sq. feet
|
1 baths 3 beds |
show details | |

|
#20
Heritage Hill Dr
Richmond, VA 23238
|
1,280 sq. feet
|
1 baths 3 beds |
show details |
| Photo | Address | Area | Beds / Baths | Price | Details |
|---|---|---|---|---|---|

|
#21
N Stevens Hollow Dr
Chesterfield, VA 23832
|
1,524 sq. feet
|
2 baths 4 beds |
show details | |

|
#22
Brinley Meadows Dr
Richmond, VA 23231
|
- sq. feet
|
3 baths 4 beds |
show details | |

|
#23
Whitebirch Dr
Chester, VA 23831
|
1,620 sq. feet
|
1 baths 3 beds |
show details | |

|
#24
Highgate Hill Dr
Chesterfield, VA 23832
|
- sq. feet
|
2 baths 4 beds |
show details | |

|
#25
Watson Ave
Richmond, VA 23234
|
1,382 sq. feet
|
1 baths 2 beds |
show details | |

|
#26
Donegal Dr
Chesterfield, VA 23832
|
1,896 sq. feet
|
2 baths 4 beds |
show details | |

|
#27
Wildercroft Rd
Midlothian, VA 23113
|
2,258 sq. feet
|
2 baths 4 beds |
show details | |

|
#28
E Washington St
Petersburg, VA 23803
|
- sq. feet
|
- baths - beds |
$177,350
|
show details |

|
#29
Angarde Dr
Chester, VA 23831
|
1,288 sq. feet
|
2 baths 3 beds |
show details | |

|
#30
Mormac Rd
Richmond, VA 23229
|
2,228 sq. feet
|
2 baths 4 beds |
show details |
| Photo | Address | Area | Beds / Baths | Price | Details |
|---|---|---|---|---|---|

|
#31
Drewry St
Richmond, VA 23224
|
1,386 sq. feet
|
2 baths 2 beds |
show details | |

|
#32
Chateaugay Ln
Midlothian, VA 23112
|
1,818 sq. feet
|
2 baths 3 beds |
show details | |

|
#33
Arbor Meadows Dr
Chester, VA 23831
|
2,374 sq. feet
|
2 baths 4 beds |
show details | |

|
#34
Rickey Ct
Glen Allen, VA 23060
|
1,968 sq. feet
|
2 baths 4 beds |
show details | |

|
#35
Fitzhugh Ave
Richmond, VA 23230
|
1,214 sq. feet
|
1 baths 2 beds |
show details | |

|
#36
Talon Ln
Richmond, VA 23237
|
1,282 sq. feet
|
2 baths 3 beds |
show details | |

|
#37
Wainwright Dr
Richmond, VA 23225
|
1,565 sq. feet
|
3 baths 4 beds |
show details | |

|
#38
Buffin Rd
Richmond, VA 23231
|
1,845 sq. feet
|
2 baths 3 beds |
show details | |

|
#39
Heather Ridge Dr
Richmond, VA 23231
|
2,548 sq. feet
|
2 baths 5 beds |
show details | |

|
#40
Overbrook Rd
Richmond, VA 23222
|
1,536 sq. feet
|
2 baths 5 beds |
show details |
| Photo | Address | Area | Beds / Baths | Price | Details |
|---|---|---|---|---|---|

|
#41
Affirmed Dr
Midlothian, VA 23112
|
1,512 sq. feet
|
2 baths 4 beds |
show details | |

|
#42
Barnwood Dr
Richmond, VA 23234
|
2,992 sq. feet
|
3 baths 5 beds |
show details | |

|
#43
Pleasant St
Highland Springs, VA 23075
|
1,102 sq. feet
|
1 baths 2 beds |
show details | |

|
#44
Lyndhurst Ct
Chester, VA 23831
|
2,682 sq. feet
|
3 baths 4 beds |
show details | |

|
#45
Stoney Creek Pkwy
Chester, VA 23831
|
2,096 sq. feet
|
2 baths 3 beds |
show details | |

|
#46
Woodsong Dr
Midlothian, VA 23112
|
1,224 sq. feet
|
2 baths 3 beds |
show details | |

|
#47
Knobbly Ct
Chester, VA 23831
|
1,920 sq. feet
|
2 baths 3 beds |
show details | |

|
#48
Colonnade Dr
Colonial Heights, VA 23834
|
1,638 sq. feet
|
2 baths 3 beds |
show details | |

|
#49
Waters Mill Cir
Richmond, VA 23235
|
1,720 sq. feet
|
2 baths 3 beds |
show details | |

|
Check over 1 million property listings on Foreclosure.com!
|
browse all offers | |||


 | Moving to Richmond with an active dog (1 reply) |

Median year apartment built: 1968
Household type by relationship:
Households: 6,236- Male householders: 953 (256 living alone), Female householders: 1,372 (281 living alone)
601 spouses (594 opposite-sex spouses), 365 unmarried partners, (360 opposite-sex unmarried partners), 1,898 children (1,864 natural, 31 adopted, 3 stepchildren), 243 grandchildren, 87 brothers or sisters, 68 parents, 34 foster children, 342 other relatives, 267 non-relatives
Size of family households: 507 2-persons, 619 3-persons, 269 4-persons, 132 5-persons, 54 6-persons, 6 7-or-more-persons.
Size of nonfamily households: 531 1-person, 192 2-persons, 10 4-persons, 13 5-persons.
355 married couples with children.
939 single-parent households (245 men, 694 women).
59.6% of residents of Bensley speak English at home.
32.7% of residents speak Spanish at home (42% speak English very well, 28% speak English well, 16% speak English not well, 13% don't speak English at all).
0.1% of residents speak other Indo-European language at home (100% speak English very well).
1.2% of residents speak Asian or Pacific Island language at home (30% speak English very well, 12% speak English well, 58% speak English not well).
Foreign born population: 1,642 (26.3%)
(17.8% of them are naturalized citizens)
| Here: | 6.1 |
| State: | 7.0 |
| Here: | 3.8 |
| State: | 4.3 |

- Bedrooms in owner-occupied houses and condos in Bensley, Virginia
- 0no bedroom
- 21 bedroom
- 1532 bedrooms
- 5043 bedrooms
- 2354 bedrooms
- 295+ bedrooms

- Bedrooms in renter-occupied apartments in Bensley, Virginia
- 26no bedroom
- 2571 bedroom
- 7942 bedrooms
- 2063 bedrooms
- 1514 bedrooms
- 05+ bedrooms

- Cars and other vehicles available in Bensley in owner-occupied houses/condos
- 10no vehicle
- 2141 vehicle
- 3302 vehicles
- 2553 vehicles
- 884 vehicles
- 265+ vehicles

- Cars and other vehicles available in Bensley in renter-occupied apartments
- 153no vehicle
- 8161 vehicle
- 3992 vehicles
- 203 vehicles
- 464 vehicles
- 05+ vehicles

- Rooms in owner-occupied houses in Bensley, Virginia
- 01 room
- 02 rooms
- 513 rooms
- 1054 rooms
- 1055 rooms
- 2946 rooms
- 2067 rooms
- 878 rooms
- 749+ rooms

- Rooms in renter-occupied apartments in Bensley, Virginia
- 261 room
- 1672 rooms
- 2183 rooms
- 5754 rooms
- 1705 rooms
- 1776 rooms
- 597 rooms
- 248 rooms
- 199+ rooms


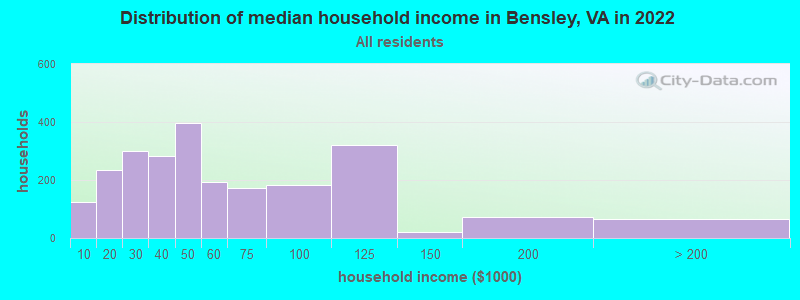
Bensley, VA household income distribution

- 123Less than $10,000
- 234$10,000 to $19,999
- 300$20,000 to $29,999
- 282$30,000 to $39,999
- 398$40,000 to $49,999
- 194$50,000 to $59,999
- 173$60,000 to $74,999
- 182$75,000 to $99,999
- 320$100,000 to $124,999
- 19$125,000 to $149,999
- 72$150,000 to $199,999
- 66$200,000 or more
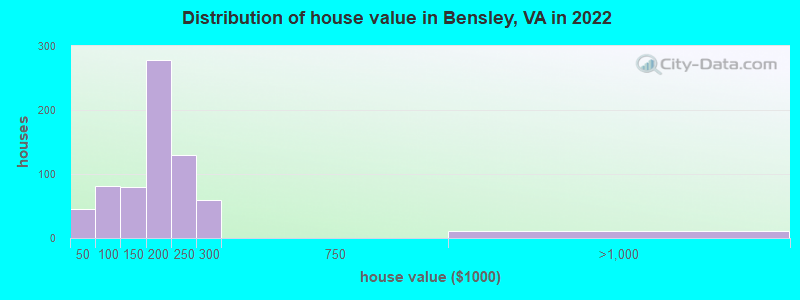
Home value of owner - occupied houses in 2022 in Bensley, VA
-
- 9Less than $10,000
- 22$10,000 to $14,999
- 13$25,000 to $29,999
- 24$50,000 to $59,999
- 4$60,000 to $69,999
- 39$70,000 to $79,999
- 13$80,000 to $89,999
- 23$100,000 to $124,999
- 55$125,000 to $149,999
- 127$150,000 to $174,999
- 150$175,000 to $199,999
- 129$200,000 to $249,999
- 59$250,000 to $299,999
- 10$750,000 to $999,999
Rent paid by renters in 2022 in Bensley, VA
-
- 3$350 to $399
- 20$450 to $499
- 40$500 to $549
- 16$550 to $599
- 23$600 to $649
- 22$650 to $699
- 67$700 to $749
- 101$750 to $799
- 253$800 to $899
- 176$900 to $999
- 469$1,000 to $1,249
- 28$1,250 to $1,499
- 128$1,500 to $1,999
- 4No cash rent


Percentage of workers working in this county: 53.3%
Number of people working at home: 264 (8.6% of all workers)
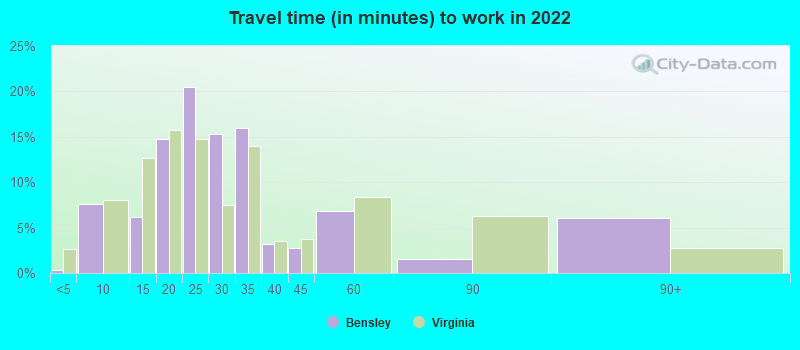
Travel time to work (commute)
- Less than 5 minutes: 45
- 5 to 9 minutes: 281
- 10 to 14 minutes: 150
- 15 to 19 minutes: 553
- 20 to 24 minutes: 816
- 25 to 29 minutes: 170
- 30 to 34 minutes: 440
- 35 to 39 minutes: 25
- 40 to 44 minutes: 24
- 45 to 59 minutes: 80
- 60 to 89 minutes: 43
- 90 or more minutes: 111
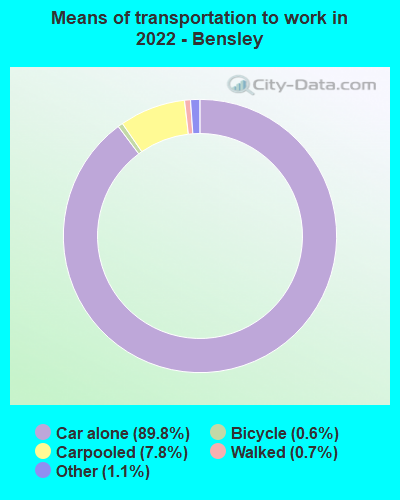
Means of transportation to work:
- Drove a car alone: 2,298 (76.0%)
- Carpooled: 229 (7.6%)
- Taxi: 23 (0.8%)
- Bicycle: 15 (0.5%)
- Walked: 39 (1.3%)
- Worked at home: 264 (8.7%)

- Unemployment by race in 2022
- Unemployment rate for White non-Hispanic residents
- 4.2%Males
- 10.8%Females
- Unemployment rate for Black residents
- 4.4%Males
- 20.9%Females
- Unemployment rate for other race residents
- 2.1%Males
- 4.6%Females
- Unemployment rate for Hispanic or Latino residents
- 4.3%Males
- 4.1%Females

- Year of entry for the foreign-born population in Bensley, Virginia
- 6102010 or later
- 6692000 to 2009
- 2131990 to 1999
- 1391980 to 1989
- 671970 to 1979
- 42Before 1970

First ancestries reported:
- American: 251 (6.3%)
- English: 96 (2.4%)
- African: 94 (2.4%)
- Irish: 88 (2.2%)
- Italian: 64 (1.6%)
- British: 33 (0.8%)
- German: 32 (0.8%)
- Ukrainian: 18 (0.5%)
- European: 16 (0.4%)
- Lebanese: 5 (0.1%)
- West Indian: 5 (0.1%)
- Dutch: 4 (0.1%)
- Scottish: 4 (0.1%)
- Swiss: 4 (0.1%)
Most common places of birth for foreign-born residents (%):
| Bensley: | 38.8% (616) |
| Virginia: | 9.9% (107,534) |
| Bensley: | 21.5% (341) |
| Virginia: | 3.3% (35,938) |
| Bensley: | 16.8% (266) |
| Virginia: | 5.3% (57,498) |
| Bensley: | 6.5% (103) |
| Virginia: | 3.0% (32,892) |
| Bensley: | 2.0% (31) |
| Virginia: | 0.6% (6,916) |
Place of birth for U.S.-born residents:
- This state: 3,233
- Other state: 1,276
- Northeast: 584
- Midwest: 68
- South: 470
- West: 156
79.0% of Bensley residents lived in the same house 1 years ago.
Out of people who lived in different houses, 29.5% lived in this county.
Out of people who lived in different counties, 85.3% lived in Virginia.
| Bensley: | 79.0% |
| State average: | 86.6% |
Education attainment for males 25 years and older:
- No schooling: 162
- Nursery to 4th grade: 139
- 5th and 6th grade: 21
- 7th and 8th grade: 68
- 9th grade: 59
- 10th grade: 50
- 11th grade: 48
- 12th grade, no diploma: 11
- High school graduate (or equivalency): 720
- Less than 1 year of college: 84
- Some college more than 1 year, no degree: 136
- Associate degree: 95
- Bachelor's degree: 154
- Master's degree: 28
- Professional school degree: 0
- Doctorate degree: 17

Education attainment for females 25 years and older:
- No schooling: 55
- Nursery to 4th grade: 14
- 5th and 6th grade: 125
- 7th and 8th grade: 44
- 9th grade: 26
- 10th grade: 73
- 11th grade: 69
- 12th grade, no diploma: 68
- High school graduate (or equivalency): 628
- Less than 1 year of college: 179
- Some college more than 1 year, no degree: 311
- Associate degree: 160
- Bachelor's degree: 245
- Master's degree: 42
- Professional school degree: 10
- Doctorate degree: 0


Housing units in structures:
- One, detached: 1,220
- One, attached: 78
- Two: 99
- 3 or 4: 485
- 5 to 9: 329
- 10 to 19: 187
- 20 to 49: 9
- 50 or more: 40
- Mobile homes: 54
Housing units lacking complete kitchen facilities in 2022: 0.1%
House/condo owner moved in on average 16 years ago
Renter moved in on average 2 years ago

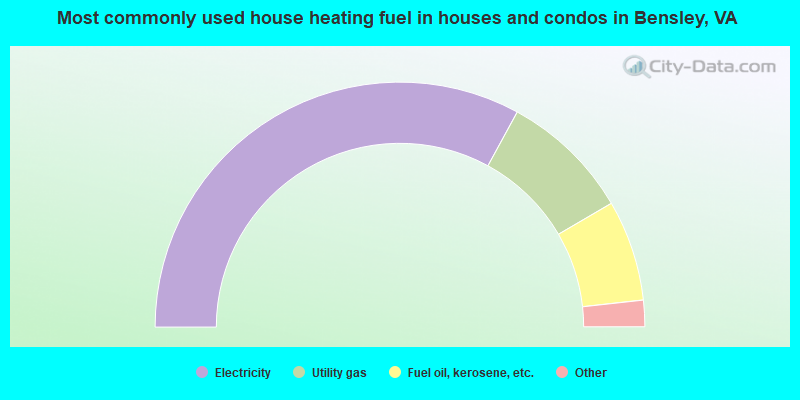
- 66.1%Electricity
- 17.3%Utility gas
- 13.4%Fuel oil, kerosene, etc.
- 1.5%Bottled, tank, or LP gas
- 1.4%No fuel used
- 0.5%Wood
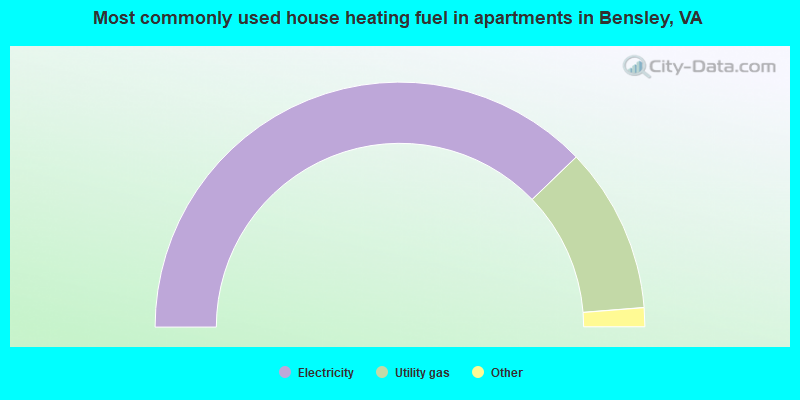
- 75.6%Electricity
- 21.9%Utility gas
- 2.0%Fuel oil, kerosene, etc.
- 0.5%No fuel used
Private vs. public school enrollment:
| Here: | 0.0% |
| Virginia: | 13.2% |
| Here: | 0.0% |
| Virginia: | 10.2% |
| Here: | 6.2% |
| Virginia: | 18.7% |


