Benton, TN (Tennessee) Houses and Residents
| Benton: | $192,034 |
| Tennessee: | $284,800 |
Mean price in 2022:
Detached houses: $239,163
Here: $239,163 State: $374,382 Mobile homes: $93,934
Here: $93,934 State: $101,421
Total population: 1,309 (Urban population: 0, Rural population: 1,109 (14 farm, 1,095 nonfarm))
Houses: 724 (629 occupied: 359 owner occupied, 281 renter occupied)
| % of renters here: | 44% |
| State: | 33% |
Housing density: 319 houses/condos per square mile
Median price asked for vacant for-sale houses and condos in 2022 in this county: $170,315.
Median contract rent in 2022: $451 (lower quartile is $316, upper quartile is $551)
Median rent asked for vacant for-rent units in 2022: $633
Median gross rent in Benton, TN in 2022: $597
Housing units in Benton with a mortgage: 160 (4 second mortgage, 0 home equity loan, 4 both second mortgage and home equity loan)
Houses without a mortgage: 0
Median household income for houses/condos with a mortgage: $92,203
Median household income for apartments without a mortgage: $51,453
Median monthly housing costs: $622
Compare current foreclosures in Benton, TN:
| Photo | Address | Area | Beds / Baths | Price | Details |
|---|---|---|---|---|---|

|
#1
Patty Rd
Benton, TN 37307
|
1,716 sq. feet
|
1 baths - beds |
show details | |

|
#2
Burgess Dr
Benton, TN 37307
|
1,472 sq. feet
|
2 baths - beds |
show details | |

|
#3
Smyrna Rd
Benton, TN 37307
|
1,040 sq. feet
|
1 baths - beds |
show details | |

|
#4
Spring St
Benton, TN 37307
|
1,152 sq. feet
|
1 baths - beds |
show details | |

|
#5
Savannah Cv
Benton, TN 37307
|
2,304 sq. feet
|
2 baths - beds |
show details | |

|
#6
Parksville Rd
Benton, TN 37307
|
916 sq. feet
|
1 baths - beds |
show details | |

|
#7
Hart Ln
Benton, TN 37307
|
608 sq. feet
|
1 baths - beds |
show details | |

|
#8
Burgess Dr
Benton, TN 37307
|
1,472 sq. feet
|
2 baths - beds |
show details | |

|
#9
Burgess Dr
Benton, TN 37307
|
1,328 sq. feet
|
2 baths - beds |
show details | |

|
#10
Hunt Ln
Benton, TN 37307
|
1,144 sq. feet
|
1 baths - beds |
show details |
| Photo | Address | Area | Beds / Baths | Price | Details |
|---|---|---|---|---|---|

|
#11
Mountain View Rd
Benton, TN 37307
|
1,152 sq. feet
|
1 baths - beds |
show details | |

|
#12
Locke Ln
Benton, TN 37307
|
1,792 sq. feet
|
4 baths - beds |
show details | |

|
#13
Grove Rd
Benton, TN 37307
|
1,960 sq. feet
|
2 baths - beds |
show details | |

|
#14
Crowe Hill Cir
Benton, TN 37307
|
1,056 sq. feet
|
1 baths - beds |
show details | |

|
#15
Perimeter Rd
Benton, TN 37307
|
2,236 sq. feet
|
1 baths - beds |
show details | |

|
#16
Mcclure Rd
Benton, TN 37307
|
- sq. feet
|
- baths - beds |
show details | |

|
#17
Lynn Dr
Benton, TN 37307
|
- sq. feet
|
- baths - beds |
show details | |

|
#18
Benton Station Rd
Benton, TN 37307
|
- sq. feet
|
- baths - beds |
show details | |

|
#19
Bailey Rd
Benton, TN 37307
|
240 sq. feet
|
- baths - beds |
show details | |

|
#20
Clemmer Ferry Rd
Benton, TN 37307
|
- sq. feet
|
- baths - beds |
show details |
| Photo | Address | Area | Beds / Baths | Price | Details |
|---|---|---|---|---|---|

|
#21
Harmony Ln
Benton, TN 37307
|
1,664 sq. feet
|
- baths - beds |
show details | |

|
#22
Paris Branch Rd
Benton, TN 37307
|
980 sq. feet
|
- baths - beds |
show details | |

|
#23
Airport Rd
Benton, TN 37307
|
- sq. feet
|
- baths - beds |
show details | |

|
#24
Spurling Dr
Benton, TN 37307
|
1,456 sq. feet
|
- baths - beds |
show details | |

|
#25
Hunt Ln
Benton, TN 37307
|
1,280 sq. feet
|
- baths - beds |
show details | |

|
#26
Lois Ln Apt A
Benton, TN 37307
|
- sq. feet
|
- baths - beds |
show details | |

|
#27
Welcome Valley Rd Apt C
Benton, TN 37307
|
- sq. feet
|
- baths - beds |
show details | |

|
#28
Withrow Ln
Benton, TN 37307
|
- sq. feet
|
- baths - beds |
show details | |

|
#29
Stone Rd # A
Benton, TN 37307
|
- sq. feet
|
- baths - beds |
show details | |

|
#30
Camp Agape Rd
Benton, TN 37307
|
2,072 sq. feet
|
- baths - beds |
show details |
| Photo | Address | Area | Beds / Baths | Price | Details |
|---|---|---|---|---|---|

|
#31
Benton Station Rd
Benton, TN 37307
|
- sq. feet
|
- baths - beds |
show details | |

|
#32
Park Cir
Benton, TN 37307
|
- sq. feet
|
- baths - beds |
show details | |

|
#33
Stone Rd
Benton, TN 37307
|
- sq. feet
|
- baths - beds |
show details | |

|
Check over 1 million property listings on Foreclosure.com!
|
browse all offers | |||

Latest news about housing in Benton, TN collected exclusively by city-data.com from local newspapers, TV, and radio stations

 | Looking for house/wooded acreage in NW Tennessee (18 replies) |
| Vonore Tn versus Cosby Tn (5 replies) |
| Ocoee, Collegedale, and Maryville (10 replies) |
| Buyer agent recommendations? (0 replies) |
| Moving to memphis working in presidents island (30 replies) |
| Great city neighborhood, with an easy Brentwood commute? (4 replies) |

Median year apartment built: 1990
Household type by relationship:
Households: 1,613- Male householders: 195 (64 living alone), Female householders: 426 (147 living alone)
266 spouses (262 opposite-sex spouses), 7 unmarried partners, (7 opposite-sex unmarried partners), 363 children (334 natural, 15 adopted, 14 stepchildren), 82 grandchildren, 0 brothers or sisters, 9 parents, 13 foster children, 81 other relatives, 28 non-relatives
- In group quarters: 138
Size of family households: 199 2-persons, 86 3-persons, 103 4-persons, 22 5-persons, 4 6-persons.
Size of nonfamily households: 215 1-person, 3 2-persons, 3 3-persons.
139 married couples with children.
90 single-parent households (16 men, 74 women).
98.6% of residents of Benton speak English at home.
0.4% of residents speak Spanish at home (100% speak English very well).
0.3% of residents speak other Indo-European language at home (100% speak English very well).
0.3% of residents speak other language at home (100% speak English very well).
Foreign born population: 9 (0.6%)
(55.6% of them are naturalized citizens)
| Here: | 5.3 |
| State: | 6.5 |
| Here: | 4.0 |
| State: | 4.4 |

- Bedrooms in owner-occupied houses and condos in Benton, Tennessee
- 0no bedroom
- 121 bedroom
- 1002 bedrooms
- 2343 bedrooms
- 154 bedrooms
- 05+ bedrooms

- Bedrooms in renter-occupied apartments in Benton, Tennessee
- 0no bedroom
- 611 bedroom
- 1162 bedrooms
- 1043 bedrooms
- 04 bedrooms
- 05+ bedrooms

- Cars and other vehicles available in Benton in owner-occupied houses/condos
- 0no vehicle
- 601 vehicle
- 1742 vehicles
- 843 vehicles
- 344 vehicles
- 85+ vehicles

- Cars and other vehicles available in Benton in renter-occupied apartments
- 65no vehicle
- 1491 vehicle
- 632 vehicles
- 03 vehicles
- 44 vehicles
- 05+ vehicles

- Rooms in owner-occupied houses in Benton, Tennessee
- 01 room
- 32 rooms
- 123 rooms
- 544 rooms
- 1365 rooms
- 706 rooms
- 397 rooms
- 238 rooms
- 239+ rooms

- Rooms in renter-occupied apartments in Benton, Tennessee
- 01 room
- 212 rooms
- 373 rooms
- 1334 rooms
- 435 rooms
- 386 rooms
- 07 rooms
- 38 rooms
- 69+ rooms


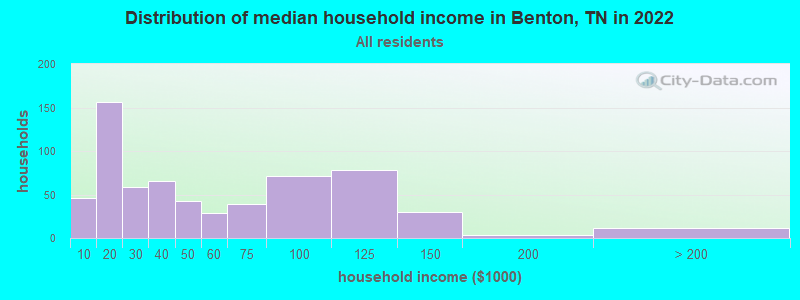
Benton, TN household income distribution

- 46Less than $10,000
- 156$10,000 to $19,999
- 59$20,000 to $29,999
- 65$30,000 to $39,999
- 42$40,000 to $49,999
- 29$50,000 to $59,999
- 39$60,000 to $74,999
- 71$75,000 to $99,999
- 78$100,000 to $124,999
- 30$125,000 to $149,999
- 4$150,000 to $199,999
- 12$200,000 or more
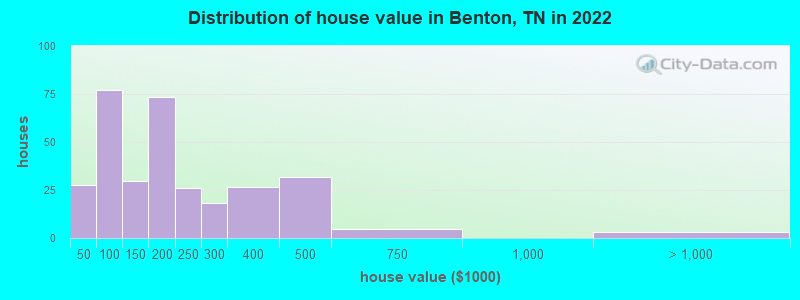
Home value of owner - occupied houses in 2022 in Benton, TN
-
- 3Less than $10,000
- 9$20,000 to $24,999
- 3$35,000 to $39,999
- 11$40,000 to $49,999
- 7$50,000 to $59,999
- 19$60,000 to $69,999
- 14$70,000 to $79,999
- 3$80,000 to $89,999
- 20$90,000 to $99,999
- 15$100,000 to $124,999
- 13$125,000 to $149,999
- 43$150,000 to $174,999
- 30$175,000 to $199,999
- 25$200,000 to $249,999
- 18$250,000 to $299,999
- 26$300,000 to $399,999
- 31$400,000 to $499,999
- 4$500,000 to $749,999
- 2$1,000,000 to $1,499,999
Rent paid by renters in 2022 in Benton, TN
-
- 25$150 to $199
- 25$200 to $249
- 5$250 to $299
- 59$300 to $349
- 33$400 to $449
- 27$450 to $499
- 27$500 to $549
- 11$550 to $599
- 19$600 to $649
- 5$1,000 to $1,249
- 36No cash rent


Percentage of workers working in this county: 30.4%
Number of people working at home: 37 (6.6% of all workers)
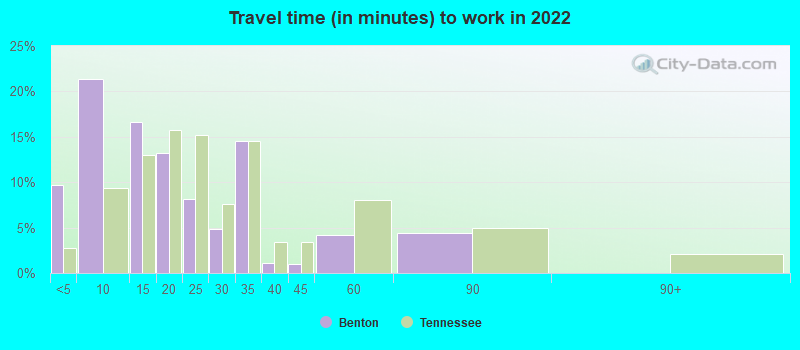
Travel time to work (commute)
- Less than 5 minutes: 22
- 5 to 9 minutes: 32
- 10 to 14 minutes: 74
- 15 to 19 minutes: 23
- 20 to 24 minutes: 75
- 25 to 29 minutes: 57
- 30 to 34 minutes: 124
- 35 to 39 minutes: 0
- 40 to 44 minutes: 9
- 45 to 59 minutes: 41
- 60 to 89 minutes: 52
- 90 or more minutes: 0
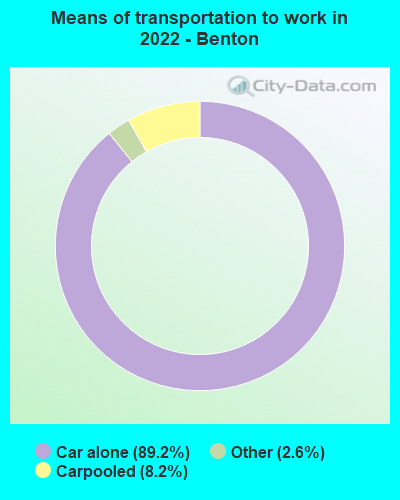
Means of transportation to work:
- Drove a car alone: 370 (79.9%)
- Carpooled: 35 (7.6%)
- Taxi: 13 (2.8%)
- Worked at home: 37 (8.0%)

- Unemployment by race in 2022
- Unemployment rate for White non-Hispanic residents
- 1.7%Males
- 10.6%Females

First ancestries reported:
- American: 170 (28.6%)
- English: 78 (13.1%)
- Irish: 62 (10.4%)
- German: 48 (8.1%)
- European: 29 (4.9%)
- Cajun: 18 (3.0%)
- Scottish: 14 (2.4%)
- Italian: 7 (1.2%)
- Scotch-Irish: 5 (0.8%)
- African: 3 (0.5%)
- Eastern European: 2 (0.3%)
- Liberian: 2 (0.3%)
Most common places of birth for foreign-born residents (%):
| Benton: | 33.3% (3) |
| Tennessee: | 0.3% (1,008) |
| Benton: | 22.2% (2) |
| Tennessee: | 0.2% (783) |
Place of birth for U.S.-born residents:
- This state: 1,196
- Other state: 386
- Northeast: 62
- Midwest: 117
- South: 195
- West: 7
78.1% of Benton residents lived in the same house 1 years ago.
Out of people who lived in different houses, 29.9% lived in this county.
Out of people who lived in different counties, 70.3% lived in Tennessee.
| Benton: | 78.1% |
| State average: | 87.0% |
Education attainment for males 25 years and older:
- No schooling: 7
- Nursery to 4th grade: 0
- 5th and 6th grade: 2
- 7th and 8th grade: 18
- 9th grade: 19
- 10th grade: 0
- 11th grade: 24
- 12th grade, no diploma: 9
- High school graduate (or equivalency): 246
- Less than 1 year of college: 45
- Some college more than 1 year, no degree: 69
- Associate degree: 46
- Bachelor's degree: 25
- Master's degree: 5
- Professional school degree: 0
- Doctorate degree: 0

Education attainment for females 25 years and older:
- No schooling: 2
- Nursery to 4th grade: 0
- 5th and 6th grade: 0
- 7th and 8th grade: 29
- 9th grade: 23
- 10th grade: 30
- 11th grade: 24
- 12th grade, no diploma: 8
- High school graduate (or equivalency): 208
- Less than 1 year of college: 58
- Some college more than 1 year, no degree: 60
- Associate degree: 36
- Bachelor's degree: 61
- Master's degree: 6
- Professional school degree: 4
- Doctorate degree: 0


Housing units in structures:
- One, detached: 383
- Two: 14
- 3 or 4: 37
- 5 to 9: 83
- 20 to 49: 16
- Mobile homes: 189
Median worth of mobile homes: $94,347
House/condo owner moved in on average 11 years ago
Renter moved in on average 6 years ago

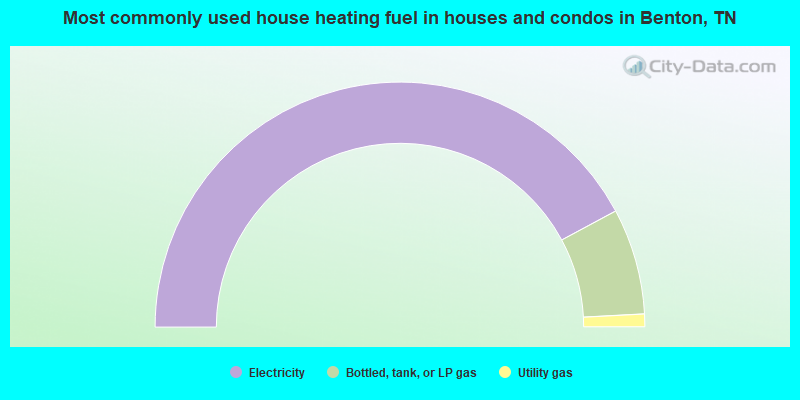
- 84.3%Electricity
- 14.0%Bottled, tank, or LP gas
- 1.7%Utility gas
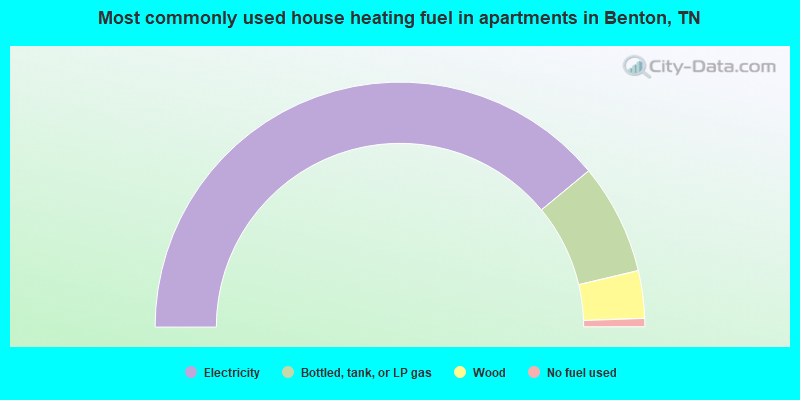
- 78.0%Electricity
- 14.6%Bottled, tank, or LP gas
- 6.3%Wood
- 1.1%No fuel used
Private vs. public school enrollment:
| Here: | 5.8% |
| Tennessee: | 15.0% |
| Here: | 6.8% |
| Tennessee: | 16.2% |
| Here: | 12.5% |
| Tennessee: | 23.5% |


