Berrien Springs, MI (Michigan) Houses and Residents
| Berrien Springs: | $168,680 |
| Michigan: | $224,400 |
Total population: 1,776 (All urban)
Houses: 861 (774 occupied: 448 owner occupied, 319 renter occupied)
| % of renters here: | 42% |
| State: | 27% |
Housing density: 952 houses/condos per square mile
Median price asked for vacant for-sale houses and condos in 2022: $106,148.
Median contract rent in 2022: $727 (lower quartile is $569, upper quartile is $839)
Median rent asked for vacant for-rent units in 2022: $11,159
Median gross rent in Berrien Springs, MI in 2022: $911
Housing units in Berrien Springs with a mortgage: 291 (23 second mortgage, 0 home equity loan, 18 both second mortgage and home equity loan)
Houses without a mortgage: 16
Median household income for houses/condos with a mortgage: $85,088
Median household income for apartments without a mortgage: $74,488
Median monthly housing costs: $924
Compare current foreclosures near Berrien Springs, MI:
| Photo | Address | Area | Beds / Baths | Price | Details |
|---|---|---|---|---|---|

|
#1
Wooddale Ave
South Bend, IN 46637
|
861 sq. feet
|
1 baths 2 beds |
$34,900
|
show details |

|
#2
Us Highway 31
Berrien Springs, MI 49103
|
- sq. feet
|
- baths - beds |
show details | |

|
#3
Meadowlark Ln
Berrien Springs, MI 49103
|
- sq. feet
|
- baths - beds |
show details | |

|
#4
Lily Rd
South Bend, IN 46637
|
1,768 sq. feet
|
2 baths 3 beds |
show details | |

|
#5
Elm St
Dowagiac, MI 49047
|
1,219 sq. feet
|
2 baths 4 beds |
show details | |

|
#6
Myrtle Ave
South Bend, IN 46637
|
1,809 sq. feet
|
2 baths 4 beds |
show details | |

|
#7
Hickory St
Niles, MI 49120
|
1,454 sq. feet
|
1 baths 4 beds |
show details | |

|
#8
Cove St
South Bend, IN 46628
|
1,134 sq. feet
|
1 baths 3 beds |
show details | |

|
#9
S 3rd St
Niles, MI 49120
|
1,762 sq. feet
|
2 baths 3 beds |
show details | |

|
#10
Conrad Rd
Edwardsburg, MI 49112
|
2,500 sq. feet
|
2 baths 3 beds |
show details |
| Photo | Address | Area | Beds / Baths | Price | Details |
|---|---|---|---|---|---|

|
#11
Olive Branch Rd
Galien, MI 49113
|
1,300 sq. feet
|
2 baths 2 beds |
show details | |

|
#12
Pencross Dr
Granger, IN 46530
|
2,885 sq. feet
|
4 baths 5 beds |
show details | |

|
#13
Leach Rd
Dowagiac, MI 49047
|
1,213 sq. feet
|
1 baths 2 beds |
show details | |

|
#14
Myrtle Ave
South Bend, IN 46637
|
988 sq. feet
|
1 baths 3 beds |
show details | |

|
#15
Fair Oaks St E
Niles, MI 49120
|
900 sq. feet
|
1 baths 1 beds |
show details | |

|
#16
Porter Dr
Eau Claire, MI 49111
|
1,352 sq. feet
|
2 baths 3 beds |
show details | |

|
#17
Jeffrey Ln
Niles, MI 49120
|
1,623 sq. feet
|
2 baths 2 beds |
show details | |

|
#18
Plimpton Ave
Benton Harbor, MI 49022
|
720 sq. feet
|
1 baths 1 beds |
show details | |

|
#19
Bishop Ave
Benton Harbor, MI 49022
|
1,040 sq. feet
|
1 baths 4 beds |
show details | |

|
#20
W Us Highway 12
Buchanan, MI 49107
|
1,484 sq. feet
|
2 baths 3 beds |
show details |
| Photo | Address | Area | Beds / Baths | Price | Details |
|---|---|---|---|---|---|

|
#21
Springwood Dr
Granger, IN 46530
|
4,512 sq. feet
|
3 baths 3 beds |
show details | |

|
#22
N Cayuga St
Buchanan, MI 49107
|
- sq. feet
|
2 baths 4 beds |
show details | |

|
#23
Helmen Ave
South Bend, IN 46637
|
1,208 sq. feet
|
1 baths 3 beds |
show details | |

|
#24
Stone Briar Dr
South Bend, IN 46628
|
1,243 sq. feet
|
2 baths 3 beds |
show details | |

|
#25
S Euclid Ave
Benton Harbor, MI 49022
|
1,889 sq. feet
|
1 baths - beds |
show details | |

|
#26
Brick Rd
South Bend, IN 46628
|
1,486 sq. feet
|
1 baths 3 beds |
show details | |

|
#27
Brick Rd
South Bend, IN 46628
|
1,080 sq. feet
|
1 baths 3 beds |
show details | |

|
#28
Orchard St
South Bend, IN 46637
|
1,632 sq. feet
|
1 baths 3 beds |
show details | |

|
#29
Monroe St
Benton Harbor, MI 49022
|
- sq. feet
|
2 baths 3 beds |
show details | |

|
#30
Roslyn Rd
Benton Harbor, MI 49022
|
- sq. feet
|
2 baths 3 beds |
show details |
| Photo | Address | Area | Beds / Baths | Price | Details |
|---|---|---|---|---|---|

|
#31
Forestbrook Ave
South Bend, IN 46637
|
1,056 sq. feet
|
1 baths 3 beds |
show details | |

|
#32
Parisian Dr
South Bend, IN 46637
|
1,590 sq. feet
|
2 baths 3 beds |
show details | |

|
#33
N Street
Cassopolis, MI 49031
|
- sq. feet
|
2 baths 3 beds |
show details | |

|
#34
Parkview Pl
South Bend, IN 46616
|
1,064 sq. feet
|
1 baths 3 beds |
show details | |

|
#35
Chicago Trl
New Carlisle, IN 46552
|
1,576 sq. feet
|
1 baths 3 beds |
show details | |

|
#36
Avanelle St
Granger, IN 46530
|
2,294 sq. feet
|
2 baths 4 beds |
show details | |

|
#37
Continental Ln
Granger, IN 46530
|
2,117 sq. feet
|
1 baths 3 beds |
show details | |

|
#38
Avanelle St
Granger, IN 46530
|
1,410 sq. feet
|
1 baths 3 beds |
show details | |

|
#39
Oakmont North Dr
South Bend, IN 46637
|
1,206 sq. feet
|
1 baths 2 beds |
show details | |

|
#40
Francis St
South Bend, IN 46637
|
2,008 sq. feet
|
3 baths 4 beds |
show details |
| Photo | Address | Area | Beds / Baths | Price | Details |
|---|---|---|---|---|---|

|
#41
Ironstone Dr
South Bend, IN 46635
|
2,016 sq. feet
|
2 baths 4 beds |
show details | |

|
#42
Crownhill Dr
South Bend, IN 46637
|
1,872 sq. feet
|
2 baths 3 beds |
show details | |

|
#43
Darden Rd
South Bend, IN 46637
|
888 sq. feet
|
1 baths 2 beds |
show details | |

|
#44
Auten Rd
South Bend, IN 46637
|
1,068 sq. feet
|
1 baths 3 beds |
show details | |

|
#45
67th St
Dowagiac, MI 49047
|
- sq. feet
|
1 baths 2 beds |
show details | |

|
#46
Rolling Hills Dr
South Bend, IN 46628
|
1,590 sq. feet
|
2 baths 1 beds |
show details | |

|
#47
Kenilworth Rd
South Bend, IN 46637
|
1,066 sq. feet
|
1 baths 2 beds |
show details | |

|
#48
Meadow Pond Dr
Granger, IN 46530
|
1,974 sq. feet
|
2 baths 4 beds |
show details | |

|
#49
Kenilworth Rd
South Bend, IN 46637
|
2,941 sq. feet
|
3 baths 6 beds |
show details | |

|
Check over 1 million property listings on Foreclosure.com!
|
browse all offers | |||


 | What are these areas of SW Michigan like? (7 replies) |
| Looking for RE Agent/Broker recommendations for Berrien Springs (0 replies) |
| Moving to Niles... Berrien Springs Area (12 replies) |
| Thinking about career change - Elementary Teacher (13 replies) |
| Berrien Springs (2 replies) |
| Which cities in Michigan would you consider "college towns"? (47 replies) |

Median year apartment built: 1967
Household type by relationship:
Households: 2,008- Male householders: 414 (110 living alone), Female householders: 351 (81 living alone)
343 spouses (343 opposite-sex spouses), 39 unmarried partners, (39 opposite-sex unmarried partners), 580 children (529 natural, 15 adopted, 34 stepchildren), 26 grandchildren, 27 brothers or sisters, 4 parents, 0 foster children, 15 other relatives, 203 non-relatives
Size of family households: 182 2-persons, 130 3-persons, 82 4-persons, 61 5-persons, 20 7-or-more-persons.
Size of nonfamily households: 202 1-person, 79 2-persons, 18 3-persons, 1 4-persons.
257 married couples with children.
137 single-parent households (26 men, 111 women).
75.2% of residents of Berrien Springs speak English at home.
10.4% of residents speak Spanish at home (80% speak English very well, 16% speak English well, 4% speak English not well, 1% don't speak English at all).
4.0% of residents speak other Indo-European language at home (71% speak English very well, 14% speak English well, 9% speak English not well, 6% don't speak English at all).
7.3% of residents speak Asian or Pacific Island language at home (67% speak English very well, 15% speak English well, 18% speak English not well).
2.6% of residents speak other language at home (100% speak English very well).
Foreign born population: 411 (20.5%)
(56.9% of them are naturalized citizens)
| Here: | 6.7 |
| State: | 6.5 |
| Here: | 4.1 |
| State: | 4.3 |

- Bedrooms in owner-occupied houses and condos in Berrien Springs, Michigan
- 0no bedroom
- 191 bedroom
- 872 bedrooms
- 2483 bedrooms
- 734 bedrooms
- 225+ bedrooms

- Bedrooms in renter-occupied apartments in Berrien Springs, Michigan
- 12no bedroom
- 841 bedroom
- 1552 bedrooms
- 583 bedrooms
- 94 bedrooms
- 35+ bedrooms

- Cars and other vehicles available in Berrien Springs in owner-occupied houses/condos
- 10no vehicle
- 1391 vehicle
- 1872 vehicles
- 923 vehicles
- 214 vehicles
- 05+ vehicles

- Cars and other vehicles available in Berrien Springs in renter-occupied apartments
- 49no vehicle
- 1521 vehicle
- 892 vehicles
- 253 vehicles
- 64 vehicles
- 05+ vehicles

- Rooms in owner-occupied houses in Berrien Springs, Michigan
- 01 room
- 62 rooms
- 213 rooms
- 144 rooms
- 775 rooms
- 846 rooms
- 917 rooms
- 788 rooms
- 799+ rooms

- Rooms in renter-occupied apartments in Berrien Springs, Michigan
- 121 room
- 112 rooms
- 863 rooms
- 974 rooms
- 355 rooms
- 346 rooms
- 297 rooms
- 88 rooms
- 99+ rooms


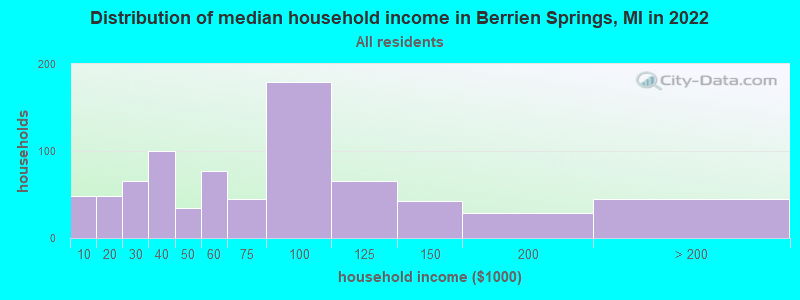
Berrien Springs, MI household income distribution

- 48Less than $10,000
- 48$10,000 to $19,999
- 66$20,000 to $29,999
- 100$30,000 to $39,999
- 34$40,000 to $49,999
- 77$50,000 to $59,999
- 45$60,000 to $74,999
- 179$75,000 to $99,999
- 66$100,000 to $124,999
- 43$125,000 to $149,999
- 29$150,000 to $199,999
- 45$200,000 or more
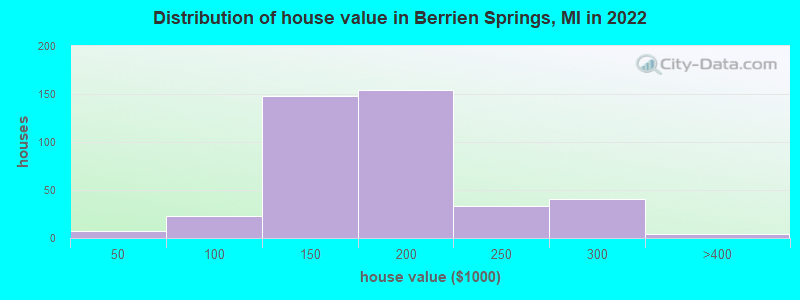
Home value of owner - occupied houses in 2022 in Berrien Springs, MI
-
- 6$15,000 to $19,999
- 4$60,000 to $69,999
- 11$80,000 to $89,999
- 7$90,000 to $99,999
- 73$100,000 to $124,999
- 74$125,000 to $149,999
- 107$150,000 to $174,999
- 46$175,000 to $199,999
- 32$200,000 to $249,999
- 41$250,000 to $299,999
- 4$300,000 to $399,999
Rent paid by renters in 2022 in Berrien Springs, MI
-
- 5$150 to $199
- 7$200 to $249
- 7$400 to $449
- 12$450 to $499
- 36$500 to $549
- 26$550 to $599
- 14$600 to $649
- 13$650 to $699
- 25$700 to $749
- 20$750 to $799
- 85$800 to $899
- 14$900 to $999
- 9$1,000 to $1,249
- 10$1,500 to $1,999
- 1No cash rent


Percentage of workers working in this county: 86.0%
Number of people working at home: 116 (12.5% of all workers)
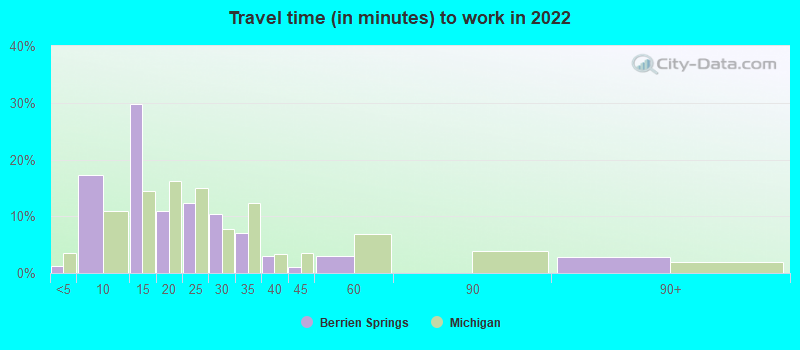
Travel time to work (commute)
- Less than 5 minutes: 21
- 5 to 9 minutes: 187
- 10 to 14 minutes: 108
- 15 to 19 minutes: 54
- 20 to 24 minutes: 148
- 25 to 29 minutes: 66
- 30 to 34 minutes: 98
- 35 to 39 minutes: 20
- 40 to 44 minutes: 33
- 45 to 59 minutes: 34
- 60 to 89 minutes: 0
- 90 or more minutes: 18
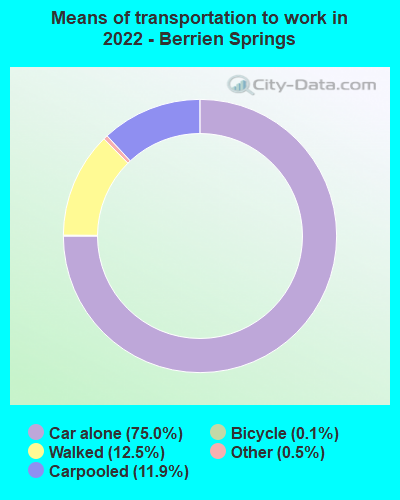
Means of transportation to work:
- Drove a car alone: 1,055 (66.4%)
- Carpooled: 229 (14.4%)
- Taxi: 6 (0.4%)
- Bicycle: 2 (0.1%)
- Walked: 180 (11.3%)
- Worked at home: 116 (7.3%)

- Unemployment by race in 2022
- Unemployment rate for White non-Hispanic residents
- 2.1%Males
- 22.9%Females
- Unemployment rate for American Indian and Alaska Native residents
- 40.9%Males
- Unemployment rate for other race residents
- 52.1%Males
- Unemployment rate for two or more race residents
- 6.3%Males
- 5.0%Females
- Unemployment rate for Hispanic or Latino residents
- 8.2%Males

- Year of entry for the foreign-born population in Berrien Springs, Michigan
- 2002010 or later
- 1112000 to 2009
- 741990 to 1999
- 601980 to 1989
- 211970 to 1979
- 25Before 1970

First ancestries reported:
- German: 145 (17.1%)
- English: 47 (5.5%)
- American: 38 (4.5%)
- European: 29 (3.4%)
- African: 27 (3.2%)
- Portuguese: 22 (2.6%)
- Haitian: 20 (2.4%)
- Irish: 18 (2.1%)
- Serbian: 14 (1.6%)
- British West Indian: 12 (1.4%)
- Norwegian: 9 (1.1%)
- Scotch-Irish: 9 (1.1%)
- Jamaican: 9 (1.1%)
- Trinidadian and Tobagonian: 9 (1.1%)
- Scandinavian: 8 (0.9%)
- Italian: 5 (0.6%)
- Barbadian: 5 (0.6%)
- Scottish: 4 (0.5%)
- Brazilian: 2 (0.2%)
- Czech: 2 (0.2%)
- Dutch: 2 (0.2%)
- Polish: 2 (0.2%)
- Swedish: 2 (0.2%)
- British: 1 (0.1%)
Most common places of birth for foreign-born residents (%):
| Berrien Springs: | 13.8% (62) |
| Michigan: | 0.5% (3,687) |
| Berrien Springs: | 13.3% (60) |
| Michigan: | 3.0% (20,884) |
| Berrien Springs: | 8.4% (38) |
| Michigan: | 0.6% (3,969) |
| Berrien Springs: | 8.0% (36) |
| Michigan: | 10.9% (75,965) |
| Berrien Springs: | 7.1% (32) |
| Michigan: | 0.3% (1,965) |
| Berrien Springs: | 5.3% (24) |
| Michigan: | 0.2% (1,298) |
| Berrien Springs: | 4.2% (19) |
| Michigan: | 0.2% (1,346) |
| Berrien Springs: | 4.0% (18) |
| Michigan: | 0.0% (196) |
| Berrien Springs: | 3.8% (17) |
| Michigan: | 1.1% (7,792) |
| Berrien Springs: | 3.6% (16) |
| Michigan: | 0.2% (1,481) |
| Berrien Springs: | 2.9% (13) |
| Michigan: | 0.2% (1,331) |
| Berrien Springs: | 2.7% (12) |
| Michigan: | 2.6% (18,065) |
| Berrien Springs: | 2.2% (10) |
| Michigan: | 11.1% (77,240) |
| Berrien Springs: | 2.2% (10) |
| Michigan: | 0.1% (464) |
| Berrien Springs: | 2.2% (10) |
| Michigan: | 1.1% (7,485) |
| Berrien Springs: | 1.8% (8) |
| Michigan: | 0.2% (1,188) |
| Berrien Springs: | 1.6% (7) |
| Michigan: | 0.4% (3,080) |
| Berrien Springs: | 1.6% (7) |
| Michigan: | 2.3% (16,126) |
Place of birth for U.S.-born residents:
- This state: 807
- Other state: 668
- Northeast: 115
- Midwest: 229
- South: 171
- West: 174
86.4% of Berrien Springs residents lived in the same house 1 years ago.
Out of people who lived in different houses, 40.8% lived in this county.
Out of people who lived in different counties, 45.0% lived in Michigan.
| Berrien Springs: | 86.4% |
| State average: | 88.4% |
Education attainment for males 25 years and older:
- No schooling: 16
- Nursery to 4th grade: 0
- 5th and 6th grade: 0
- 7th and 8th grade: 3
- 9th grade: 0
- 10th grade: 0
- 11th grade: 0
- 12th grade, no diploma: 29
- High school graduate (or equivalency): 143
- Less than 1 year of college: 17
- Some college more than 1 year, no degree: 94
- Associate degree: 24
- Bachelor's degree: 97
- Master's degree: 166
- Professional school degree: 4
- Doctorate degree: 43

Education attainment for females 25 years and older:
- No schooling: 27
- Nursery to 4th grade: 2
- 5th and 6th grade: 2
- 7th and 8th grade: 3
- 9th grade: 0
- 10th grade: 4
- 11th grade: 0
- 12th grade, no diploma: 2
- High school graduate (or equivalency): 104
- Less than 1 year of college: 52
- Some college more than 1 year, no degree: 37
- Associate degree: 98
- Bachelor's degree: 208
- Master's degree: 74
- Professional school degree: 2
- Doctorate degree: 20


Housing units in structures:
- One, detached: 592
- One, attached: 15
- Two: 74
- 3 or 4: 61
- 5 to 9: 96
- 10 to 19: 12
- Mobile homes: 9
Housing units lacking complete kitchen facilities in 2022: 6.1%
House/condo owner moved in on average 7 years ago
Renter moved in on average 2 years ago

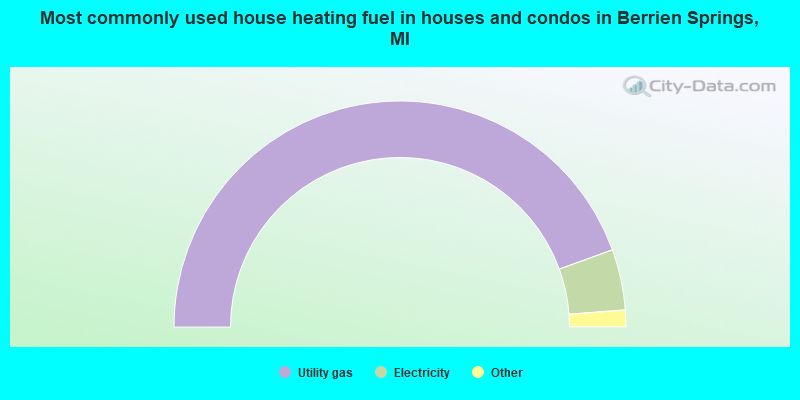
- 89.1%Utility gas
- 8.7%Electricity
- 1.1%Wood
- 0.9%Bottled, tank, or LP gas
- 0.2%Fuel oil, kerosene, etc.
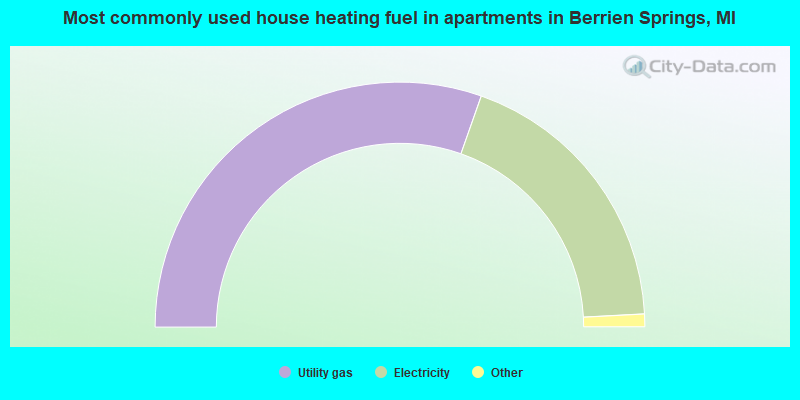
- 61.1%Utility gas
- 37.7%Electricity
- 0.6%Bottled, tank, or LP gas
- 0.6%Wood
Private vs. public school enrollment:
| Here: | 29.7% |
| Michigan: | 12.4% |
| Here: | 24.1% |
| Michigan: | 9.8% |
| Here: | 53.0% |
| Michigan: | 14.9% |


