Bethlehem, NH (New Hampshire) Houses and Residents
Estimated median house or condo value in 2022: $280,309 (it was $87,700 in 2000 )
Bethlehem:
$280,309New Hampshire:
$384,700
Lower value quartile - upper value quartile: $172,557 - $369,002Total population: 2,526 (Urban population: 0, Rural population: 2,199 (12 farm, 2,187 nonfarm ))
Houses: 1,307 (924 occupied: 646 owner occupied, 278 renter occupied )
% of renters here:
30%State:
28%
Housing density: 14 houses/condos per square mile
Median price asked for vacant for-sale houses and condos in 2022 in this county: $210,911.
Median contract rent in 2022: $946 (lower quartile is $745, upper quartile is $1,243)
Median rent asked for vacant for-rent units in 2022: $1,047
Median gross rent in Bethlehem, NH in 2022: $1,093
Housing units in Bethlehem with a mortgage: 287 (11 second mortgage, 34 home equity loan, 0 both second mortgage and home equity loan )Houses without a mortgage: 138
Data:
Median house or condo value ($)
Median house or condo value ($ change since 2000)
Median house or condo value ($) - White
Median house or condo value ($) - Black or African American
Median house or condo value ($) - Asian
Median house or condo value ($) - Hispanic or Latino
Median house or condo value ($) - American Indian and Alaska Native
Median house or condo value ($) - Multirace
Median house or condo value ($) - Other Race
Median price asked for mobile homes ($)
Household density (households per square mile)
Mean house or condo value by units in structure - 1, detached ($)
Mean house or condo value by units in structure - 1, attached ($)
Mean house or condo value by units in structure - 2 ($)
Mean house or condo value by units in structure by units in structure - 3 or 4 ($)
Mean house or condo value by units in structure - 5 or more ($)
Mean house or condo value by units in structure - Boat, RV, van, etc. ($)
Mean house or condo value by units in structure - Mobile home ($)
Median contract rent ($)
Median contract rent - Lower quartile ($)
Median contract rent - Upper quartile ($)
Median gross rent ($)
Urban houses (%)
Rural houses (%)
Houses occupied (%)
Houses occupied (% change since 2000)
Houses owner occupied (%)
Houses owner occupied (% change since 2000)
Houses renter occupied (%)
Houses renter occupied (% change since 2000)
Vacant housing units - For rent (%)
Vacant housing units - For rent (% change since 2000)
Vacant housing units - For sale only (%)
Vacant housing units - For sale only (% change since 2000)
Vacant housing units - Rented or sold, not occupied (%)
Vacant housing units - Rented or sold, not occupied (% change since 2000)
Vacant housing units - For seasonal, recreational, or occasional use (%)
Vacant housing units - For seasonal, recreational, or occasional use (% change since 2000)
Vacant housing units - For migrant workers (%)
Vacant housing units - For migrant workers (% change since 2000)
Vacant housing units - Other vacant (%)
Vacant housing units - Other vacant (% change since 2000)
Median monthly housing costs ($)
Median household income for houses/condos with a mortgage ($)
Median household income for houses/condos without a mortgage ($)
Median household income ($)
Median household income ($) - White
Median household income ($) - Black or African American
Median household income ($) - Asian
Median household income ($) - Hispanic or Latino
Median household income ($) - American Indian and Alaska Native
Median household income ($) - Multirace
Median household income ($) - Other Race
Mortgage status - with mortgage (%)
Mortgage status - with second mortgage (%)
Mortgage status - with home equity loan (%)
Mortgage status - with both second mortgage and home equity loan (%)
Mortgage status - without a mortgage (%)
Median year house/condo built
Median year apartment built
Household type by relationship - Male householder living alone (%)
Household type by relationship - Male householder not living alone (%)
Household type by relationship - Female householder living alone (%)
Household type by relationship - Female householder not living alone (%)
Household type by relationship - Opposite-Sex spouse (%)
Household type by relationship - Same-Sex spouse (%)
Household type by relationship - Opposite-Sex unmarried partner (%)
Household type by relationship - Same-Sex unmarried partner (%)
Household type by relationship - In group quarters (%)
Size of family households - 2-person household (%)
Size of family households - 3-person household (%)
Size of family households - 4-person household (%)
Size of family households - 5-person household (%)
Size of family households - 6-person household (%)
Size of family households - 7-or-more-person household (%)
Size of nonfamily households - 1-person household (%)
Size of nonfamily households - 2-person household (%)
Size of nonfamily households - 3-person household (%)
Size of nonfamily households - 4-person household (%)
Size of nonfamily households - 5-person household (%)
Size of nonfamily households - 6-person household (%)
Size of nonfamily households - 7-or-moreperson household (%)
Year house built - Built 2010 or later (%)
Year house built - Built 2000 to 2009 (%)
Year house built - Built 1990 to 1999 (%)
Year house built - Built 1980 to 1989 (%)
Year house built - Built 1970 to 1979 (%)
Year house built - Built 1960 to 1969 (%)
Year house built - Built 1950 to 1959 (%)
Year house built - Built 1940 to 1949 (%)
Year house built - Built 1939 or earlier (%)
Median number of rooms in houses and condos
Median number of rooms in apartments
Median number of bedrooms in owner occupied houses
Mean number of bedrooms in owner occupied houses
Median number of bedrooms in renter occupied houses
Mean number of bedrooms in renter occupied houses
Median number of vehichles in owner occupied houses
Mean number of vehichles in owner occupied houses
Median number of vehichles in renter occupied houses
Mean number of vehichles in renter occupied houses
Rooms in owner-occupied houses - 1 room (%)
Rooms in owner-occupied houses - 2 rooms (%)
Rooms in owner-occupied houses - 3 rooms (%)
Rooms in owner-occupied houses - 4 rooms (%)
Rooms in owner-occupied houses - 5 rooms (%)
Rooms in owner-occupied houses - 6 rooms (%)
Rooms in owner-occupied houses - 7 rooms (%)
Rooms in owner-occupied houses - 8 rooms (%)
Rooms in owner-occupied houses - 9+ rooms (%)
Rooms in renter-occupied houses - 1 room (%)
Rooms in renter-occupied houses - 2 rooms (%)
Rooms in renter-occupied houses - 3 rooms (%)
Rooms in renter-occupied houses - 4 rooms (%)
Rooms in renter-occupied houses - 5 rooms (%)
Rooms in renter-occupied houses - 6 rooms (%)
Rooms in renter-occupied houses - 7 rooms (%)
Rooms in renter-occupied houses - 8 rooms (%)
Rooms in renter-occupied houses - 9+ rooms (%)
Bedrooms in owner-occupied houses - no bedrooms (%)
Bedrooms in owner-occupied houses - 1 bedroom (%)
Bedrooms in owner-occupied houses - 2 bedrooms (%)
Bedrooms in owner-occupied houses - 3 bedrooms (%)
Bedrooms in owner-occupied houses - 4 bedrooms (%)
Bedrooms in owner-occupied houses - 5+ bedrooms (%)
Bedrooms in renter-occupied houses - no bedrooms (%)
Bedrooms in renter-occupied houses - 1 bedroom (%)
Bedrooms in renter-occupied houses - 2 bedrooms (%)
Bedrooms in renter-occupied houses - 3 bedrooms (%)
Bedrooms in renter-occupied houses - 4 bedrooms (%)
Bedrooms in renter-occupied houses - 5+ bedrooms (%)
Vehicles available in owner-occupied houses - no vehicle available (%)
Vehicles available in owner-occupied houses - 1 vehicle available(%)
Vehicles available in owner-occupied houses - 2 Vehicles available (%)
Vehicles available in owner-occupied houses - 3 Vehicles available (%)
Vehicles available in owner-occupied houses - 4 Vehicles available (%)
Vehicles available in owner-occupied houses - 5+ Vehicles available (%)
Vehicles available in renter-occupied houses - no vehicle available (%)
Vehicles available in renter-occupied houses - 1 vehicle available (%)
Vehicles available in renter-occupied houses - 2 Vehicles available (%)
Vehicles available in renter-occupied houses - 3 Vehicles available (%)
Vehicles available in renter-occupied houses - 4 Vehicles available (%)
Vehicles available in renter-occupied houses - 5+ Vehicles available (%)
Housing units in structures - 1, detached (%)
Housing units in structures - 1, attached (%)
Housing units in structures - 2 (%)
Housing units in structures - 3 or 4 (%)
Housing units in structures - 5 to 9 (%)
Housing units in structures - 10 to 19 (%)
Housing units in structures - 20 to 49 (%)
Housing units in structures - 50 or more (%)
Housing units in structures - Mobile home (%)
Housing units in structures - Boat, RV, van, etc. (%)
Housing units in structures - Owners - 1, detached (%)
Housing units in structures - Owners - 1, attached (%)
Housing units in structures - Owners - 2 (%)
Housing units in structures - Owners - 3 or 4 (%)
Housing units in structures - Owners - 5 to 9 (%)
Housing units in structures - Owners - 10 to 19 (%)
Housing units in structures - Owners - 20 to 49 (%)
Housing units in structures - Owners - 50 or more (%)
Housing units in structures - Owners - Mobile home (%)
Housing units in structures - Owners - Boat, RV, van, etc. (%)
Housing units in structures - Renters - 1, detached (%)
Housing units in structures - Renters - 1, attached (%)
Housing units in structures - Renters - 2 (%)
Housing units in structures - Renters - 3 or 4 (%)
Housing units in structures - Renters - 5 to 9 (%)
Housing units in structures - Renters - 10 to 19 (%)
Housing units in structures - Renters - 20 to 49 (%)
Housing units in structures - Renters - 50 or more (%)
Housing units in structures - Renters - Mobile home (%)
Housing units in structures - Renters - Boat, RV, van, etc. (%)
House/condo owner moved in on average (years ago)
Renter moved in on average (years ago)
Year householder moved into unit - Moved in 1999 to March 2000 (%)
Year householder moved into unit - Moved in 1999 to March 2000 (%) - White
Year householder moved into unit - Moved in 1999 to March 2000 (%) - Black or African American
Year householder moved into unit - Moved in 1999 to March 2000 (%) - Asian
Year householder moved into unit - Moved in 1999 to March 2000 (%) - Hispanic or Latino
Year householder moved into unit - Moved in 1999 to March 2000 (%) - American Indian and Alaska Native
Year householder moved into unit - Moved in 1999 to March 2000 (%) - Multirace
Year householder moved into unit - Moved in 1999 to March 2000 (%) - Other Race
Year householder moved into unit - Moved in 1995 to 1998 (%)
Year householder moved into unit - Moved in 1995 to 1998 (%) - White
Year householder moved into unit - Moved in 1995 to 1998 (%) - Black or African American
Year householder moved into unit - Moved in 1995 to 1998 (%) - Asian
Year householder moved into unit - Moved in 1995 to 1998 (%) - Hispanic or Latino
Year householder moved into unit - Moved in 1995 to 1998 (%) - American Indian and Alaska Native
Year householder moved into unit - Moved in 1995 to 1998 (%) - Multirace
Year householder moved into unit - Moved in 1995 to 1998 (%) - Other Race
Year householder moved into unit - Moved in 1990 to 1994 (%)
Year householder moved into unit - Moved in 1990 to 1994 (%) - White
Year householder moved into unit - Moved in 1990 to 1994 (%) - Black or African American
Year householder moved into unit - Moved in 1990 to 1994 (%) - Asian
Year householder moved into unit - Moved in 1990 to 1994 (%) - Hispanic or Latino
Year householder moved into unit - Moved in 1990 to 1994 (%) - American Indian and Alaska Native
Year householder moved into unit - Moved in 1990 to 1994 (%) - Multirace
Year householder moved into unit - Moved in 1990 to 1994 (%) - Other Race
Year householder moved into unit - Moved in 1980 to 1989 (%)
Year householder moved into unit - Moved in 1980 to 1989 (%) - White
Year householder moved into unit - Moved in 1980 to 1989 (%) - Black or African American
Year householder moved into unit - Moved in 1980 to 1989 (%) - Asian
Year householder moved into unit - Moved in 1980 to 1989 (%) - Hispanic or Latino
Year householder moved into unit - Moved in 1980 to 1989 (%) - American Indian and Alaska Native
Year householder moved into unit - Moved in 1980 to 1989 (%) - Multirace
Year householder moved into unit - Moved in 1980 to 1989 (%) - Other Race
Year householder moved into unit - Moved in 1970 to 1979 (%)
Year householder moved into unit - Moved in 1970 to 1979 (%) - White
Year householder moved into unit - Moved in 1970 to 1979 (%) - Black or African American
Year householder moved into unit - Moved in 1970 to 1979 (%) - Asian
Year householder moved into unit - Moved in 1970 to 1979 (%) - Hispanic or Latino
Year householder moved into unit - Moved in 1970 to 1979 (%) - American Indian and Alaska Native
Year householder moved into unit - Moved in 1970 to 1979 (%) - Multirace
Year householder moved into unit - Moved in 1970 to 1979 (%) - Other Race
Year householder moved into unit - Moved in 1969 or earlier (%)
Year householder moved into unit - Moved in 1969 or earlier (%) - White
Year householder moved into unit - Moved in 1969 or earlier (%) - Black or African American
Year householder moved into unit - Moved in 1969 or earlier (%) - Asian
Year householder moved into unit - Moved in 1969 or earlier (%) - Hispanic or Latino
Year householder moved into unit - Moved in 1969 or earlier (%) - American Indian and Alaska Native
Year householder moved into unit - Moved in 1969 or earlier (%) - Multirace
Year householder moved into unit - Moved in 1969 or earlier (%) - Other Race
Housing units lacking complete plumbing facilities (%)
Housing units lacking complete kitchen facilities (%)
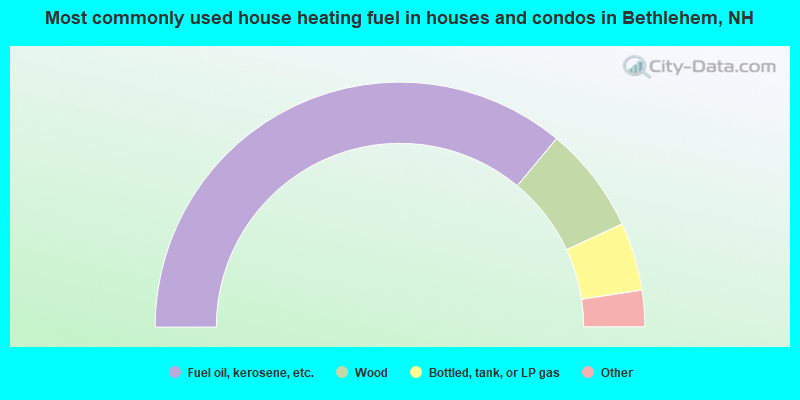
House heating fuel used in houses and condos - Utility gas (%)
House heating fuel used in houses and condos - Bottled, tank, or LP gas (%)
House heating fuel used in houses and condos - Electricity (%)
House heating fuel used in houses and condos - Fuel oil, kerosene, etc. (%)
House heating fuel used in houses and condos - Coal or coke (%)
House heating fuel used in houses and condos - Wood (%)
House heating fuel used in houses and condos - Solar energy (%)
House heating fuel used in houses and condos - Other fuel (%)
House heating fuel used in houses and condos - No fuel used (%)
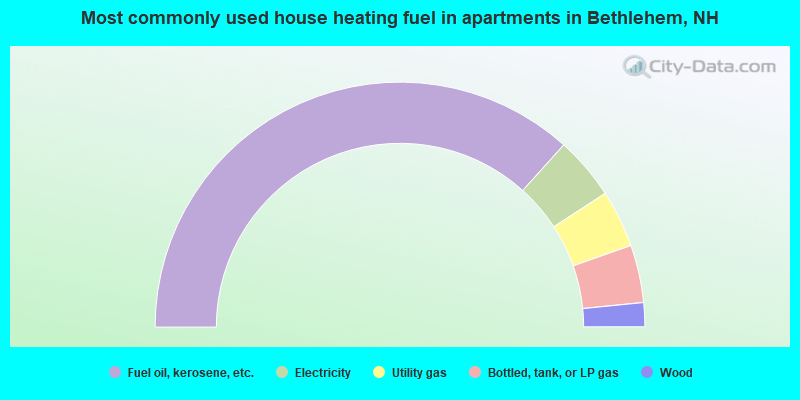
House heating fuel used in apartments - Utility gas (%)
House heating fuel used in apartments - Bottled, tank, or LP gas (%)
House heating fuel used in apartments - Electricity (%)
House heating fuel used in apartments - Fuel oil, kerosene, etc. (%)
House heating fuel used in apartments - Coal or coke (%)
House heating fuel used in apartments - Wood (%)
House heating fuel used in apartments - Solar energy (%)
House heating fuel used in apartments - Other fuel (%)
House heating fuel used in apartments - No fuel used (%)
Latest news about housing in Bethlehem, NH collected exclusively by city-data.com from local newspapers, TV, and radio stations
Household type by relationship:
Households: 82,117
In family households: 63,633 (15,537 male householders , 6,537 female householders )
17,631 spouses , 19,508 children (17,981 natural , 564 adopted , 963 stepchildren ), 929 grandchildren , 338 brothers or sisters , 482 parents , foster children , 353 other relatives , 1,921 non-relatives In nonfamily households: 18,484 (6,671 male householders (4,834 living alone )), 7,241 female householders (5,759 living alone )), 4,572 nonrelatives In group quarters: 7,001 (674 institutionalized population)
12,855 married couples with children. single-parent households (1,075 men , 2,730 women ).
94.3% of residents of Bethlehem speak English at home. of residents speak Spanish at home (92% speak English very well , 8% speak English well ).of residents speak other Indo-European language at home (73% speak English very well , 19% speak English well , 8% speak English not well ).of residents speak other language at home (100% speak English very well ).
Foreign born population: 138 (5.6%)of them are naturalized citizens )
Median number of rooms in houses and condos:
Median number of rooms in apartments
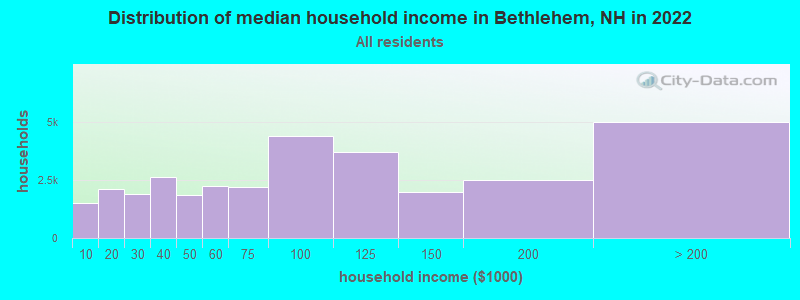
Bethlehem, NH household income distribution 1,527 Less than $10,0002,096 $10,000 to $19,9991,905 $20,000 to $29,9992,646 $30,000 to $39,9991,851 $40,000 to $49,9992,225 $50,000 to $59,9992,219 $60,000 to $74,9994,375 $75,000 to $99,9993,726 $100,000 to $124,9991,999 $125,000 to $149,9992,492 $150,000 to $199,9994,999 $200,000 or more
Percentage of workers working in this county: 84.6%Number of people working at home: 251 (17.5% of all workers )
Travel time to work (commute)
Less than 5 minutes: 775 to 9 minutes: 15410 to 14 minutes: 30115 to 19 minutes: 25920 to 24 minutes: 13125 to 29 minutes: 4730 to 34 minutes: 6535 to 39 minutes: 840 to 44 minutes: 2145 to 59 minutes: 2560 to 89 minutes: 1590 or more minutes: 41
Means of transportation to work:
Drove a car alone: 955 (77.7%)Carpooled: 126 (10.3%)Bus or trolley bus : 3 (0.2%)Railroad : 2 (0.2%)Walked: 46 (3.7%)Other means: 12 (1.0%)Worked at home: 85 (6.9%)
Year of entry for the foreign-born population in Bethlehem, New Hampshire
22 1995 to March 2000 3 1990 to 1994 17 1985 to 1989 6 1980 to 1984 0 1975 to 1979 4 1970 to 1974 8 1965 to 1969 19 Before 1965
First ancestries reported:
English: 461 (17.3%)
French: 457 (17.2%)
Irish: 455 (17.1%)
Other: 283 (10.6%)
German: 257 (9.6%)
Scottish: 142 (5.3%)
Italian: 101 (3.8%)
French Canadian: 82 (3.1%)
United States: 77 (2.9%)
Swedish: 68 (2.6%)
Scotch-Irish: 66 (2.5%)
Polish: 64 (2.4%)
Norwegian: 35 (1.3%)
Russian: 32 (1.2%)
Dutch: 18 (0.7%)
Portuguese: 16 (0.6%)
Swiss: 11 (0.4%)
Welsh: 9 (0.3%)
Czech: 8 (0.3%)
Arab: 5 (0.2%)
Danish: 4 (0.2%)
Lithuanian: 4 (0.2%)
Hungarian: 3 (0.1%)
Greek: 2 (0.08%)
Slovak: 2 (0.08%)
Ukrainian: 2 (0.08%) Most common places of birth for foreign-born residents (%): Canada Bethlehem:
31.6% (25)New Hampshire:
22.9% (12,397)
United Kingdom Bethlehem:
19.0% (15)New Hampshire:
8.1% (4,396)
Russia Bethlehem:
12.7% (10)New Hampshire:
1.3% (689)
Sweden Bethlehem:
11.4% (9)New Hampshire:
0.5% (250)
Netherlands Bethlehem:
7.6% (6)New Hampshire:
0.9% (471)
Korea Bethlehem:
7.6% (6)New Hampshire:
2.9% (1,582)
Germany Bethlehem:
6.3% (5)New Hampshire:
4.9% (2,670)
Other Northern America Bethlehem:
2.5% (2)New Hampshire:
0.1% (55)
Place of birth for U.S.-born residents:
This state: 954Other state: 1,156Northeast: 936Midwest: 69South: 97West: 54 57% of Bethlehem residents lived in the same house 5 years ago.
Out of people who lived in different houses, 54% lived in this county.
Out of people who lived in different counties, 26% lived in New Hampshire.
Education attainment for males 25 years and older:
No schooling: 1Nursery to 4th grade: 85th and 6th grade: 47th and 8th grade: 229th grade: 1010th grade: 2911th grade: 1412th grade, no diploma: 12High school graduate (or equivalency): 277Less than 1 year of college: 34Some college more than 1 year, no degree: 98Associate degree: 61Bachelor's degree: 123Master's degree: 56Professional school degree: 15Doctorate degree: 12
Education attainment for females 25 years and older:
No schooling: 2Nursery to 4th grade: 05th and 6th grade: 37th and 8th grade: 69th grade: 910th grade: 2411th grade: 1212th grade, no diploma: 16High school graduate (or equivalency): 252Less than 1 year of college: 36Some college more than 1 year, no degree: 107Associate degree: 98Bachelor's degree: 137Master's degree: 65Professional school degree: 11Doctorate degree: 2
Housing units in structures:
One, detached: 865One, attached: 107Two: 573 or 4: 775 to 9: 6610 to 19: 3520 to 49: 17Mobile homes: 70Boats, RVs, vans, etc.: 13Median worth of mobile homes: $61,421
Housing units lacking complete plumbing facilities: 3.4%Housing units lacking complete kitchen facilities: 2.8%Private vs. public school enrollment:
Students in private schools in grades 1 to 8 (elementary and middle school): 9 Here:
3.4%New Hampshire:
8.9%
Students in private schools in grades 9 to 12 (high school): 8 Here:
5.8%New Hampshire:
10.7%
Students in private undergraduate colleges: 21 Here:
39.6%New Hampshire:
36.4%