Bethlehem, WV (West Virginia) Houses and Residents
| Bethlehem: | $209,885 |
| West Virginia: | $155,100 |
Mean price in 2022:
Detached houses: $201,437
Here: $201,437 State: $206,655
Total population: 2,444 (All urban)
Houses: 1,148 (1,064 occupied: 937 owner occupied, 153 renter occupied)
| % of renters here: | 14% |
| State: | 26% |
Housing density: 325 houses/condos per square mile
Median price asked for vacant for-sale houses and condos in 2022 in this county: $110,506.
Median contract rent in 2022: $933 (lower quartile is $812, upper quartile is $1,084)
Median rent asked for vacant for-rent units in 2022: $845
Median gross rent in Bethlehem, WV in 2022: $1,112
Housing units in Bethlehem with a mortgage: 590 (65 second mortgage, 0 home equity loan, 47 both second mortgage and home equity loan)
Houses without a mortgage: 20
Median household income for houses/condos with a mortgage: $103,748
Median household income for apartments without a mortgage: $59,198
Median monthly housing costs: $1,027
Compare current foreclosures near Bethlehem, WV:
| Photo | Address | Area | Beds / Baths | Price | Details |
|---|---|---|---|---|---|

|
#1
E Paxton Ave
Wheeling, WV 26003
|
1,452 sq. feet
|
1 baths 3 beds |
$24,500
|
show details |

|
#2
Roby St
Adena, OH 43901
|
1,948 sq. feet
|
1 baths 3 beds |
$38,500
|
show details |

|
#3
Main St
Wellsburg, WV 26070
|
2,726 sq. feet
|
1 baths 4 beds |
$74,500
|
show details |

|
#4
Ferrell Ave
Triadelphia, WV 26059
|
1,082 sq. feet
|
1 baths 2 beds |
$85,000
|
show details |

|
#5
Bennett St
Bridgeport, OH 43912
|
1,742 sq. feet
|
2 baths 3 beds |
show details | |

|
#6
Sand Hill Rd
Bellaire, OH 43906
|
1,048 sq. feet
|
1 baths 2 beds |
show details | |

|
#7
506 S York St
Wheeling, WV 26003
|
- sq. feet
|
- baths - beds |
$25,900
|
show details |

|
#8
Fork Ridge Rd # 122
Moundsville, WV 26041
|
- sq. feet
|
1 baths 3 beds |
show details | |

|
#9
State Route 250
Harrisville, OH 43974
|
1,050 sq. feet
|
1 baths 3 beds |
show details | |

|
#10
Hillcrest Dr
Martins Ferry, OH 43935
|
1,040 sq. feet
|
1 baths 3 beds |
show details |
| Photo | Address | Area | Beds / Baths | Price | Details |
|---|---|---|---|---|---|

|
#11
N 7th St
Martins Ferry, OH 43935
|
1,840 sq. feet
|
1 baths 3 beds |
show details | |

|
#12
Concord St
Martins Ferry, OH 43935
|
1,344 sq. feet
|
2 baths 4 beds |
show details | |

|
#13
-218 1/2 N 8th St
Martins Ferry, OH 43935
|
- sq. feet
|
2 baths 6 beds |
show details | |

|
#14
Chestnut Rd
Bellaire, OH 43906
|
1,448 sq. feet
|
1 baths 4 beds |
show details | |

|
#15
Clinton Ave
Moundsville, WV 26041
|
1,492 sq. feet
|
1 baths 3 beds |
show details | |

|
#16
Juniper Ave
Moundsville, WV 26041
|
1,811 sq. feet
|
1 baths 4 beds |
show details | |

|
#17
Poplar Ave
Moundsville, WV 26041
|
840 sq. feet
|
1 baths 2 beds |
show details | |

|
#18
Sunset Dr
Martins Ferry, OH 43935
|
976 sq. feet
|
1 baths 3 beds |
show details | |

|
#19
1st St
Moundsville, WV 26041
|
2,162 sq. feet
|
2 baths 3 beds |
show details | |

|
#20
Linden Ave
Moundsville, WV 26041
|
1,050 sq. feet
|
1 baths 2 beds |
show details |
| Photo | Address | Area | Beds / Baths | Price | Details |
|---|---|---|---|---|---|

|
#21
N Moss Run Rd
Bellaire, OH 43906
|
1,094 sq. feet
|
1 baths 3 beds |
show details | |

|
#22
Reasbeck Grove Rd
Martins Ferry, OH 43935
|
1,584 sq. feet
|
1 baths 2 beds |
show details | |

|
#23
1/2 Nixon Run Rd
Martins Ferry, OH 43935
|
918 sq. feet
|
1 baths 3 beds |
show details | |

|
#24
Blaine Chermont Rd
Bridgeport, OH 43912
|
1,092 sq. feet
|
1 baths 3 beds |
show details | |

|
#25
Chapel Rd
Wheeling, WV 26003
|
1,666 sq. feet
|
2 baths 3 beds |
show details | |

|
#26
Colerain Pike
Martins Ferry, OH 43935
|
1,664 sq. feet
|
1 baths 3 beds |
show details | |

|
#27
W 42nd St
Shadyside, OH 43947
|
823 sq. feet
|
1 baths 2 beds |
show details | |

|
#28
Sterling Ave
Bridgeport, OH 43912
|
1,400 sq. feet
|
1 baths 3 beds |
show details | |

|
#29
Central Ave
Shadyside, OH 43947
|
1,134 sq. feet
|
1 baths 2 beds |
show details | |

|
#30
Boyd Ridge Rd
Bellaire, OH 43906
|
1,395 sq. feet
|
1 baths 3 beds |
show details |
| Photo | Address | Area | Beds / Baths | Price | Details |
|---|---|---|---|---|---|

|
#31
Chestnut Ln
Wheeling, WV 26003
|
1,176 sq. feet
|
2 baths 3 beds |
show details | |

|
#32
Anna Dr
Saint Clairsville, OH 43950
|
2,208 sq. feet
|
2 baths 4 beds |
show details | |

|
#33
Mount Victory Rd
Powhatan Point, OH 43942
|
1,544 sq. feet
|
1 baths 3 beds |
show details | |

|
#34
County Road 19
Mingo Junction, OH 43938
|
816 sq. feet
|
1 baths 2 beds |
show details | |

|
#35
Pleasant Grove Rd
Claysville, PA 15323
|
1,620 sq. feet
|
1 baths 1 beds |
show details | |

|
#36
N Ray Rd
Saint Clairsville, OH 43950
|
1,568 sq. feet
|
2 baths 3 beds |
show details | |

|
#37
Bannock Uniontown Rd
Saint Clairsville, OH 43950
|
1,312 sq. feet
|
1 baths 2 beds |
show details | |

|
#38
4th St
Brilliant, OH 43913
|
1,248 sq. feet
|
1 baths 3 beds |
show details | |

|
#39
4th St
Brilliant, OH 43913
|
1,196 sq. feet
|
1 baths 3 beds |
show details | |

|
#40
Labelle St
Brilliant, OH 43913
|
2,268 sq. feet
|
2 baths 6 beds |
show details |
| Photo | Address | Area | Beds / Baths | Price | Details |
|---|---|---|---|---|---|

|
#41
Labelle St
Brilliant, OH 43913
|
1,785 sq. feet
|
1 baths 2 beds |
show details | |

|
#42
Gilchrist St
Brilliant, OH 43913
|
816 sq. feet
|
1 baths 3 beds |
show details | |

|
#43
Meadow View Dr
Saint Clairsville, OH 43950
|
1,362 sq. feet
|
2 baths 3 beds |
show details | |

|
#44
Barton Crescent Rd
Saint Clairsville, OH 43950
|
1,340 sq. feet
|
1 baths 3 beds |
show details | |

|
#45
Ealy Rd
West Alexander, PA 15376
|
2,168 sq. feet
|
2 baths 3 beds |
show details | |

|
#46
Township Road 115
Dillonvale, OH 43917
|
1,220 sq. feet
|
1 baths 3 beds |
show details | |

|
#47
State Route 150
Dillonvale, OH 43917
|
916 sq. feet
|
1 baths 1 beds |
show details | |

|
#48
Crestview Ln
Saint Clairsville, OH 43950
|
3,172 sq. feet
|
2 baths 4 beds |
show details | |

|
#49
S Sugar St
Saint Clairsville, OH 43950
|
1,234 sq. feet
|
2 baths 3 beds |
show details | |

|
Check over 1 million property listings on Foreclosure.com!
|
browse all offers | |||

Latest news about housing in Bethlehem, WV collected exclusively by city-data.com from local newspapers, TV, and radio stations

 | Wheeling/Weirton/Northern Panhandle News & Information (309 replies) |
| Should I move to WV? (16 replies) |
| I-81 Corridor and Eastern Panhandle Sub-Forum? (25 replies) |
| What is New Martinsville like? (8 replies) |
| Commuting from Morgantown to Wheeling? (10 replies) |

Median year apartment built: 1971
Household type by relationship:
Households: 2,551- Male householders: 541 (74 living alone), Female householders: 508 (183 living alone)
613 spouses (613 opposite-sex spouses), 42 unmarried partners, (42 opposite-sex unmarried partners), 778 children (716 natural, 37 adopted, 23 stepchildren), 37 grandchildren, 0 brothers or sisters, 6 parents, 0 foster children, 21 other relatives, 0 non-relatives
Size of family households: 404 2-persons, 165 3-persons, 172 4-persons, 37 5-persons, 5 6-persons.
Size of nonfamily households: 266 1-person, 36 2-persons.
537 married couples with children.
51 single-parent households (27 men, 24 women).
96.3% of residents of Bethlehem speak English at home.
1.9% of residents speak Spanish at home (100% speak English very well).
1.1% of residents speak other Indo-European language at home (20% speak English very well, 56% speak English well, 24% speak English not well).
0.1% of residents speak Asian or Pacific Island language at home (100% speak English very well).
Foreign born population: 37 (1.5%)
(81.1% of them are naturalized citizens)
| Here: | 7.1 |
| State: | 6.5 |
| Here: | 4.9 |
| State: | 4.7 |

- Bedrooms in owner-occupied houses and condos in Bethlehem, West Virginia
- 5no bedroom
- 51 bedroom
- 1532 bedrooms
- 5873 bedrooms
- 1624 bedrooms
- 255+ bedrooms

- Bedrooms in renter-occupied apartments in Bethlehem, West Virginia
- 0no bedroom
- 301 bedroom
- 742 bedrooms
- 493 bedrooms
- 04 bedrooms
- 05+ bedrooms

- Cars and other vehicles available in Bethlehem in owner-occupied houses/condos
- 23no vehicle
- 2501 vehicle
- 4782 vehicles
- 1443 vehicles
- 344 vehicles
- 95+ vehicles

- Cars and other vehicles available in Bethlehem in renter-occupied apartments
- 30no vehicle
- 461 vehicle
- 662 vehicles
- 113 vehicles
- 04 vehicles
- 05+ vehicles

- Rooms in owner-occupied houses in Bethlehem, West Virginia
- 51 room
- 02 rooms
- 43 rooms
- 274 rooms
- 1375 rooms
- 2326 rooms
- 1397 rooms
- 1648 rooms
- 2309+ rooms

- Rooms in renter-occupied apartments in Bethlehem, West Virginia
- 01 room
- 132 rooms
- 103 rooms
- 434 rooms
- 265 rooms
- 316 rooms
- 67 rooms
- 248 rooms
- 09+ rooms


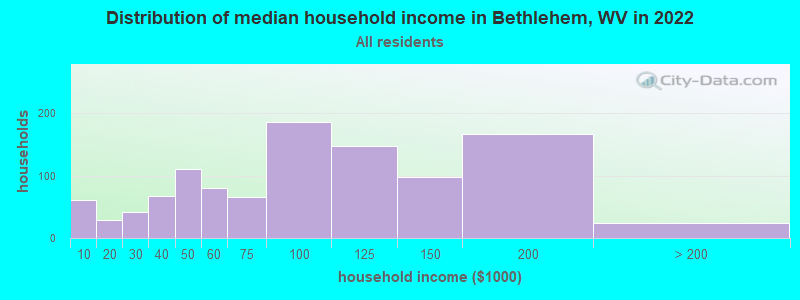
Bethlehem, WV household income distribution

- 61Less than $10,000
- 29$10,000 to $19,999
- 42$20,000 to $29,999
- 68$30,000 to $39,999
- 111$40,000 to $49,999
- 80$50,000 to $59,999
- 65$60,000 to $74,999
- 186$75,000 to $99,999
- 147$100,000 to $124,999
- 98$125,000 to $149,999
- 167$150,000 to $199,999
- 24$200,000 or more
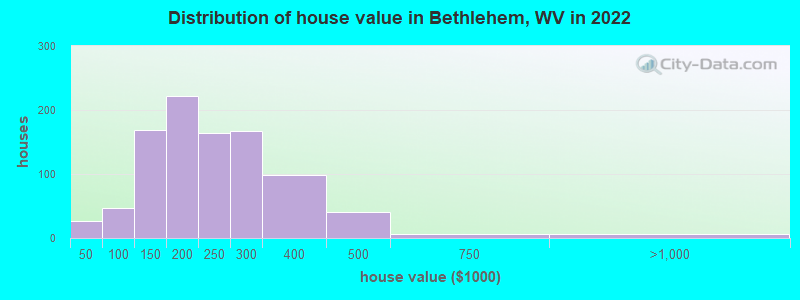
Home value of owner - occupied houses in 2022 in Bethlehem, WV
-
- 3Less than $10,000
- 8$10,000 to $14,999
- 8$15,000 to $19,999
- 5$25,000 to $29,999
- 6$50,000 to $59,999
- 12$60,000 to $69,999
- 7$70,000 to $79,999
- 9$80,000 to $89,999
- 11$90,000 to $99,999
- 113$100,000 to $124,999
- 54$125,000 to $149,999
- 96$150,000 to $174,999
- 125$175,000 to $199,999
- 163$200,000 to $249,999
- 166$250,000 to $299,999
- 97$300,000 to $399,999
- 41$400,000 to $499,999
- 5$500,000 to $749,999
- 6$750,000 to $999,999
Rent paid by renters in 2022 in Bethlehem, WV
-
- 4$250 to $299
- 8$400 to $449
- 6$750 to $799
- 39$800 to $899
- 23$900 to $999
- 45$1,000 to $1,249
- 5$1,250 to $1,499
- 11No cash rent


Percentage of workers working in this county: 71.3%
Number of people working at home: 129 (10.5% of all workers)
Travel time to work (commute)
- Less than 5 minutes: 7
- 5 to 9 minutes: 211
- 10 to 14 minutes: 266
- 15 to 19 minutes: 211
- 20 to 24 minutes: 121
- 25 to 29 minutes: 28
- 30 to 34 minutes: 72
- 35 to 39 minutes: 14
- 40 to 44 minutes: 35
- 45 to 59 minutes: 70
- 60 to 89 minutes: 25
- 90 or more minutes: 27
Means of transportation to work:
- Drove a car alone: 1,091 (85.6%)
- Carpooled: 126 (9.9%)
- Bus or trolley bus: 21 (1.6%)
- Walked: 6 (0.5%)
- Other means: 4 (0.3%)
- Worked at home: 27 (2.1%)

- Unemployment by race in 2022
- Unemployment rate for White non-Hispanic residents
- 4.1%Males

- Year of entry for the foreign-born population in Bethlehem, West Virginia
- 92010 or later
- 02000 to 2009
- 201990 to 1999
- 01980 to 1989
- 51970 to 1979
- 12Before 1970
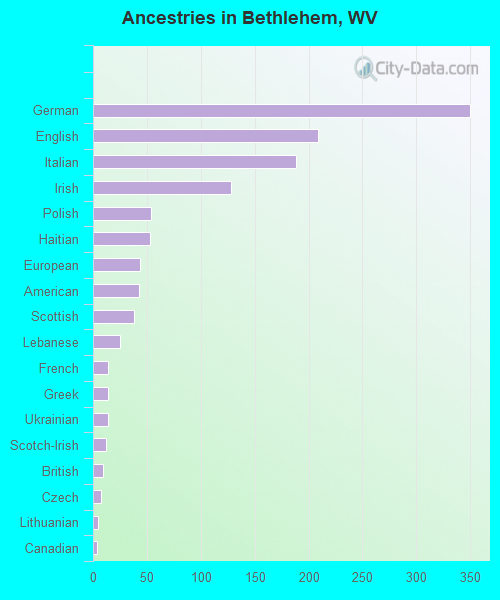
First ancestries reported:
- German: 350 (29.0%)
- English: 209 (17.3%)
- Italian: 188 (15.6%)
- Irish: 128 (10.6%)
- Polish: 54 (4.5%)
- Haitian: 53 (4.4%)
- European: 44 (3.6%)
- American: 43 (3.6%)
- Scottish: 38 (3.1%)
- Lebanese: 25 (2.1%)
- French: 14 (1.2%)
- Greek: 14 (1.2%)
- Ukrainian: 14 (1.2%)
- Scotch-Irish: 12 (1.0%)
- British: 9 (0.7%)
- Czech: 7 (0.6%)
- Lithuanian: 5 (0.4%)
- Canadian: 4 (0.3%)
Most common places of birth for foreign-born residents (%):
| Bethlehem: | 85.3% (29) |
| West Virginia: | 0.2% (50) |
| Bethlehem: | 11.8% (4) |
| West Virginia: | 4.3% (1,233) |
Place of birth for U.S.-born residents:
- This state: 1,654
- Other state: 862
- Northeast: 213
- Midwest: 366
- South: 252
- West: 23
93.7% of Bethlehem residents lived in the same house 1 years ago.
Out of people who lived in different houses, 8.2% lived in this county.
Out of people who lived in different counties, 61.3% lived in West Virginia.
| Bethlehem: | 93.7% |
| State average: | 89.6% |
Education attainment for males 25 years and older:
- No schooling: 0
- Nursery to 4th grade: 0
- 5th and 6th grade: 0
- 7th and 8th grade: 5
- 9th grade: 0
- 10th grade: 0
- 11th grade: 4
- 12th grade, no diploma: 0
- High school graduate (or equivalency): 171
- Less than 1 year of college: 53
- Some college more than 1 year, no degree: 106
- Associate degree: 79
- Bachelor's degree: 261
- Master's degree: 158
- Professional school degree: 19
- Doctorate degree: 17

Education attainment for females 25 years and older:
- No schooling: 0
- Nursery to 4th grade: 0
- 5th and 6th grade: 0
- 7th and 8th grade: 6
- 9th grade: 0
- 10th grade: 0
- 11th grade: 0
- 12th grade, no diploma: 0
- High school graduate (or equivalency): 271
- Less than 1 year of college: 47
- Some college more than 1 year, no degree: 105
- Associate degree: 141
- Bachelor's degree: 245
- Master's degree: 182
- Professional school degree: 8
- Doctorate degree: 21


Housing units in structures:
- One, detached: 1,022
- Two: 7
- 5 to 9: 7
- 10 to 19: 26
- 20 to 49: 75
- 50 or more: 6
- Mobile homes: 5
Housing units lacking complete kitchen facilities in 2022: 2.5%
House/condo owner moved in on average 11 years ago
Renter moved in on average 2 years ago

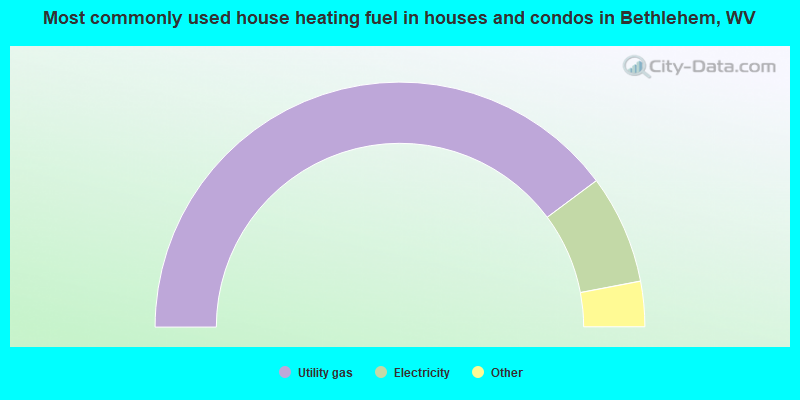
- 79.7%Utility gas
- 14.4%Electricity
- 3.5%Bottled, tank, or LP gas
- 2.4%Wood
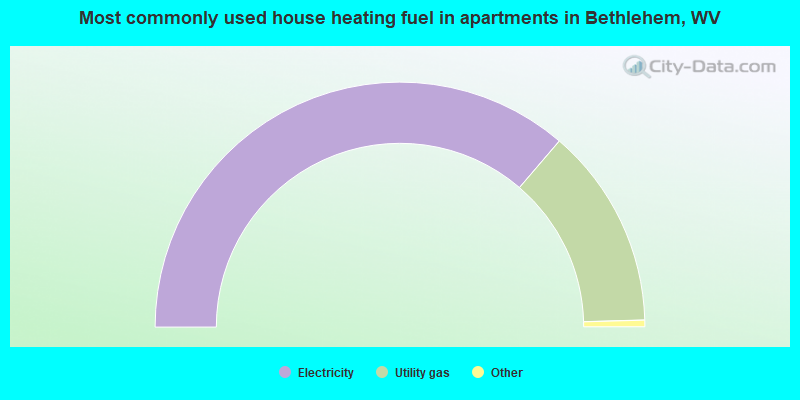
- 73.2%Electricity
- 26.8%Utility gas
Private vs. public school enrollment:
| Here: | 25.7% |
| West Virginia: | 12.2% |
| Here: | 22.9% |
| West Virginia: | 8.8% |
| Here: | 18.9% |
| West Virginia: | 17.3% |


