Beverly, MA (Massachusetts) Houses and Residents
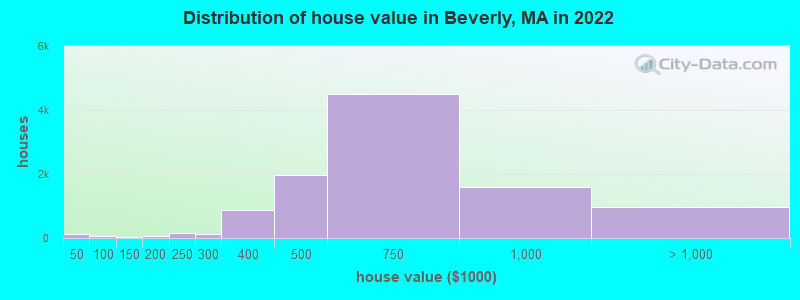
Estimated median house or condo value in 2022: $617,690 (it was $220,100 in 2000 )
Beverly:
$617,690Massachusetts:
$534,700
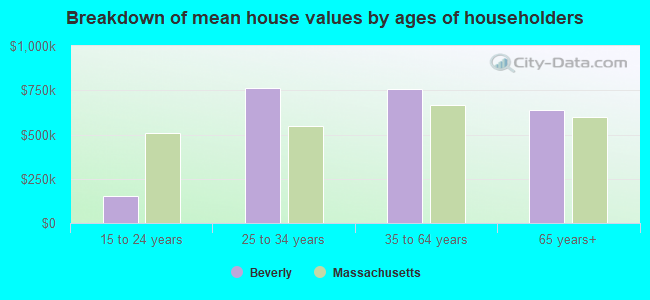
Lower value quartile - upper value quartile: $459,137 - $765,555Mean price in 2022: Detached houses: $736,970 Here:
$736,970State:
$651,570
Townhouses or other attached units: $425,529 Here:
$425,529State:
$617,749
In 2-unit structures: $453,333 Here:
$453,333State:
$594,808
In 3-to-4-unit structures: $433,980 Here:
$433,980State:
$601,912
In 5-or-more-unit structures: $334,673 Here:
$334,673State:
$555,768
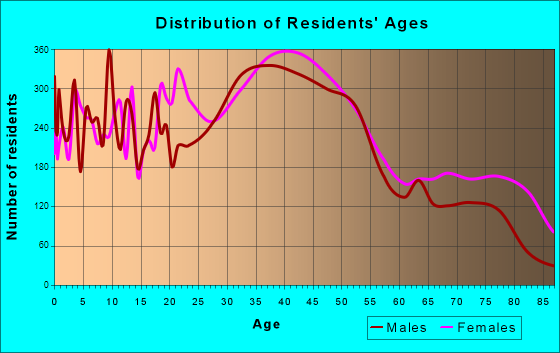
Total population: 40,952 (Urban population: 39,862, Rural population: 0)
Houses: 17,830 (17,075 occupied: 10,288 owner occupied, 6,835 renter occupied )
% of renters here:
40%State:
38%
Housing density: 1,074 houses/condos per square mile
Median price asked for vacant for-sale houses and condos in 2022: $5,750,342.
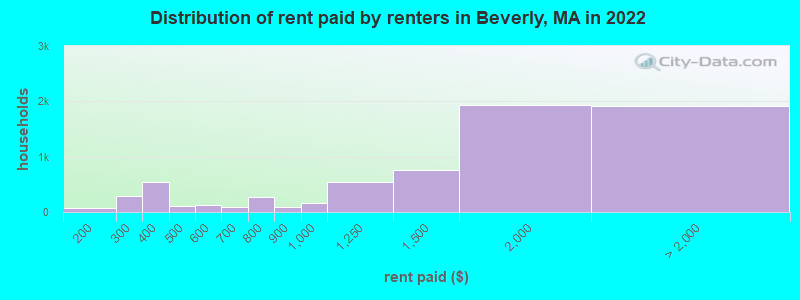
Median contract rent in 2022: $1,591 (lower quartile is $896, upper quartile is over $2,000)
Median rent asked for vacant for-rent units in 2022: $1,966
Median gross rent in Beverly, MA in 2022: $1,739
Housing units in Beverly with a mortgage: 7,736 (1,160 second mortgage, 21 home equity loan, 1,138 both second mortgage and home equity loan )Houses without a mortgage: 183
Median household income for houses/condos with a mortgage: $161,064
Median household income for apartments without a mortgage: $82,986
Median monthly housing costs: $2,002
Data:
Median house or condo value ($)
Median house or condo value ($ change since 2000)
Median house or condo value ($) - White
Median house or condo value ($) - Black or African American
Median house or condo value ($) - Asian
Median house or condo value ($) - Hispanic or Latino
Median house or condo value ($) - American Indian and Alaska Native
Median house or condo value ($) - Multirace
Median house or condo value ($) - Other Race
Median price asked for mobile homes ($)
Household density (households per square mile)
Mean house or condo value by units in structure - 1, detached ($)
Mean house or condo value by units in structure - 1, attached ($)
Mean house or condo value by units in structure - 2 ($)
Mean house or condo value by units in structure by units in structure - 3 or 4 ($)
Mean house or condo value by units in structure - 5 or more ($)
Mean house or condo value by units in structure - Boat, RV, van, etc. ($)
Mean house or condo value by units in structure - Mobile home ($)
Median contract rent ($)
Median contract rent - Lower quartile ($)
Median contract rent - Upper quartile ($)
Median gross rent ($)
Urban houses (%)
Rural houses (%)
Houses occupied (%)
Houses occupied (% change since 2000)
Houses owner occupied (%)
Houses owner occupied (% change since 2000)
Houses renter occupied (%)
Houses renter occupied (% change since 2000)
Vacant housing units - For rent (%)
Vacant housing units - For rent (% change since 2000)
Vacant housing units - For sale only (%)
Vacant housing units - For sale only (% change since 2000)
Vacant housing units - Rented or sold, not occupied (%)
Vacant housing units - Rented or sold, not occupied (% change since 2000)
Vacant housing units - For seasonal, recreational, or occasional use (%)
Vacant housing units - For seasonal, recreational, or occasional use (% change since 2000)
Vacant housing units - For migrant workers (%)
Vacant housing units - For migrant workers (% change since 2000)
Vacant housing units - Other vacant (%)
Vacant housing units - Other vacant (% change since 2000)
Median monthly housing costs ($)
Median household income for houses/condos with a mortgage ($)
Median household income for houses/condos without a mortgage ($)
Median household income ($)
Median household income ($) - White
Median household income ($) - Black or African American
Median household income ($) - Asian
Median household income ($) - Hispanic or Latino
Median household income ($) - American Indian and Alaska Native
Median household income ($) - Multirace
Median household income ($) - Other Race
Mortgage status - with mortgage (%)
Mortgage status - with second mortgage (%)
Mortgage status - with home equity loan (%)
Mortgage status - with both second mortgage and home equity loan (%)
Mortgage status - without a mortgage (%)
Median year house/condo built
Median year apartment built
Household type by relationship - Male householder living alone (%)
Household type by relationship - Male householder not living alone (%)
Household type by relationship - Female householder living alone (%)
Household type by relationship - Female householder not living alone (%)
Household type by relationship - Opposite-Sex spouse (%)
Household type by relationship - Same-Sex spouse (%)
Household type by relationship - Opposite-Sex unmarried partner (%)
Household type by relationship - Same-Sex unmarried partner (%)
Household type by relationship - In group quarters (%)
Size of family households - 2-person household (%)
Size of family households - 3-person household (%)
Size of family households - 4-person household (%)
Size of family households - 5-person household (%)
Size of family households - 6-person household (%)
Size of family households - 7-or-more-person household (%)
Size of nonfamily households - 1-person household (%)
Size of nonfamily households - 2-person household (%)
Size of nonfamily households - 3-person household (%)
Size of nonfamily households - 4-person household (%)
Size of nonfamily households - 5-person household (%)
Size of nonfamily households - 6-person household (%)
Size of nonfamily households - 7-or-moreperson household (%)
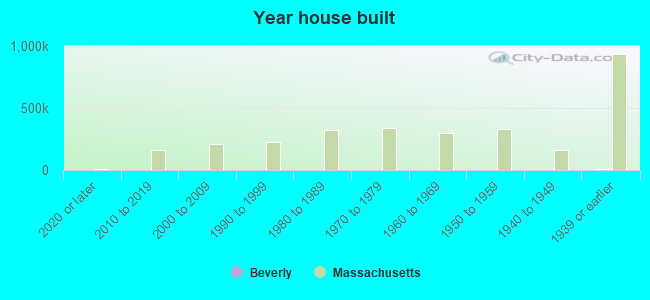
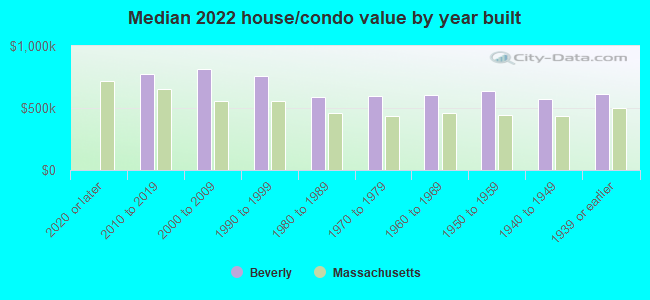
Year house built - Built 2010 or later (%)
Year house built - Built 2000 to 2009 (%)
Year house built - Built 1990 to 1999 (%)
Year house built - Built 1980 to 1989 (%)
Year house built - Built 1970 to 1979 (%)
Year house built - Built 1960 to 1969 (%)
Year house built - Built 1950 to 1959 (%)
Year house built - Built 1940 to 1949 (%)
Year house built - Built 1939 or earlier (%)
Median number of rooms in houses and condos
Median number of rooms in apartments
Median number of bedrooms in owner occupied houses
Mean number of bedrooms in owner occupied houses
Median number of bedrooms in renter occupied houses
Mean number of bedrooms in renter occupied houses
Median number of vehichles in owner occupied houses
Mean number of vehichles in owner occupied houses
Median number of vehichles in renter occupied houses
Mean number of vehichles in renter occupied houses
Rooms in owner-occupied houses - 1 room (%)
Rooms in owner-occupied houses - 2 rooms (%)
Rooms in owner-occupied houses - 3 rooms (%)
Rooms in owner-occupied houses - 4 rooms (%)
Rooms in owner-occupied houses - 5 rooms (%)
Rooms in owner-occupied houses - 6 rooms (%)
Rooms in owner-occupied houses - 7 rooms (%)
Rooms in owner-occupied houses - 8 rooms (%)
Rooms in owner-occupied houses - 9+ rooms (%)
Rooms in renter-occupied houses - 1 room (%)
Rooms in renter-occupied houses - 2 rooms (%)
Rooms in renter-occupied houses - 3 rooms (%)
Rooms in renter-occupied houses - 4 rooms (%)
Rooms in renter-occupied houses - 5 rooms (%)
Rooms in renter-occupied houses - 6 rooms (%)
Rooms in renter-occupied houses - 7 rooms (%)
Rooms in renter-occupied houses - 8 rooms (%)
Rooms in renter-occupied houses - 9+ rooms (%)
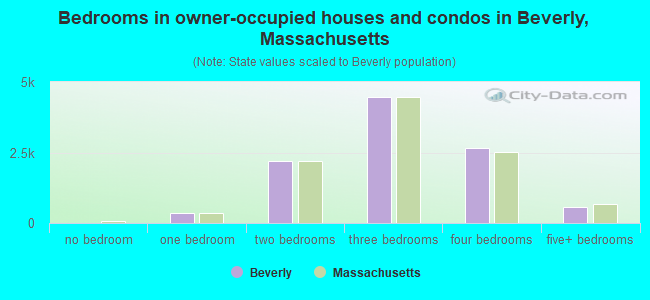
Bedrooms in owner-occupied houses - no bedrooms (%)
Bedrooms in owner-occupied houses - 1 bedroom (%)
Bedrooms in owner-occupied houses - 2 bedrooms (%)
Bedrooms in owner-occupied houses - 3 bedrooms (%)
Bedrooms in owner-occupied houses - 4 bedrooms (%)
Bedrooms in owner-occupied houses - 5+ bedrooms (%)
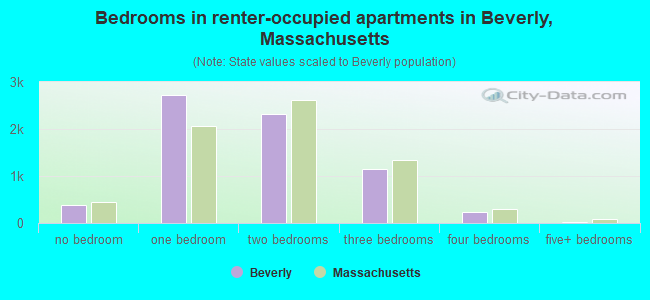
Bedrooms in renter-occupied houses - no bedrooms (%)
Bedrooms in renter-occupied houses - 1 bedroom (%)
Bedrooms in renter-occupied houses - 2 bedrooms (%)
Bedrooms in renter-occupied houses - 3 bedrooms (%)
Bedrooms in renter-occupied houses - 4 bedrooms (%)
Bedrooms in renter-occupied houses - 5+ bedrooms (%)
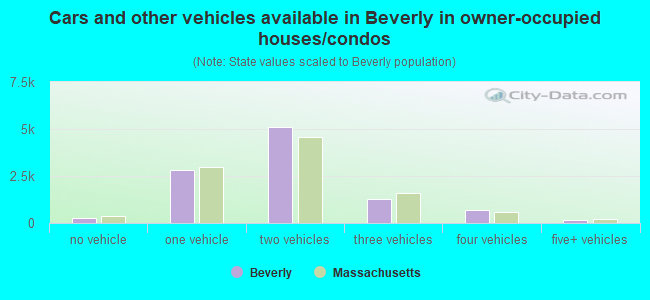
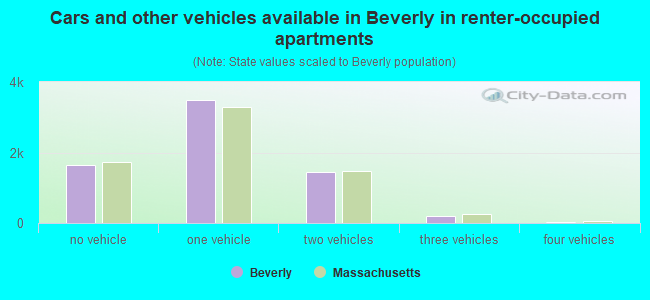
Vehicles available in owner-occupied houses - no vehicle available (%)
Vehicles available in owner-occupied houses - 1 vehicle available(%)
Vehicles available in owner-occupied houses - 2 Vehicles available (%)
Vehicles available in owner-occupied houses - 3 Vehicles available (%)
Vehicles available in owner-occupied houses - 4 Vehicles available (%)
Vehicles available in owner-occupied houses - 5+ Vehicles available (%)
Vehicles available in renter-occupied houses - no vehicle available (%)
Vehicles available in renter-occupied houses - 1 vehicle available (%)
Vehicles available in renter-occupied houses - 2 Vehicles available (%)
Vehicles available in renter-occupied houses - 3 Vehicles available (%)
Vehicles available in renter-occupied houses - 4 Vehicles available (%)
Vehicles available in renter-occupied houses - 5+ Vehicles available (%)
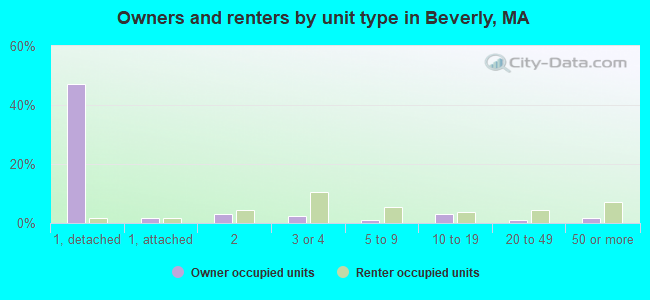
Housing units in structures - 1, detached (%)
Housing units in structures - 1, attached (%)
Housing units in structures - 2 (%)
Housing units in structures - 3 or 4 (%)
Housing units in structures - 5 to 9 (%)
Housing units in structures - 10 to 19 (%)
Housing units in structures - 20 to 49 (%)
Housing units in structures - 50 or more (%)
Housing units in structures - Mobile home (%)
Housing units in structures - Boat, RV, van, etc. (%)
Housing units in structures - Owners - 1, detached (%)
Housing units in structures - Owners - 1, attached (%)
Housing units in structures - Owners - 2 (%)
Housing units in structures - Owners - 3 or 4 (%)
Housing units in structures - Owners - 5 to 9 (%)
Housing units in structures - Owners - 10 to 19 (%)
Housing units in structures - Owners - 20 to 49 (%)
Housing units in structures - Owners - 50 or more (%)
Housing units in structures - Owners - Mobile home (%)
Housing units in structures - Owners - Boat, RV, van, etc. (%)
Housing units in structures - Renters - 1, detached (%)
Housing units in structures - Renters - 1, attached (%)
Housing units in structures - Renters - 2 (%)
Housing units in structures - Renters - 3 or 4 (%)
Housing units in structures - Renters - 5 to 9 (%)
Housing units in structures - Renters - 10 to 19 (%)
Housing units in structures - Renters - 20 to 49 (%)
Housing units in structures - Renters - 50 or more (%)
Housing units in structures - Renters - Mobile home (%)
Housing units in structures - Renters - Boat, RV, van, etc. (%)
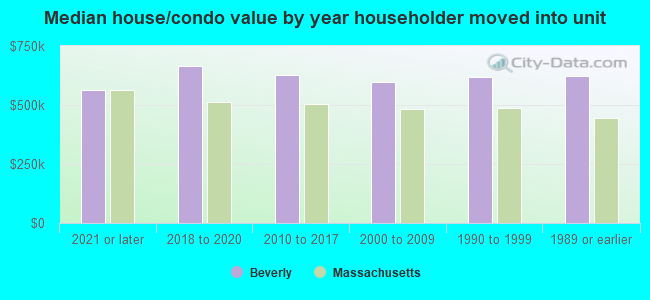
House/condo owner moved in on average (years ago)
Renter moved in on average (years ago)
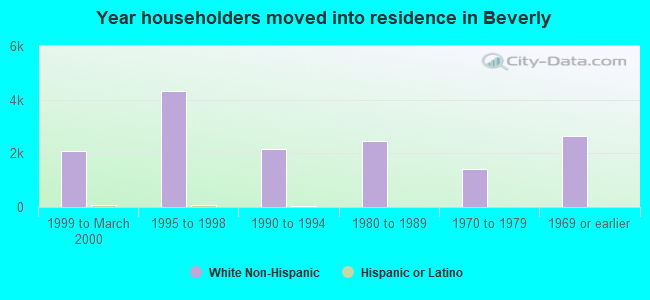
Year householder moved into unit - Moved in 1999 to March 2000 (%)
Year householder moved into unit - Moved in 1999 to March 2000 (%) - White
Year householder moved into unit - Moved in 1999 to March 2000 (%) - Black or African American
Year householder moved into unit - Moved in 1999 to March 2000 (%) - Asian
Year householder moved into unit - Moved in 1999 to March 2000 (%) - Hispanic or Latino
Year householder moved into unit - Moved in 1999 to March 2000 (%) - American Indian and Alaska Native
Year householder moved into unit - Moved in 1999 to March 2000 (%) - Multirace
Year householder moved into unit - Moved in 1999 to March 2000 (%) - Other Race
Year householder moved into unit - Moved in 1995 to 1998 (%)
Year householder moved into unit - Moved in 1995 to 1998 (%) - White
Year householder moved into unit - Moved in 1995 to 1998 (%) - Black or African American
Year householder moved into unit - Moved in 1995 to 1998 (%) - Asian
Year householder moved into unit - Moved in 1995 to 1998 (%) - Hispanic or Latino
Year householder moved into unit - Moved in 1995 to 1998 (%) - American Indian and Alaska Native
Year householder moved into unit - Moved in 1995 to 1998 (%) - Multirace
Year householder moved into unit - Moved in 1995 to 1998 (%) - Other Race
Year householder moved into unit - Moved in 1990 to 1994 (%)
Year householder moved into unit - Moved in 1990 to 1994 (%) - White
Year householder moved into unit - Moved in 1990 to 1994 (%) - Black or African American
Year householder moved into unit - Moved in 1990 to 1994 (%) - Asian
Year householder moved into unit - Moved in 1990 to 1994 (%) - Hispanic or Latino
Year householder moved into unit - Moved in 1990 to 1994 (%) - American Indian and Alaska Native
Year householder moved into unit - Moved in 1990 to 1994 (%) - Multirace
Year householder moved into unit - Moved in 1990 to 1994 (%) - Other Race
Year householder moved into unit - Moved in 1980 to 1989 (%)
Year householder moved into unit - Moved in 1980 to 1989 (%) - White
Year householder moved into unit - Moved in 1980 to 1989 (%) - Black or African American
Year householder moved into unit - Moved in 1980 to 1989 (%) - Asian
Year householder moved into unit - Moved in 1980 to 1989 (%) - Hispanic or Latino
Year householder moved into unit - Moved in 1980 to 1989 (%) - American Indian and Alaska Native
Year householder moved into unit - Moved in 1980 to 1989 (%) - Multirace
Year householder moved into unit - Moved in 1980 to 1989 (%) - Other Race
Year householder moved into unit - Moved in 1970 to 1979 (%)
Year householder moved into unit - Moved in 1970 to 1979 (%) - White
Year householder moved into unit - Moved in 1970 to 1979 (%) - Black or African American
Year householder moved into unit - Moved in 1970 to 1979 (%) - Asian
Year householder moved into unit - Moved in 1970 to 1979 (%) - Hispanic or Latino
Year householder moved into unit - Moved in 1970 to 1979 (%) - American Indian and Alaska Native
Year householder moved into unit - Moved in 1970 to 1979 (%) - Multirace
Year householder moved into unit - Moved in 1970 to 1979 (%) - Other Race
Year householder moved into unit - Moved in 1969 or earlier (%)
Year householder moved into unit - Moved in 1969 or earlier (%) - White
Year householder moved into unit - Moved in 1969 or earlier (%) - Black or African American
Year householder moved into unit - Moved in 1969 or earlier (%) - Asian
Year householder moved into unit - Moved in 1969 or earlier (%) - Hispanic or Latino
Year householder moved into unit - Moved in 1969 or earlier (%) - American Indian and Alaska Native
Year householder moved into unit - Moved in 1969 or earlier (%) - Multirace
Year householder moved into unit - Moved in 1969 or earlier (%) - Other Race
Housing units lacking complete plumbing facilities (%)
Housing units lacking complete kitchen facilities (%)
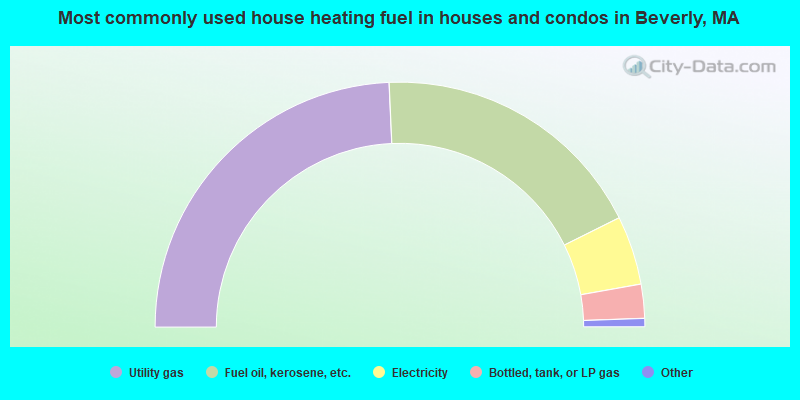
House heating fuel used in houses and condos - Utility gas (%)
House heating fuel used in houses and condos - Bottled, tank, or LP gas (%)
House heating fuel used in houses and condos - Electricity (%)
House heating fuel used in houses and condos - Fuel oil, kerosene, etc. (%)
House heating fuel used in houses and condos - Coal or coke (%)
House heating fuel used in houses and condos - Wood (%)
House heating fuel used in houses and condos - Solar energy (%)
House heating fuel used in houses and condos - Other fuel (%)
House heating fuel used in houses and condos - No fuel used (%)
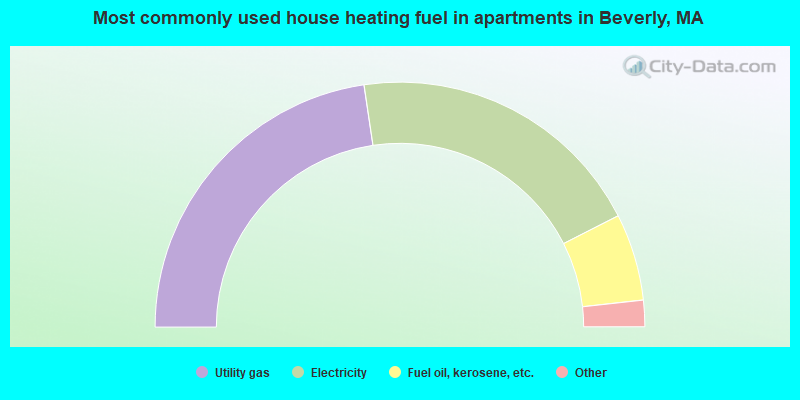
House heating fuel used in apartments - Utility gas (%)
House heating fuel used in apartments - Bottled, tank, or LP gas (%)
House heating fuel used in apartments - Electricity (%)
House heating fuel used in apartments - Fuel oil, kerosene, etc. (%)
House heating fuel used in apartments - Coal or coke (%)
House heating fuel used in apartments - Wood (%)
House heating fuel used in apartments - Solar energy (%)
House heating fuel used in apartments - Other fuel (%)
House heating fuel used in apartments - No fuel used (%)
Latest news about housing in Beverly, MA collected exclusively by city-data.com from local newspapers, TV, and radio stations
Median year house/condo built: 1954Median year apartment built: 1975Household type by relationship:
Households: 42,448
Male householders: 7,885 (1,921 living alone ), Female householders: 9,037 (3,350 living alone )8,049 spouses (7,840 opposite-sex spouses ), 1,420 unmarried partners , (1,313 opposite-sex unmarried partners ), 9,949 children (9,483 natural , 198 adopted , 267 stepchildren ), 634 grandchildren , 152 brothers or sisters , 387 parents , 128 foster children , 273 other relatives , 1,215 non-relatives In group quarters: 3,315
Size of family households: 4,367 2-persons , 2,494 3-persons , 2,173 4-persons , 656 5-persons , 170 6-persons , 6 7-or-more-persons .
Size of nonfamily households: 5,680 1-person , 1,254 2-persons , 259 3-persons , 58 4-persons , 7 7-or-more-persons .
4,743 married couples with children. single-parent households (403 men , 2,141 women ).
86.2% of residents of Beverly speak English at home. of residents speak Spanish at home (68% speak English very well , 14% speak English well , 11% speak English not well , 7% don't speak English at all ).of residents speak other Indo-European language at home (64% speak English very well , 23% speak English well , 11% speak English not well , 2% don't speak English at all ).of residents speak Asian or Pacific Island language at home (47% speak English very well , 35% speak English well , 16% speak English not well , 2% don't speak English at all ).of residents speak other language at home (64% speak English very well , 21% speak English well , 16% speak English not well ).
Foreign born population: 4,436 (10.5%)of them are naturalized citizens )
Median number of rooms in houses and condos:
Median number of rooms in apartments
Owner-occupied Renter-occupied
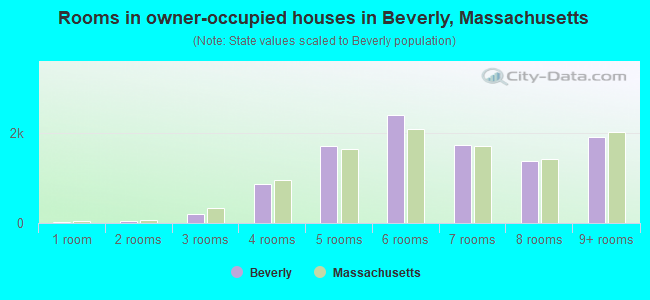
Rooms in owner-occupied houses in Beverly, Massachusetts
14 1 room 39 2 rooms 211 3 rooms 865 4 rooms 1,710 5 rooms 2,405 6 rooms 1,745 7 rooms 1,387 8 rooms 1,911 9+ rooms
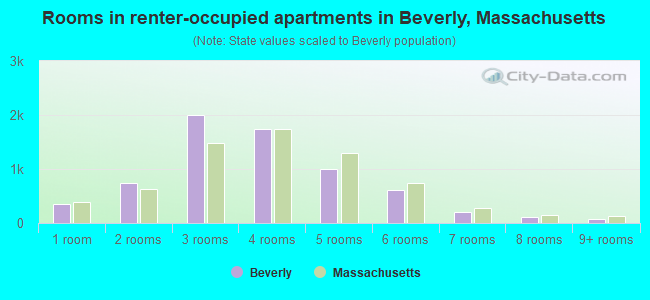
Rooms in renter-occupied apartments in Beverly, Massachusetts
348 1 room 749 2 rooms 1,997 3 rooms 1,745 4 rooms 1,002 5 rooms 604 6 rooms 207 7 rooms 113 8 rooms 71 9+ rooms
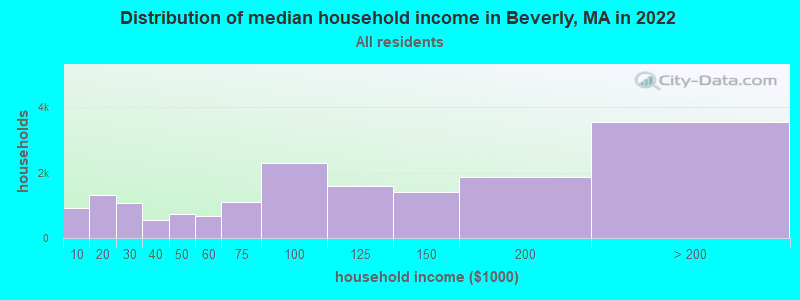
Beverly, MA household income distribution 927 Less than $10,0001,311 $10,000 to $19,9991,059 $20,000 to $29,999559 $30,000 to $39,999747 $40,000 to $49,999662 $50,000 to $59,9991,099 $60,000 to $74,9992,285 $75,000 to $99,9991,576 $100,000 to $124,9991,412 $125,000 to $149,9991,867 $150,000 to $199,9993,544 $200,000 or more
Home value of owner - occupied houses in 2022 in Beverly, MA 92 Less than $10,0007 $15,000 to $19,9993 $30,000 to $34,9996 $35,000 to $39,99929 $40,000 to $49,99913 $50,000 to $59,99913 $60,000 to $69,99919 $100,000 to $124,9996 $150,000 to $174,99957 $175,000 to $199,999141 $200,000 to $249,999115 $250,000 to $299,999869 $300,000 to $399,9991,953 $400,000 to $499,9994,512 $500,000 to $749,9991,604 $750,000 to $999,999492 $1,000,000 to $1,499,999248 $1,500,000 to $1,999,999225 $2,000,000 or moreRent paid by renters in 2022 in Beverly, MA 21 $100 to $14947 $150 to $19956 $200 to $249228 $250 to $299288 $300 to $349246 $350 to $39943 $400 to $44973 $450 to $49980 $500 to $54939 $550 to $59920 $600 to $64969 $650 to $69978 $700 to $749198 $750 to $79997 $800 to $899161 $900 to $999538 $1,000 to $1,249757 $1,250 to $1,4991,940 $1,500 to $1,9991,285 $2,000 to $2,499327 $2,500 to $2,99927 $3,000 to $3,49955 $3,500 or more223 No cash rent
Percentage of workers working in this county: 75.9%Number of people working at home: 4,948 (21.4% of all workers )
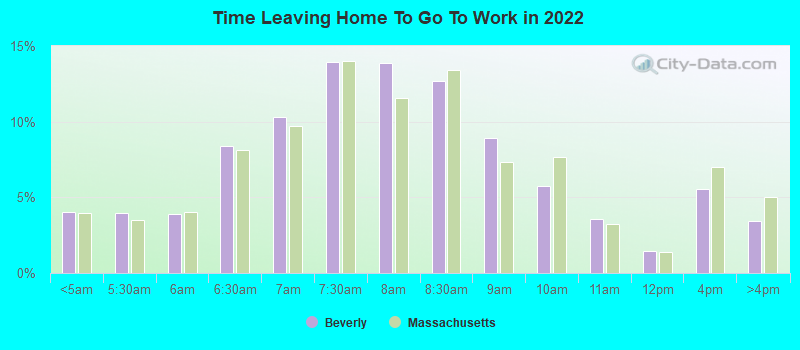
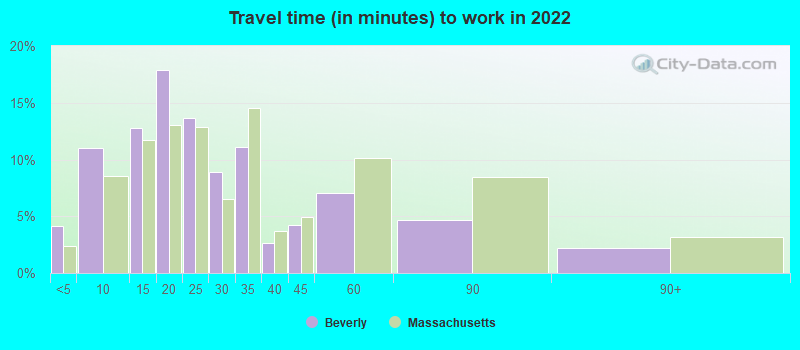
Travel time to work (commute)
Less than 5 minutes: 9505 to 9 minutes: 2,14810 to 14 minutes: 2,70015 to 19 minutes: 2,50320 to 24 minutes: 1,71625 to 29 minutes: 85130 to 34 minutes: 2,01035 to 39 minutes: 38640 to 44 minutes: 1,02245 to 59 minutes: 1,32660 to 89 minutes: 1,80990 or more minutes: 966
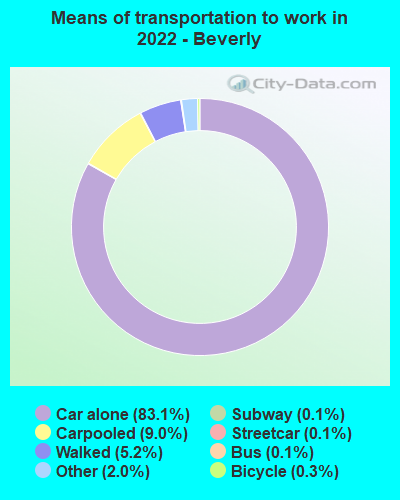
Means of transportation to work:
Drove a car alone: 17,003 (67.6%)Carpooled: 1,411 (5.6%)Bus : 23 (0.1%)Subway or elevated rail : 23 (0.1%)Long-distance train or commuter rail : 24 (0.1%)Taxi: 612 (2.4%)Bicycle: 95 (0.4%)Walked: 947 (3.8%)Worked at home: 4,948 (19.7%)
Unemployment by race in 2022
Unemployment rate for White non-Hispanic residents 2.1% Males1.4% FemalesUnemployment rate for Black residents 31.5% FemalesUnemployment rate for Asian residents 11.5% Males4.6% FemalesUnemployment rate for other race residents 10.0% MalesUnemployment rate for two or more race residents 0.8% MalesUnemployment rate for Hispanic or Latino residents 1.3% Males3.3% Females
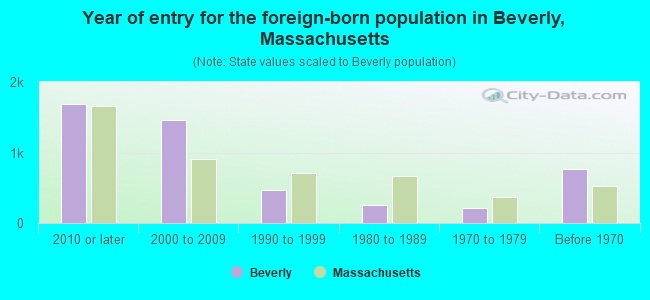
Year of entry for the foreign-born population in Beverly, Massachusetts
1,687 2010 or later 1,466 2000 to 2009 463 1990 to 1999 255 1980 to 1989 207 1970 to 1979 759 Before 1970
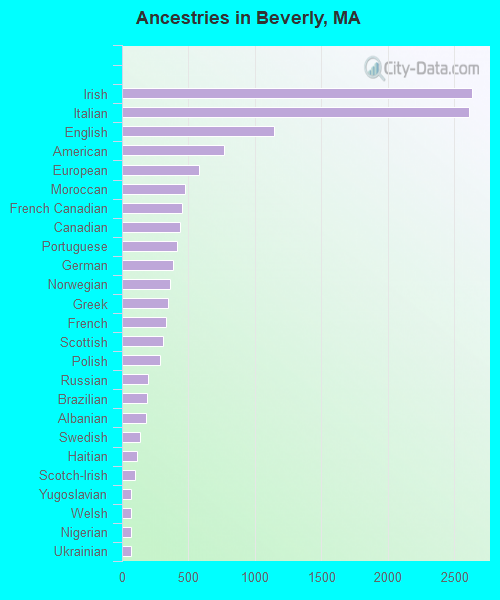
First ancestries reported:
Irish: 2,628 (16.0%)
Italian: 2,607 (15.8%)
English: 1,146 (7.0%)
American: 769 (4.7%)
European: 580 (3.5%)
Moroccan: 475 (2.9%)
French Canadian: 451 (2.7%)
Canadian: 433 (2.6%)
Portuguese: 410 (2.5%)
German: 385 (2.3%)
Norwegian: 358 (2.2%)
Greek: 346 (2.1%)
French: 329 (2.0%)
Scottish: 308 (1.9%)
Polish: 282 (1.7%)
Russian: 192 (1.2%)
Brazilian: 185 (1.1%)
Albanian: 180 (1.1%)
Swedish: 137 (0.8%)
Haitian: 112 (0.7%)
Scotch-Irish: 94 (0.6%)
Yugoslavian: 71 (0.4%)
Welsh: 69 (0.4%)
Nigerian: 67 (0.4%)
Ukrainian: 64 (0.4%)
Eastern European: 60 (0.4%)
British: 57 (0.3%)
Hungarian: 48 (0.3%)
Ugandan: 46 (0.3%)
Northern European: 36 (0.2%)
Dutch: 36 (0.2%)
Slovak: 33 (0.2%)
African: 30 (0.2%)
Swiss: 28 (0.2%)
Lithuanian: 25 (0.2%)
Finnish: 23 (0.1%)
Turkish: 21 (0.1%)
Armenian: 17 (0.1%)
Jordanian: 13 (0.08%)
Austrian: 13 (0.08%)
Jamaican: 9 (0.05%)
Trinidadian and Tobagonian: 9 (0.05%)
Czech: 8 (0.05%)
Cape Verdean: 6 (0.04%)
Syrian: 4 (0.02%)
Egyptian: 4 (0.02%)
Latvian: 4 (0.02%)
Slavic: 4 (0.02%)
Belgian: 3 (0.02%)
Most common places of birth for foreign-born residents (%): Brazil Beverly:
15.9% (680)Massachusetts:
7.6% (92,959)
Dominican Republic Beverly:
12.0% (515)Massachusetts:
8.3% (101,767)
Morocco Beverly:
5.5% (234)Massachusetts:
0.7% (8,562)
Albania Beverly:
4.9% (212)Massachusetts:
1.1% (13,076)
Canada Beverly:
4.9% (211)Massachusetts:
2.3% (28,158)
India Beverly:
4.0% (173)Massachusetts:
6.8% (82,934)
Costa Rica Beverly:
3.5% (152)Massachusetts:
0.2% (2,160)
Korea Beverly:
3.4% (145)Massachusetts:
1.4% (17,613)
Philippines Beverly:
2.7% (115)Massachusetts:
0.9% (10,810)
Ireland Beverly:
2.6% (113)Massachusetts:
1.1% (13,446)
Portugal Beverly:
2.4% (103)Massachusetts:
4.1% (50,360)
Australia Beverly:
2.3% (100)Massachusetts:
0.2% (2,666)
Afghanistan Beverly:
2.1% (92)Massachusetts:
0.1% (883)
Ukraine Beverly:
2.1% (91)Massachusetts:
0.9% (10,808)
Russia Beverly:
2.0% (84)Massachusetts:
1.5% (18,278)
Cuba Beverly:
1.8% (78)Massachusetts:
0.3% (3,711)
United Kingdom, excluding England and Scotland Beverly:
1.6% (69)Massachusetts:
1.0% (12,709)
Bosnia and Herzegovina Beverly:
1.6% (67)Massachusetts:
0.2% (1,916)
Place of birth for U.S.-born residents:
This state: 27,886Other state: 9,383Northeast: 5,557Midwest: 1,259South: 1,299West: 1,276 88.0% of Beverly residents lived in the same house 1 years ago.
Out of people who lived in different houses, 33.4% lived in this county.
Out of people who lived in different counties, 50.2% lived in Massachusetts.
Beverly:
88.0%State average:
87.7%
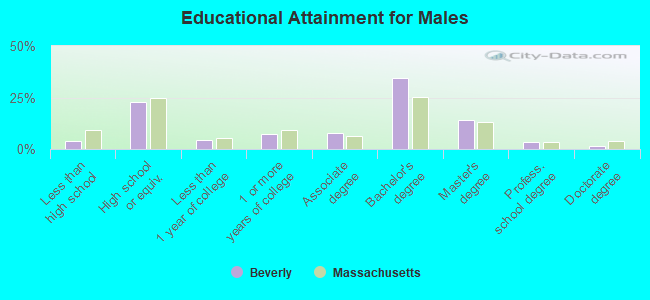
Education attainment for males 25 years and older:
No schooling: 111Nursery to 4th grade: 05th and 6th grade: 367th and 8th grade: 299th grade: 5910th grade: 15411th grade: 1612th grade, no diploma: 158High school graduate (or equivalency): 3,197Less than 1 year of college: 638Some college more than 1 year, no degree: 1,008Associate degree: 1,052Bachelor's degree: 4,817Master's degree: 1,977Professional school degree: 507Doctorate degree: 209
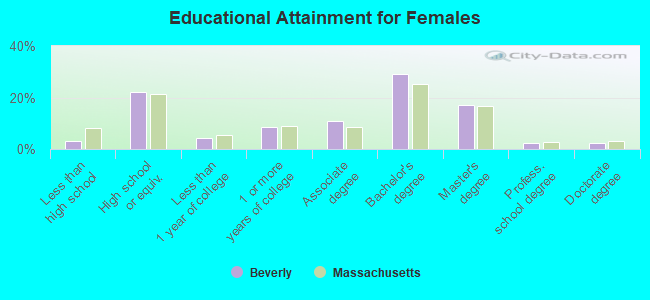
Education attainment for females 25 years and older:
No schooling: 71Nursery to 4th grade: 305th and 6th grade: 77th and 8th grade: 489th grade: 3010th grade: 2011th grade: 13312th grade, no diploma: 110High school graduate (or equivalency): 3,430Less than 1 year of college: 660Some college more than 1 year, no degree: 1,299Associate degree: 1,704Bachelor's degree: 4,513Master's degree: 2,636Professional school degree: 363Doctorate degree: 349
Housing units in structures:
One, detached: 8,679One, attached: 621Two: 1,3333 or 4: 2,2815 to 9: 1,21810 to 19: 1,28020 to 49: 1,00250 or more: 1,367Boats, RVs, vans, etc.: 45Housing units lacking complete plumbing facilities in 2022: 0.5%Housing units lacking complete kitchen facilities in 2022: 1.6%House/condo owner moved in on average 15 years ago
Renter moved in on average 1 years ago
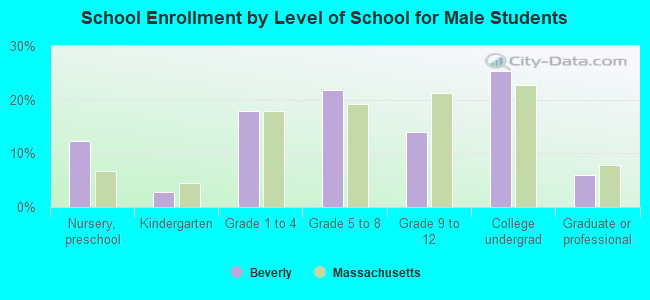
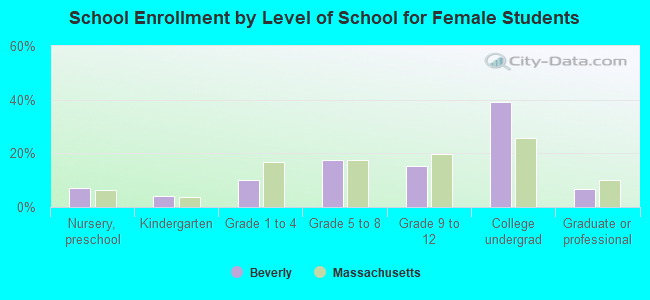
Private vs. public school enrollment:
Students in private schools in grades 1 to 8 (elementary and middle school): 603 Here:
17.3%Massachusetts:
10.3%
Students in private schools in grades 9 to 12 (high school): 349 Here:
22.4%Massachusetts:
12.3%
Students in private undergraduate colleges: 2,530 Here:
69.2%Massachusetts:
51.2%