Bibb City, GA (Georgia) Houses and Residents
| Bibb City: | $103,632 |
| Georgia: | $297,400 |
Total population: 510 (Urban population: 494, Rural population: 0)
Houses: 244 (222 occupied: 106 owner occupied, 116 renter occupied)
| % of renters here: | 52% |
| State: | 34% |
Housing density: 1,466 houses/condos per square mile
Median price asked for vacant for-sale houses and condos in 2022 in this county: $170,737.
Median contract rent in 2022: $728 (lower quartile is $704, upper quartile is $969)
Median rent asked for vacant for-rent units in 2022: $755
Median gross rent in Bibb City, GA in 2022: $967
Housing units in Bibb City with a mortgage: 45 (3 second mortgage, 10 home equity loan, 0 both second mortgage and home equity loan)
Houses without a mortgage: 57


Household type by relationship:
Households: 182,868- In family households: 151,219 (26,454 male householders, 21,288 female householders)
28,366 spouses, 56,604 children (52,252 natural, 1,087 adopted, 3,265 stepchildren), 6,363 grandchildren, 2,431 brothers or sisters, 1,647 parents, foster children, 2,985 other relatives, 4,222 non-relatives
- In nonfamily households: 31,649 (11,937 male householders (9,489 living alone)), 14,402 female householders (12,678 living alone)), 5,310 nonrelatives
- In group quarters: 7,017 (3,486 institutionalized population)
25,750 married couples with children.
17,297 single-parent households (2,257 men, 15,040 women).
88.3% of residents of Bibb City speak English at home.
5.1% of residents speak Spanish at home (38% speak English very well, 62% speak English well).
6.6% of residents speak other Indo-European language at home (23% speak English very well, 10% speak English well, 68% speak English not well).
Foreign born population: 39 (7.3%)
(5.1% of them are naturalized citizens)
| Here: | 4.7 |
| State: | 6.8 |
| Here: | 4.9 |
| State: | 4.6 |

- Bedrooms in owner-occupied houses and condos in Bibb City, Georgia
- 0no bedroom
- 91 bedroom
- 612 bedrooms
- 273 bedrooms
- 94 bedrooms
- 05+ bedrooms

- Bedrooms in renter-occupied apartments in Bibb City, Georgia
- 2no bedroom
- 171 bedroom
- 772 bedrooms
- 143 bedrooms
- 34 bedrooms
- 35+ bedrooms

- Cars and other vehicles available in Bibb City in owner-occupied houses/condos
- 18no vehicle
- 501 vehicle
- 312 vehicles
- 73 vehicles
- 04 vehicles
- 05+ vehicles

- Cars and other vehicles available in Bibb City in renter-occupied apartments
- 14no vehicle
- 611 vehicle
- 362 vehicles
- 53 vehicles
- 04 vehicles
- 05+ vehicles

- Rooms in owner-occupied houses in Bibb City, Georgia
- 01 room
- 22 rooms
- 53 rooms
- 524 rooms
- 145 rooms
- 246 rooms
- 27 rooms
- 58 rooms
- 29+ rooms

- Rooms in renter-occupied apartments in Bibb City, Georgia
- 21 room
- 02 rooms
- 133 rooms
- 434 rooms
- 335 rooms
- 166 rooms
- 67 rooms
- 08 rooms
- 39+ rooms


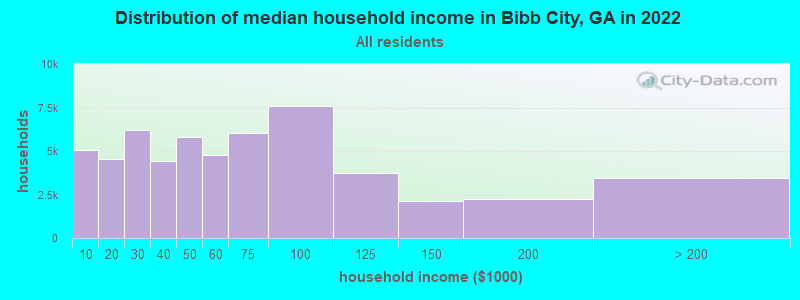
Bibb City, GA household income distribution

- 5,032Less than $10,000
- 4,558$10,000 to $19,999
- 6,195$20,000 to $29,999
- 4,403$30,000 to $39,999
- 5,802$40,000 to $49,999
- 4,761$50,000 to $59,999
- 6,018$60,000 to $74,999
- 7,610$75,000 to $99,999
- 3,751$100,000 to $124,999
- 2,127$125,000 to $149,999
- 2,219$150,000 to $199,999
- 3,428$200,000 or more
Percentage of workers working in this county: 89.3%
Number of people working at home: 51 (18.0% of all workers)
Travel time to work (commute)
- Less than 5 minutes: 3
- 5 to 9 minutes: 42
- 10 to 14 minutes: 28
- 15 to 19 minutes: 61
- 20 to 24 minutes: 27
- 25 to 29 minutes: 12
- 30 to 34 minutes: 16
- 35 to 39 minutes: 0
- 40 to 44 minutes: 0
- 45 to 59 minutes: 2
- 60 to 89 minutes: 3
- 90 or more minutes: 5
Means of transportation to work:
- Drove a car alone: 129 (64.8%)
- Carpooled: 48 (24.1%)
- Taxi: 12 (6.0%)
- Bicycle: 3 (1.5%)
- Walked: 3 (1.5%)
- Other means: 4 (2.0%)

- Year of entry for the foreign-born population in Bibb City, Georgia
- 301995 to March 2000
- 01990 to 1994
- 01985 to 1989
- 01980 to 1984
- 01975 to 1979
- 01970 to 1974
- 01965 to 1969
- 3Before 1965

First ancestries reported:
- Other: 93 (26.3%)
- English: 77 (21.8%)
- United States: 58 (16.4%)
- Irish: 57 (16.1%)
- German: 27 (7.6%)
- Scotch-Irish: 14 (4.0%)
- Scottish: 10 (2.8%)
- French: 5 (1.4%)
- Polish: 4 (1.1%)
- Danish: 3 (0.8%)
- Dutch: 2 (0.6%)
- Swedish: 2 (0.6%)
- Welsh: 2 (0.6%)
Most common places of birth for foreign-born residents (%):
| Bibb City: | 75.8% (25) |
| Georgia: | 0.1% (850) |
| Bibb City: | 9.1% (3) |
| Georgia: | 3.3% (19,039) |
| Bibb City: | 9.1% (3) |
| Georgia: | 0.0% (49) |
| Bibb City: | 6.1% (2) |
| Georgia: | 0.7% (4,103) |
Place of birth for U.S.-born residents:
- This state: 280
- Other state: 173
- Northeast: 1
- Midwest: 20
- South: 140
- West: 12
47% of Bibb City residents lived in the same house 5 years ago.
Out of people who lived in different houses, 64% lived in this county.
Out of people who lived in different counties, 39% lived in Georgia.
Education attainment for males 25 years and older:
- No schooling: 2
- Nursery to 4th grade: 2
- 5th and 6th grade: 5
- 7th and 8th grade: 23
- 9th grade: 15
- 10th grade: 9
- 11th grade: 8
- 12th grade, no diploma: 6
- High school graduate (or equivalency): 31
- Less than 1 year of college: 8
- Some college more than 1 year, no degree: 15
- Associate degree: 3
- Bachelor's degree: 6
- Master's degree: 2
- Professional school degree: 0
- Doctorate degree: 0

Education attainment for females 25 years and older:
- No schooling: 4
- Nursery to 4th grade: 8
- 5th and 6th grade: 0
- 7th and 8th grade: 35
- 9th grade: 28
- 10th grade: 15
- 11th grade: 11
- 12th grade, no diploma: 7
- High school graduate (or equivalency): 54
- Less than 1 year of college: 9
- Some college more than 1 year, no degree: 4
- Associate degree: 11
- Bachelor's degree: 3
- Master's degree: 3
- Professional school degree: 0
- Doctorate degree: 0


Housing units in structures:
- One, detached: 203
- One, attached: 13
- Two: 22
- 3 or 4: 4
- 10 to 19: 2

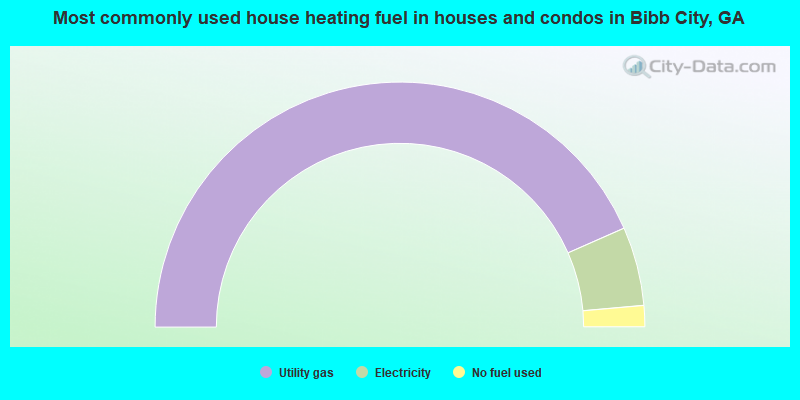
- 86.8%Utility gas
- 10.4%Electricity
- 2.8%No fuel used
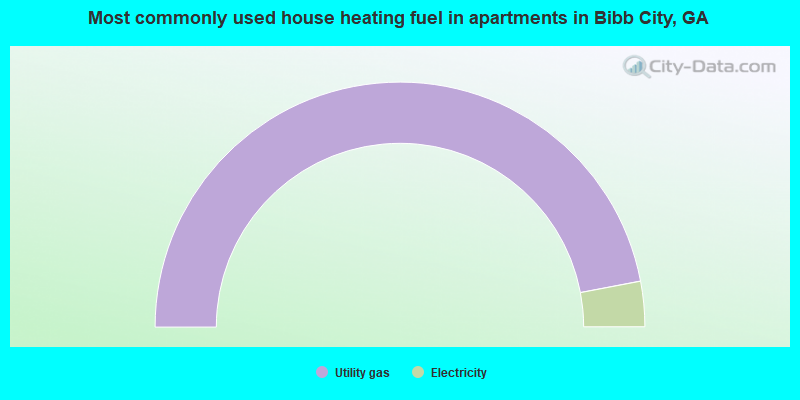
- 94.0%Utility gas
- 6.0%Electricity
Private vs. public school enrollment:
| Here: | 0.0% |
| Georgia: | 8.4% |
| Here: | 0.0% |
| Georgia: | 8.5% |
| Here: | 0.0% |
| Georgia: | 22.9% |


