Binghamton, NY (New York) Houses and Residents
Estimated median house or condo value in 2022: $123,219 (it was $66,100 in 2000 )
Binghamton:
$123,219New York:
$400,400
Lower value quartile - upper value quartile: $83,259 - $184,859Mean price in 2022: Detached houses: $160,059 Here:
$160,059State:
$476,719
Townhouses or other attached units: $303,205 Here:
$303,205State:
$699,270
In 2-unit structures: $157,905 Here:
$157,905State:
$713,077
In 3-to-4-unit structures: $129,765 Here:
$129,765State:
$764,568
In 5-or-more-unit structures: $102,560 Here:
$102,560State:
$912,009
Mobile homes: $54,146 Here:
$54,146State:
$88,925
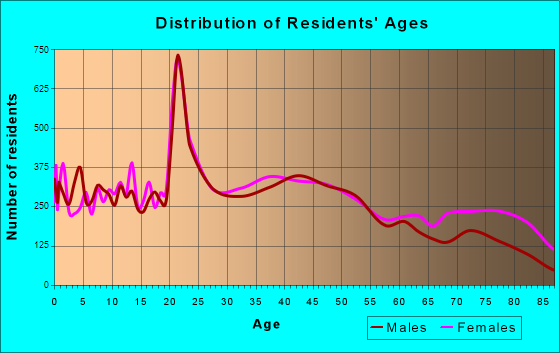
Total population: 46,299 (All urban)
Houses: 24,955 (21,070 occupied: 9,211 owner occupied, 11,921 renter occupied )
% of renters here:
56%State:
46%
Housing density: 2,391 houses/condos per square mile
Median price asked for vacant for-sale houses and condos in 2022: $208,252.
Median contract rent in 2022: $701 (lower quartile is $551, upper quartile is $929)
Median rent asked for vacant for-rent units in 2022: $591
Median gross rent in Binghamton, NY in 2022: $838
Housing units in Binghamton with a mortgage: 4,810 (582 second mortgage, 0 home equity loan, 546 both second mortgage and home equity loan )Houses without a mortgage: 266
Median household income for houses/condos with a mortgage: $82,149
Median household income for apartments without a mortgage: $55,761
Median monthly housing costs: $892
Data:
Median house or condo value ($)
Median house or condo value ($ change since 2000)
Median house or condo value ($) - White
Median house or condo value ($) - Black or African American
Median house or condo value ($) - Asian
Median house or condo value ($) - Hispanic or Latino
Median house or condo value ($) - American Indian and Alaska Native
Median house or condo value ($) - Multirace
Median house or condo value ($) - Other Race
Median price asked for mobile homes ($)
Household density (households per square mile)
Mean house or condo value by units in structure - 1, detached ($)
Mean house or condo value by units in structure - 1, attached ($)
Mean house or condo value by units in structure - 2 ($)
Mean house or condo value by units in structure by units in structure - 3 or 4 ($)
Mean house or condo value by units in structure - 5 or more ($)
Mean house or condo value by units in structure - Boat, RV, van, etc. ($)
Mean house or condo value by units in structure - Mobile home ($)
Median contract rent ($)
Median contract rent - Lower quartile ($)
Median contract rent - Upper quartile ($)
Median gross rent ($)
Urban houses (%)
Rural houses (%)
Houses occupied (%)
Houses occupied (% change since 2000)
Houses owner occupied (%)
Houses owner occupied (% change since 2000)
Houses renter occupied (%)
Houses renter occupied (% change since 2000)
Vacant housing units - For rent (%)
Vacant housing units - For rent (% change since 2000)
Vacant housing units - For sale only (%)
Vacant housing units - For sale only (% change since 2000)
Vacant housing units - Rented or sold, not occupied (%)
Vacant housing units - Rented or sold, not occupied (% change since 2000)
Vacant housing units - For seasonal, recreational, or occasional use (%)
Vacant housing units - For seasonal, recreational, or occasional use (% change since 2000)
Vacant housing units - For migrant workers (%)
Vacant housing units - For migrant workers (% change since 2000)
Vacant housing units - Other vacant (%)
Vacant housing units - Other vacant (% change since 2000)
Median monthly housing costs ($)
Median household income for houses/condos with a mortgage ($)
Median household income for houses/condos without a mortgage ($)
Median household income ($)
Median household income ($) - White
Median household income ($) - Black or African American
Median household income ($) - Asian
Median household income ($) - Hispanic or Latino
Median household income ($) - American Indian and Alaska Native
Median household income ($) - Multirace
Median household income ($) - Other Race
Mortgage status - with mortgage (%)
Mortgage status - with second mortgage (%)
Mortgage status - with home equity loan (%)
Mortgage status - with both second mortgage and home equity loan (%)
Mortgage status - without a mortgage (%)
Median year house/condo built
Median year apartment built
Household type by relationship - Male householder living alone (%)
Household type by relationship - Male householder not living alone (%)
Household type by relationship - Female householder living alone (%)
Household type by relationship - Female householder not living alone (%)
Household type by relationship - Opposite-Sex spouse (%)
Household type by relationship - Same-Sex spouse (%)
Household type by relationship - Opposite-Sex unmarried partner (%)
Household type by relationship - Same-Sex unmarried partner (%)
Household type by relationship - In group quarters (%)
Size of family households - 2-person household (%)
Size of family households - 3-person household (%)
Size of family households - 4-person household (%)
Size of family households - 5-person household (%)
Size of family households - 6-person household (%)
Size of family households - 7-or-more-person household (%)
Size of nonfamily households - 1-person household (%)
Size of nonfamily households - 2-person household (%)
Size of nonfamily households - 3-person household (%)
Size of nonfamily households - 4-person household (%)
Size of nonfamily households - 5-person household (%)
Size of nonfamily households - 6-person household (%)
Size of nonfamily households - 7-or-moreperson household (%)
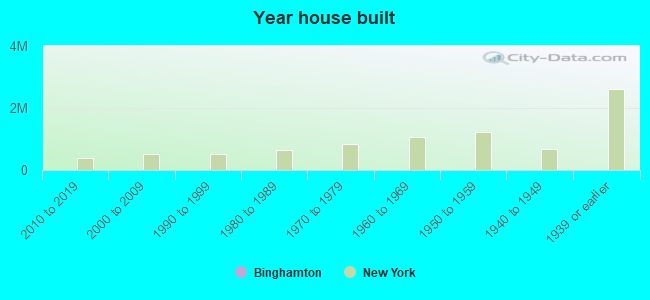
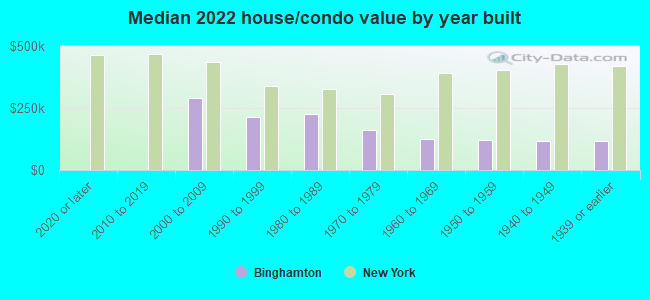
Year house built - Built 2010 or later (%)
Year house built - Built 2000 to 2009 (%)
Year house built - Built 1990 to 1999 (%)
Year house built - Built 1980 to 1989 (%)
Year house built - Built 1970 to 1979 (%)
Year house built - Built 1960 to 1969 (%)
Year house built - Built 1950 to 1959 (%)
Year house built - Built 1940 to 1949 (%)
Year house built - Built 1939 or earlier (%)
Median number of rooms in houses and condos
Median number of rooms in apartments
Median number of bedrooms in owner occupied houses
Mean number of bedrooms in owner occupied houses
Median number of bedrooms in renter occupied houses
Mean number of bedrooms in renter occupied houses
Median number of vehichles in owner occupied houses
Mean number of vehichles in owner occupied houses
Median number of vehichles in renter occupied houses
Mean number of vehichles in renter occupied houses
Rooms in owner-occupied houses - 1 room (%)
Rooms in owner-occupied houses - 2 rooms (%)
Rooms in owner-occupied houses - 3 rooms (%)
Rooms in owner-occupied houses - 4 rooms (%)
Rooms in owner-occupied houses - 5 rooms (%)
Rooms in owner-occupied houses - 6 rooms (%)
Rooms in owner-occupied houses - 7 rooms (%)
Rooms in owner-occupied houses - 8 rooms (%)
Rooms in owner-occupied houses - 9+ rooms (%)
Rooms in renter-occupied houses - 1 room (%)
Rooms in renter-occupied houses - 2 rooms (%)
Rooms in renter-occupied houses - 3 rooms (%)
Rooms in renter-occupied houses - 4 rooms (%)
Rooms in renter-occupied houses - 5 rooms (%)
Rooms in renter-occupied houses - 6 rooms (%)
Rooms in renter-occupied houses - 7 rooms (%)
Rooms in renter-occupied houses - 8 rooms (%)
Rooms in renter-occupied houses - 9+ rooms (%)
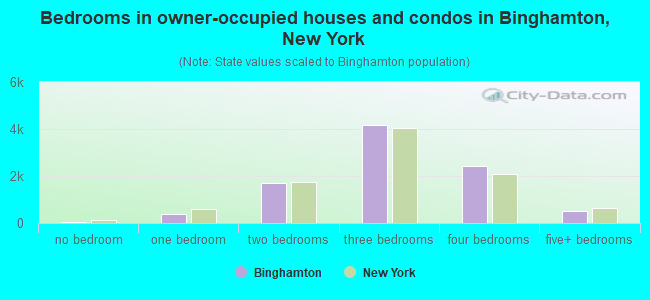
Bedrooms in owner-occupied houses - no bedrooms (%)
Bedrooms in owner-occupied houses - 1 bedroom (%)
Bedrooms in owner-occupied houses - 2 bedrooms (%)
Bedrooms in owner-occupied houses - 3 bedrooms (%)
Bedrooms in owner-occupied houses - 4 bedrooms (%)
Bedrooms in owner-occupied houses - 5+ bedrooms (%)
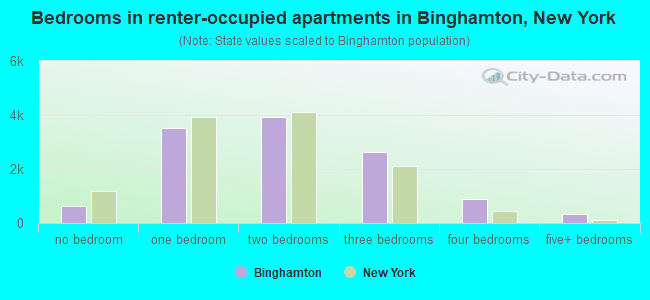
Bedrooms in renter-occupied houses - no bedrooms (%)
Bedrooms in renter-occupied houses - 1 bedroom (%)
Bedrooms in renter-occupied houses - 2 bedrooms (%)
Bedrooms in renter-occupied houses - 3 bedrooms (%)
Bedrooms in renter-occupied houses - 4 bedrooms (%)
Bedrooms in renter-occupied houses - 5+ bedrooms (%)
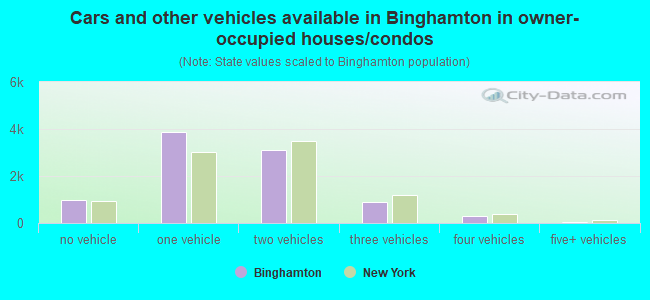
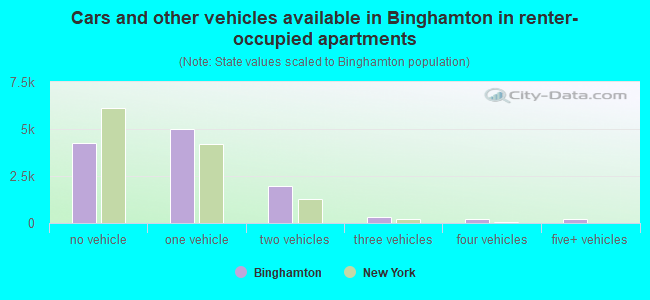
Vehicles available in owner-occupied houses - no vehicle available (%)
Vehicles available in owner-occupied houses - 1 vehicle available(%)
Vehicles available in owner-occupied houses - 2 Vehicles available (%)
Vehicles available in owner-occupied houses - 3 Vehicles available (%)
Vehicles available in owner-occupied houses - 4 Vehicles available (%)
Vehicles available in owner-occupied houses - 5+ Vehicles available (%)
Vehicles available in renter-occupied houses - no vehicle available (%)
Vehicles available in renter-occupied houses - 1 vehicle available (%)
Vehicles available in renter-occupied houses - 2 Vehicles available (%)
Vehicles available in renter-occupied houses - 3 Vehicles available (%)
Vehicles available in renter-occupied houses - 4 Vehicles available (%)
Vehicles available in renter-occupied houses - 5+ Vehicles available (%)
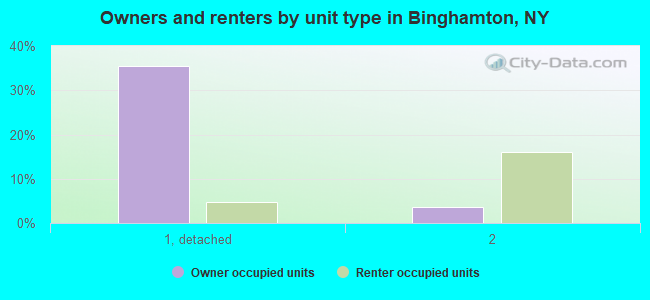
Housing units in structures - 1, detached (%)
Housing units in structures - 1, attached (%)
Housing units in structures - 2 (%)
Housing units in structures - 3 or 4 (%)
Housing units in structures - 5 to 9 (%)
Housing units in structures - 10 to 19 (%)
Housing units in structures - 20 to 49 (%)
Housing units in structures - 50 or more (%)
Housing units in structures - Mobile home (%)
Housing units in structures - Boat, RV, van, etc. (%)
Housing units in structures - Owners - 1, detached (%)
Housing units in structures - Owners - 1, attached (%)
Housing units in structures - Owners - 2 (%)
Housing units in structures - Owners - 3 or 4 (%)
Housing units in structures - Owners - 5 to 9 (%)
Housing units in structures - Owners - 10 to 19 (%)
Housing units in structures - Owners - 20 to 49 (%)
Housing units in structures - Owners - 50 or more (%)
Housing units in structures - Owners - Mobile home (%)
Housing units in structures - Owners - Boat, RV, van, etc. (%)
Housing units in structures - Renters - 1, detached (%)
Housing units in structures - Renters - 1, attached (%)
Housing units in structures - Renters - 2 (%)
Housing units in structures - Renters - 3 or 4 (%)
Housing units in structures - Renters - 5 to 9 (%)
Housing units in structures - Renters - 10 to 19 (%)
Housing units in structures - Renters - 20 to 49 (%)
Housing units in structures - Renters - 50 or more (%)
Housing units in structures - Renters - Mobile home (%)
Housing units in structures - Renters - Boat, RV, van, etc. (%)
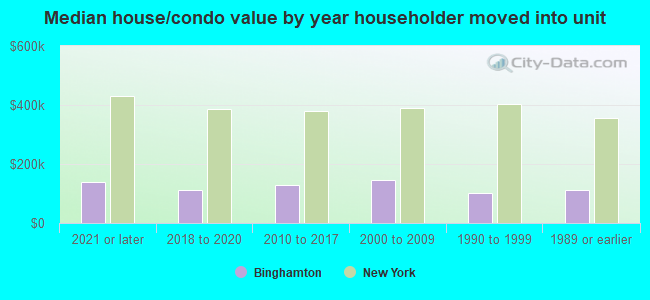
House/condo owner moved in on average (years ago)
Renter moved in on average (years ago)
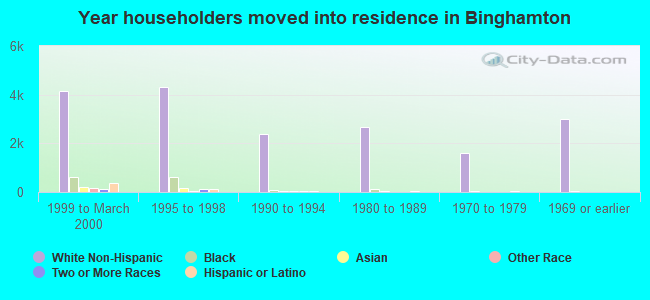
Year householder moved into unit - Moved in 1999 to March 2000 (%)
Year householder moved into unit - Moved in 1999 to March 2000 (%) - White
Year householder moved into unit - Moved in 1999 to March 2000 (%) - Black or African American
Year householder moved into unit - Moved in 1999 to March 2000 (%) - Asian
Year householder moved into unit - Moved in 1999 to March 2000 (%) - Hispanic or Latino
Year householder moved into unit - Moved in 1999 to March 2000 (%) - American Indian and Alaska Native
Year householder moved into unit - Moved in 1999 to March 2000 (%) - Multirace
Year householder moved into unit - Moved in 1999 to March 2000 (%) - Other Race
Year householder moved into unit - Moved in 1995 to 1998 (%)
Year householder moved into unit - Moved in 1995 to 1998 (%) - White
Year householder moved into unit - Moved in 1995 to 1998 (%) - Black or African American
Year householder moved into unit - Moved in 1995 to 1998 (%) - Asian
Year householder moved into unit - Moved in 1995 to 1998 (%) - Hispanic or Latino
Year householder moved into unit - Moved in 1995 to 1998 (%) - American Indian and Alaska Native
Year householder moved into unit - Moved in 1995 to 1998 (%) - Multirace
Year householder moved into unit - Moved in 1995 to 1998 (%) - Other Race
Year householder moved into unit - Moved in 1990 to 1994 (%)
Year householder moved into unit - Moved in 1990 to 1994 (%) - White
Year householder moved into unit - Moved in 1990 to 1994 (%) - Black or African American
Year householder moved into unit - Moved in 1990 to 1994 (%) - Asian
Year householder moved into unit - Moved in 1990 to 1994 (%) - Hispanic or Latino
Year householder moved into unit - Moved in 1990 to 1994 (%) - American Indian and Alaska Native
Year householder moved into unit - Moved in 1990 to 1994 (%) - Multirace
Year householder moved into unit - Moved in 1990 to 1994 (%) - Other Race
Year householder moved into unit - Moved in 1980 to 1989 (%)
Year householder moved into unit - Moved in 1980 to 1989 (%) - White
Year householder moved into unit - Moved in 1980 to 1989 (%) - Black or African American
Year householder moved into unit - Moved in 1980 to 1989 (%) - Asian
Year householder moved into unit - Moved in 1980 to 1989 (%) - Hispanic or Latino
Year householder moved into unit - Moved in 1980 to 1989 (%) - American Indian and Alaska Native
Year householder moved into unit - Moved in 1980 to 1989 (%) - Multirace
Year householder moved into unit - Moved in 1980 to 1989 (%) - Other Race
Year householder moved into unit - Moved in 1970 to 1979 (%)
Year householder moved into unit - Moved in 1970 to 1979 (%) - White
Year householder moved into unit - Moved in 1970 to 1979 (%) - Black or African American
Year householder moved into unit - Moved in 1970 to 1979 (%) - Asian
Year householder moved into unit - Moved in 1970 to 1979 (%) - Hispanic or Latino
Year householder moved into unit - Moved in 1970 to 1979 (%) - American Indian and Alaska Native
Year householder moved into unit - Moved in 1970 to 1979 (%) - Multirace
Year householder moved into unit - Moved in 1970 to 1979 (%) - Other Race
Year householder moved into unit - Moved in 1969 or earlier (%)
Year householder moved into unit - Moved in 1969 or earlier (%) - White
Year householder moved into unit - Moved in 1969 or earlier (%) - Black or African American
Year householder moved into unit - Moved in 1969 or earlier (%) - Asian
Year householder moved into unit - Moved in 1969 or earlier (%) - Hispanic or Latino
Year householder moved into unit - Moved in 1969 or earlier (%) - American Indian and Alaska Native
Year householder moved into unit - Moved in 1969 or earlier (%) - Multirace
Year householder moved into unit - Moved in 1969 or earlier (%) - Other Race
Housing units lacking complete plumbing facilities (%)
Housing units lacking complete kitchen facilities (%)
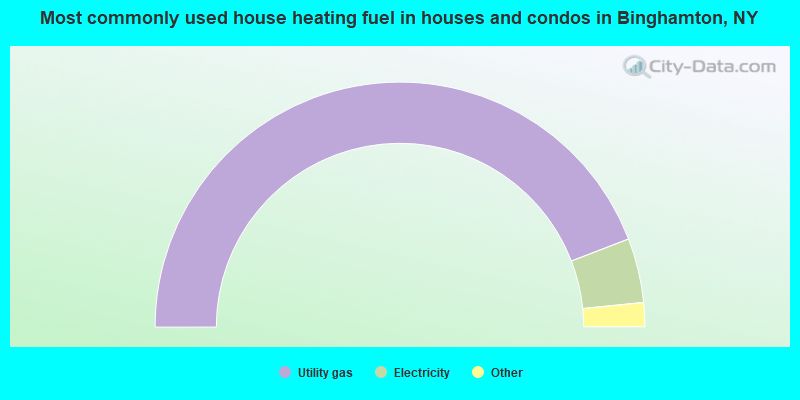
House heating fuel used in houses and condos - Utility gas (%)
House heating fuel used in houses and condos - Bottled, tank, or LP gas (%)
House heating fuel used in houses and condos - Electricity (%)
House heating fuel used in houses and condos - Fuel oil, kerosene, etc. (%)
House heating fuel used in houses and condos - Coal or coke (%)
House heating fuel used in houses and condos - Wood (%)
House heating fuel used in houses and condos - Solar energy (%)
House heating fuel used in houses and condos - Other fuel (%)
House heating fuel used in houses and condos - No fuel used (%)
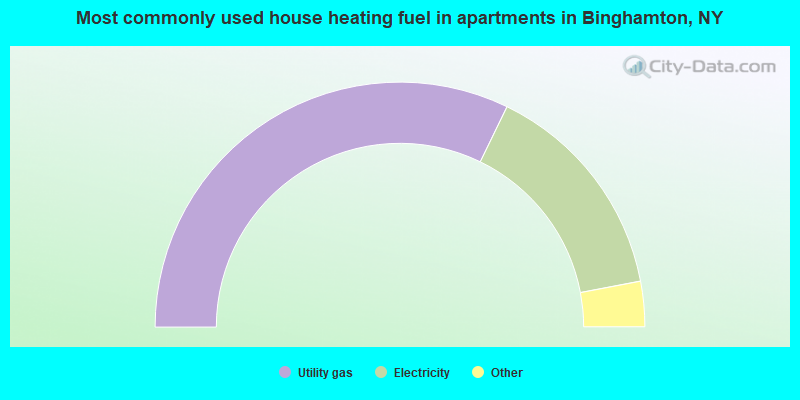
House heating fuel used in apartments - Utility gas (%)
House heating fuel used in apartments - Bottled, tank, or LP gas (%)
House heating fuel used in apartments - Electricity (%)
House heating fuel used in apartments - Fuel oil, kerosene, etc. (%)
House heating fuel used in apartments - Coal or coke (%)
House heating fuel used in apartments - Wood (%)
House heating fuel used in apartments - Solar energy (%)
House heating fuel used in apartments - Other fuel (%)
House heating fuel used in apartments - No fuel used (%)
Latest news about housing in Binghamton, NY collected exclusively by city-data.com from local newspapers, TV, and radio stations
Median year house/condo built: 1938Median year apartment built: 1956Household type by relationship:
Households: 47,317
Male householders: 9,348 (3,868 living alone ), Female householders: 11,454 (4,609 living alone )5,245 spouses (5,174 opposite-sex spouses ), 1,975 unmarried partners , (1,812 opposite-sex unmarried partners ), 10,551 children (10,307 natural , 84 adopted , 158 stepchildren ), 800 grandchildren , 462 brothers or sisters , 358 parents , 19 foster children , 496 other relatives , 5,037 non-relatives In group quarters: 1,566
Size of family households: 4,492 2-persons , 2,055 3-persons , 1,713 4-persons , 340 5-persons , 355 6-persons , 118 7-or-more-persons .
Size of nonfamily households: 8,392 1-person , 2,318 2-persons , 595 3-persons , 301 4-persons , 67 5-persons , 319 6-persons , 114 7-or-more-persons .
3,007 married couples with children. single-parent households (985 men , 3,005 women ).
85.8% of residents of Binghamton speak English at home. of residents speak Spanish at home (75% speak English very well , 5% speak English well , 14% speak English not well , 6% don't speak English at all ).of residents speak other Indo-European language at home (75% speak English very well , 13% speak English well , 5% speak English not well , 8% don't speak English at all ).of residents speak Asian or Pacific Island language at home (61% speak English very well , 21% speak English well , 14% speak English not well , 4% don't speak English at all ).of residents speak other language at home (72% speak English very well , 19% speak English well , 9% speak English not well ).
Foreign born population: 5,199 (11.0%)of them are naturalized citizens )
Median number of rooms in houses and condos:
Median number of rooms in apartments
Owner-occupied Renter-occupied
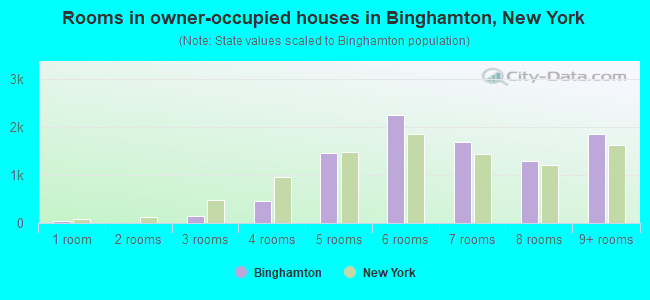
Rooms in owner-occupied houses in Binghamton, New York
46 1 room 0 2 rooms 156 3 rooms 456 4 rooms 1,464 5 rooms 2,251 6 rooms 1,683 7 rooms 1,290 8 rooms 1,864 9+ rooms
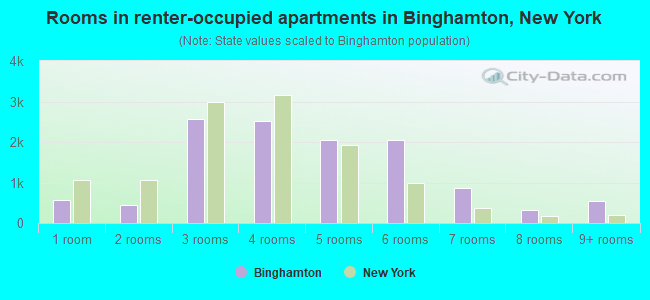
Rooms in renter-occupied apartments in Binghamton, New York
575 1 room 442 2 rooms 2,562 3 rooms 2,514 4 rooms 2,053 5 rooms 2,050 6 rooms 855 7 rooms 329 8 rooms 541 9+ rooms
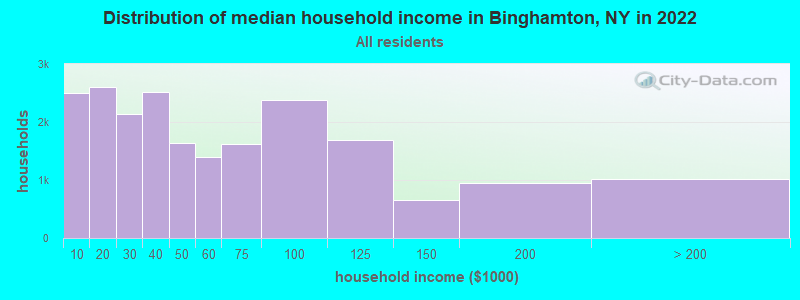
Binghamton, NY household income distribution 2,500 Less than $10,0002,611 $10,000 to $19,9992,144 $20,000 to $29,9992,514 $30,000 to $39,9991,636 $40,000 to $49,9991,390 $50,000 to $59,9991,620 $60,000 to $74,9992,383 $75,000 to $99,9991,696 $100,000 to $124,999657 $125,000 to $149,999943 $150,000 to $199,9991,016 $200,000 or more
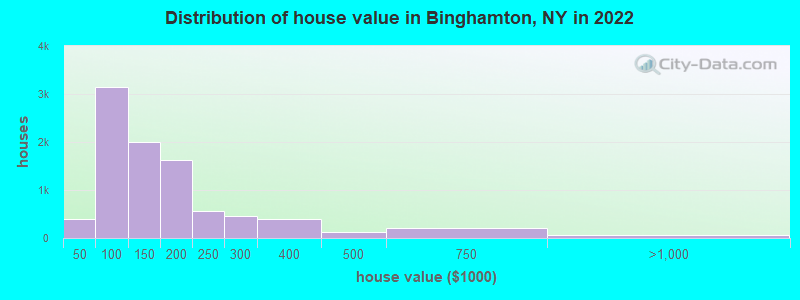
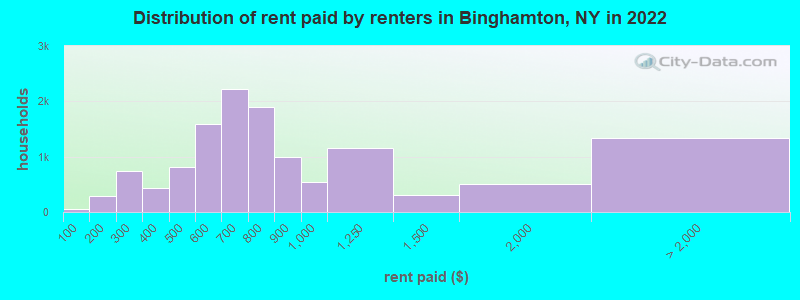
Home value of owner - occupied houses in 2022 in Binghamton, NY 59 Less than $10,00024 $10,000 to $14,99969 $15,000 to $19,99923 $20,000 to $24,99920 $25,000 to $29,99973 $30,000 to $34,99920 $35,000 to $39,99998 $40,000 to $49,999468 $50,000 to $59,999678 $60,000 to $69,999783 $70,000 to $79,999728 $80,000 to $89,999379 $90,000 to $99,9991,082 $100,000 to $124,999914 $125,000 to $149,9991,121 $150,000 to $174,999495 $175,000 to $199,999562 $200,000 to $249,999455 $250,000 to $299,999388 $300,000 to $399,999129 $400,000 to $499,999201 $500,000 to $749,99936 $750,000 to $999,99932 $1,000,000 to $1,499,999Rent paid by renters in 2022 in Binghamton, NY 58 Less than $10032 $100 to $149259 $150 to $199447 $200 to $249300 $250 to $299210 $300 to $349223 $350 to $399413 $400 to $449404 $450 to $499786 $500 to $549809 $550 to $599884 $600 to $6491,338 $650 to $6991,112 $700 to $749779 $750 to $7991,000 $800 to $899549 $900 to $9991,148 $1,000 to $1,249311 $1,250 to $1,499503 $1,500 to $1,999320 $2,000 to $2,49983 $2,500 to $2,999149 $3,000 to $3,499142 $3,500 or more643 No cash rent
Percentage of workers working in this county: 90.7%Number of people working at home: 1,839 (8.8% of all workers )
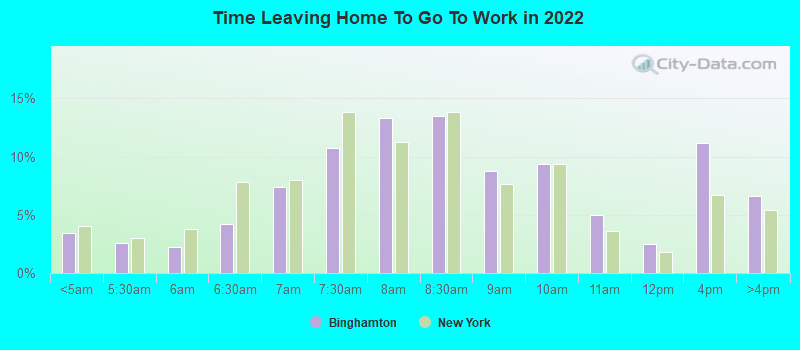
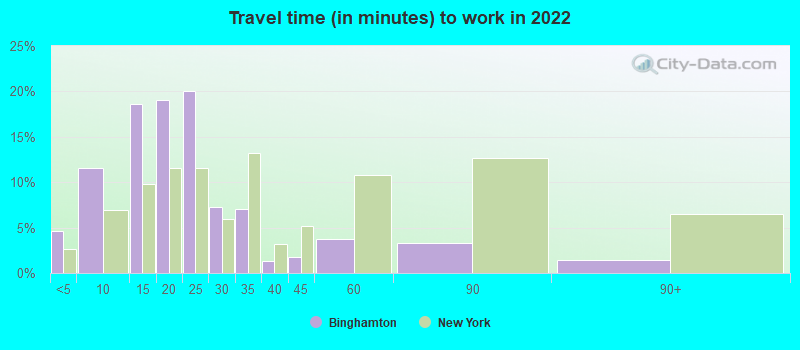
Travel time to work (commute)
Less than 5 minutes: 9945 to 9 minutes: 2,76910 to 14 minutes: 4,25215 to 19 minutes: 3,82820 to 24 minutes: 2,63425 to 29 minutes: 51530 to 34 minutes: 1,12235 to 39 minutes: 11740 to 44 minutes: 41845 to 59 minutes: 40560 to 89 minutes: 95890 or more minutes: 382
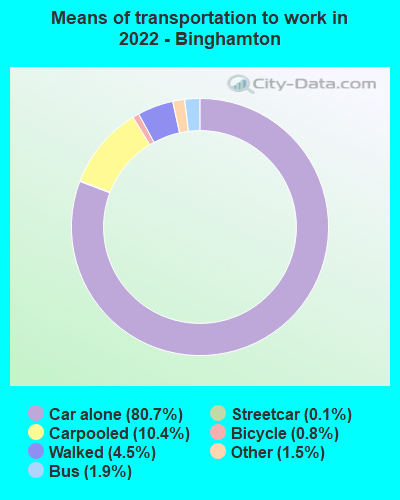
Means of transportation to work:
Drove a car alone: 18,674 (72.3%)Carpooled: 2,888 (11.2%)Bus : 477 (1.8%)Subway or elevated rail : 33 (0.1%)Taxi: 620 (2.4%)Bicycle: 88 (0.3%)Walked: 1,207 (4.7%)Worked at home: 1,839 (7.1%)
Unemployment by race in 2022
Unemployment rate for White non-Hispanic residents 6.5% Males3.9% FemalesUnemployment rate for Black residents 17.4% Males21.9% FemalesUnemployment rate for American Indian and Alaska Native residents 14.5% Males77.6% FemalesUnemployment rate for Asian residents 6.1% Males3.6% FemalesUnemployment rate for other race residents 27.4% FemalesUnemployment rate for two or more race residents 22.5% Males3.7% FemalesUnemployment rate for Hispanic or Latino residents 6.2% Males18.7% Females
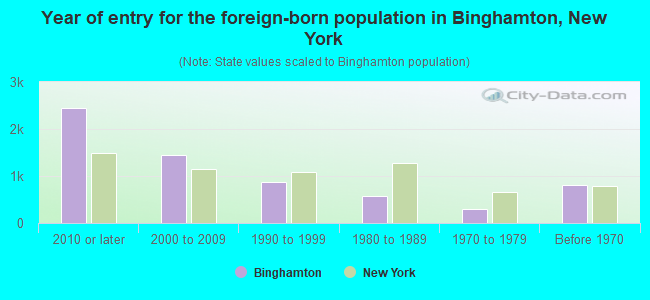
Year of entry for the foreign-born population in Binghamton, New York
2,448 2010 or later 1,445 2000 to 2009 869 1990 to 1999 570 1980 to 1989 295 1970 to 1979 811 Before 1970
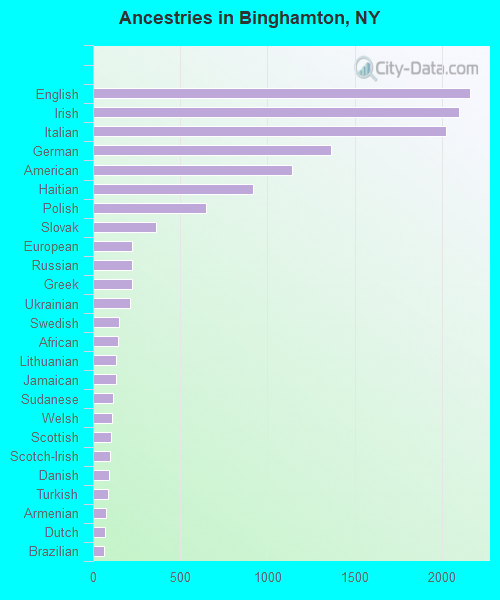
First ancestries reported:
English: 2,162 (9.9%)
Irish: 2,098 (9.6%)
Italian: 2,021 (9.3%)
German: 1,364 (6.3%)
American: 1,142 (5.3%)
Haitian: 920 (4.2%)
Polish: 648 (3.0%)
Slovak: 361 (1.7%)
European: 225 (1.0%)
Russian: 224 (1.0%)
Greek: 221 (1.0%)
Ukrainian: 210 (1.0%)
Swedish: 147 (0.7%)
African: 146 (0.7%)
Lithuanian: 130 (0.6%)
Jamaican: 130 (0.6%)
Sudanese: 114 (0.5%)
Welsh: 107 (0.5%)
Scottish: 104 (0.5%)
Scotch-Irish: 97 (0.4%)
Danish: 94 (0.4%)
Turkish: 86 (0.4%)
Armenian: 76 (0.3%)
Dutch: 69 (0.3%)
Brazilian: 64 (0.3%)
French: 61 (0.3%)
Eastern European: 58 (0.3%)
Yugoslavian: 58 (0.3%)
French Canadian: 57 (0.3%)
Finnish: 57 (0.3%)
Romanian: 52 (0.2%)
Slovene: 51 (0.2%)
Israeli: 50 (0.2%)
Kenyan: 43 (0.2%)
Iraqi: 40 (0.2%)
Norwegian: 36 (0.2%)
Albanian: 36 (0.2%)
Barbadian: 34 (0.2%)
Czech: 33 (0.2%)
Iranian: 27 (0.1%)
Carpatho Rusyn: 27 (0.1%)
Portuguese: 20 (0.09%)
Zimbabwean: 20 (0.09%)
Czechoslovakian: 18 (0.08%)
Arab: 18 (0.08%)
West Indian: 17 (0.08%)
Jordanian: 14 (0.06%)
British: 14 (0.06%)
Northern European: 13 (0.06%)
Hungarian: 13 (0.06%)
Ghanaian: 12 (0.06%)
Croatian: 12 (0.06%)
U.S. Virgin Islander: 12 (0.06%)
Pennsylvania German: 11 (0.05%)
Lebanese: 10 (0.05%)
Syrian: 10 (0.05%)
Guyanese: 10 (0.05%)
Scandinavian: 7 (0.03%)
Nigerian: 7 (0.03%)
Austrian: 7 (0.03%)
Trinidadian and Tobagonian: 7 (0.03%)
British West Indian: 3 (0.01%)
Most common places of birth for foreign-born residents (%): Haiti Binghamton:
14.6% (800)New York:
2.8% (126,936)
India Binghamton:
11.3% (618)New York:
3.5% (158,432)
China, excluding Hong Kong and Taiwan Binghamton:
10.3% (566)New York:
9.1% (410,910)
Vietnam Binghamton:
4.2% (231)New York:
0.6% (25,517)
Mexico Binghamton:
3.8% (211)New York:
4.8% (214,559)
Canada Binghamton:
3.3% (182)New York:
1.3% (59,107)
Ukraine Binghamton:
2.9% (159)New York:
1.7% (78,421)
Jamaica Binghamton:
2.7% (149)New York:
5.0% (227,557)
Iraq Binghamton:
2.6% (145)New York:
0.1% (6,152)
Dominican Republic Binghamton:
2.5% (137)New York:
11.1% (501,040)
South Africa Binghamton:
2.5% (135)New York:
0.2% (8,010)
Greece Binghamton:
2.4% (131)New York:
0.6% (28,604)
Bosnia and Herzegovina Binghamton:
2.2% (121)New York:
0.2% (9,472)
Colombia Binghamton:
2.2% (121)New York:
2.5% (111,920)
Turkey Binghamton:
1.9% (106)New York:
0.5% (21,009)
Sri Lanka Binghamton:
1.8% (100)New York:
0.2% (7,915)
Bangladesh Binghamton:
1.8% (100)New York:
2.6% (117,288)
Italy Binghamton:
1.8% (97)New York:
1.8% (81,374)
Sudan Binghamton:
1.7% (96)New York:
0.1% (3,701)
Pakistan Binghamton:
1.6% (90)New York:
1.4% (62,442)
Guyana Binghamton:
1.6% (88)New York:
3.8% (172,129)
Place of birth for U.S.-born residents:
This state: 34,832Other state: 6,893Northeast: 3,280Midwest: 816South: 2,090West: 712 78.4% of Binghamton residents lived in the same house 1 years ago.
Out of people who lived in different houses, 34.8% lived in this county.
Out of people who lived in different counties, 84.3% lived in New York.
Binghamton:
78.4%State average:
89.6%
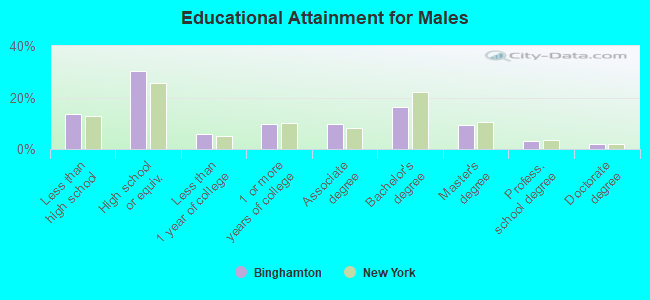
Education attainment for males 25 years and older:
No schooling: 322Nursery to 4th grade: 205th and 6th grade: 937th and 8th grade: 1299th grade: 21110th grade: 61411th grade: 18112th grade, no diploma: 388High school graduate (or equivalency): 4,339Less than 1 year of college: 863Some college more than 1 year, no degree: 1,406Associate degree: 1,383Bachelor's degree: 2,341Master's degree: 1,362Professional school degree: 432Doctorate degree: 290
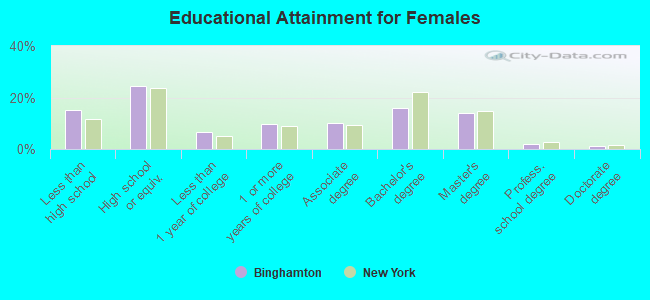
Education attainment for females 25 years and older:
No schooling: 208Nursery to 4th grade: 335th and 6th grade: 1207th and 8th grade: 2179th grade: 45510th grade: 55911th grade: 41912th grade, no diploma: 475High school graduate (or equivalency): 3,968Less than 1 year of college: 1,085Some college more than 1 year, no degree: 1,606Associate degree: 1,667Bachelor's degree: 2,616Master's degree: 2,262Professional school degree: 345Doctorate degree: 208
Housing units in structures:
One, detached: 9,681One, attached: 843Two: 5,8013 or 4: 2,9025 to 9: 2,20210 to 19: 1,30320 to 49: 66150 or more: 1,514Mobile homes: 45Housing units lacking complete plumbing facilities in 2022: 3.4%Housing units lacking complete kitchen facilities in 2022: 2.8%House/condo owner moved in on average 17 years ago
Renter moved in on average 3 years ago
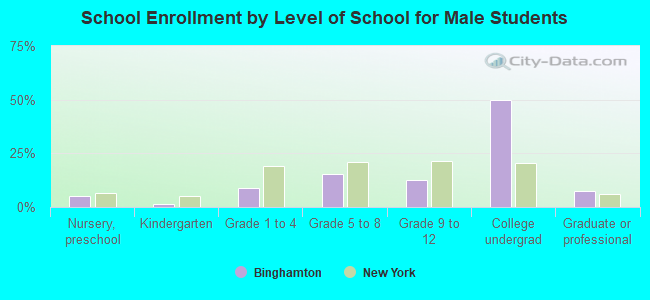
Private vs. public school enrollment:
Students in private schools in grades 1 to 8 (elementary and middle school): 416 Students in private schools in grades 9 to 12 (high school): 266 Students in private undergraduate colleges: 1,003