Bishopville, SC (South Carolina) Houses and Residents
| Bishopville: | $152,383 |
| South Carolina: | $254,600 |
Total population: 3,300 (All urban)
Houses: 1,623 (1,379 occupied: 694 owner occupied, 711 renter occupied)
| % of renters here: | 51% |
| State: | 28% |
Housing density: 688 houses/condos per square mile
Median price asked for vacant for-sale houses and condos in 2022 in this county: $74,356.
Median contract rent in 2022: $481 (lower quartile is $197, upper quartile is $710)
Median rent asked for vacant for-rent units in 2022: $1,931
Median gross rent in Bishopville, SC in 2022: $621
Housing units in Bishopville with a mortgage: 349 (27 second mortgage, 0 home equity loan, 0 both second mortgage and home equity loan)
Houses without a mortgage: 0
Median household income for houses/condos with a mortgage: $47,728
Median household income for apartments without a mortgage: $49,888
Median monthly housing costs: $661
Compare current foreclosures near Bishopville, SC:
| Photo | Address | Area | Beds / Baths | Price | Details |
|---|---|---|---|---|---|

|
#1
Mcdonald Pl
Bishopville, SC 29010
|
2,046 sq. feet
|
2 baths 4 beds |
show details | |

|
#2
Kings Ave
Bishopville, SC 29010
|
1,026 sq. feet
|
- baths - beds |
show details | |

|
#3
Scotts Ln
Bishopville, SC 29010
|
- sq. feet
|
- baths - beds |
show details | |

|
#4
S Darlington Hwy
Bishopville, SC 29010
|
1,508 sq. feet
|
- baths - beds |
show details | |

|
#5
Camden Hwy
Bishopville, SC 29010
|
1,601 sq. feet
|
- baths - beds |
show details | |

|
#6
Shearer Rd
Bishopville, SC 29010
|
- sq. feet
|
- baths - beds |
show details | |

|
#7
Spring Hill Rd
Bishopville, SC 29010
|
1,452 sq. feet
|
- baths - beds |
show details | |

|
#8
W Council St
Bishopville, SC 29010
|
- sq. feet
|
- baths - beds |
show details | |

|
#9
Nash Rd
Bishopville, SC 29010
|
- sq. feet
|
- baths - beds |
show details | |

|
#10
Manville St Charles Rd
Bishopville, SC 29010
|
- sq. feet
|
- baths - beds |
show details |
| Photo | Address | Area | Beds / Baths | Price | Details |
|---|---|---|---|---|---|

|
#11
Manville Wisacky Rd
Bishopville, SC 29010
|
- sq. feet
|
- baths - beds |
show details | |

|
#12
Manville Wisacky Rd
Bishopville, SC 29010
|
- sq. feet
|
- baths - beds |
show details | |

|
#13
Deerfield Ln
Bishopville, SC 29010
|
- sq. feet
|
- baths - beds |
show details | |

|
#14
Davis St
Bishopville, SC 29010
|
- sq. feet
|
- baths - beds |
show details | |

|
#15
Law St
Bishopville, SC 29010
|
- sq. feet
|
- baths - beds |
show details | |

|
#16
Bradley Ave
Bishopville, SC 29010
|
- sq. feet
|
- baths - beds |
show details | |

|
#17
Casa Nova Ct
Bishopville, SC 29010
|
- sq. feet
|
- baths - beds |
show details | |

|
#18
Eddie Watkins Rd
Bishopville, SC 29010
|
- sq. feet
|
- baths - beds |
show details | |

|
#19
Kings Ave
Bishopville, SC 29010
|
- sq. feet
|
- baths - beds |
show details | |

|
#20
Elmwood Dr
Hartsville, SC 29550
|
1,329 sq. feet
|
2 baths 3 beds |
show details |
| Photo | Address | Area | Beds / Baths | Price | Details |
|---|---|---|---|---|---|

|
#21
Forest Breeze Dr
Hartsville, SC 29550
|
1,617 sq. feet
|
2 baths 3 beds |
show details | |

|
#22
Flag St
Hartsville, SC 29550
|
1,058 sq. feet
|
1 baths 2 beds |
show details | |

|
#23
S 11th St
Hartsville, SC 29550
|
1,325 sq. feet
|
1 baths 3 beds |
show details | |

|
#24
Patrick Hwy
Hartsville, SC 29550
|
1,520 sq. feet
|
1 baths 3 beds |
show details | |

|
#25
Melody Ln
Hartsville, SC 29550
|
2,804 sq. feet
|
1 baths 4 beds |
show details | |

|
#26
S 8th St
Hartsville, SC 29550
|
984 sq. feet
|
1 baths 3 beds |
show details | |

|
#27
Fox Hollow Dr
Hartsville, SC 29550
|
1,302 sq. feet
|
2 baths 3 beds |
show details | |

|
#28
Ridge St
Dalzell, SC 29040
|
1,359 sq. feet
|
2 baths 3 beds |
show details | |

|
#29
Haven Dr
Hartsville, SC 29550
|
1,449 sq. feet
|
1 baths 3 beds |
show details | |

|
#30
Holly Dr
Hartsville, SC 29550
|
1,663 sq. feet
|
2 baths 3 beds |
show details |
| Photo | Address | Area | Beds / Baths | Price | Details |
|---|---|---|---|---|---|

|
#31
Myrtle St
Hartsville, SC 29550
|
1,088 sq. feet
|
1 baths 2 beds |
show details | |

|
#32
Tomahawk Rd
Lamar, SC 29069
|
1,732 sq. feet
|
2 baths 3 beds |
show details | |

|
#33
Beaverdam Dr
Hartsville, SC 29550
|
1,681 sq. feet
|
- baths 3 beds |
show details | |

|
#34
Oates Hwy
Lamar, SC 29069
|
1,551 sq. feet
|
- baths 3 beds |
show details | |

|
#35
Thomas Dr
Hartsville, SC 29550
|
3,456 sq. feet
|
- baths 4 beds |
show details | |

|
#36
Lamar Hwy
Timmonsville, SC 29161
|
1,025 sq. feet
|
1 baths 3 beds |
show details | |

|
#37
Ridge St
Dalzell, SC 29040
|
- sq. feet
|
2 baths 3 beds |
show details | |

|
#38
E Lydia Hwy
Hartsville, SC 29550
|
2,016 sq. feet
|
- baths 4 beds |
show details | |

|
#39
White Pines Dr
Camden, SC 29020
|
1,456 sq. feet
|
- baths - beds |
show details | |

|
#40
Addison St
Sumter, SC 29153
|
2,441 sq. feet
|
- baths - beds |
show details |
| Photo | Address | Area | Beds / Baths | Price | Details |
|---|---|---|---|---|---|

|
#41
Field Trial Rd
Camden, SC 29020
|
1,746 sq. feet
|
- baths - beds |
show details | |

|
#42
Quietude Rd
Timmonsville, SC 29161
|
1,284 sq. feet
|
- baths - beds |
show details | |

|
#43
Homestead Dr
Hartsville, SC 29550
|
1,792 sq. feet
|
- baths - beds |
show details | |

|
#44
Kirby Ln
Rembert, SC 29128
|
- sq. feet
|
- baths - beds |
show details | |

|
#45
Oak Stump Rd
Timmonsville, SC 29161
|
1,740 sq. feet
|
- baths - beds |
show details | |

|
#46
W Old Camden Rd
Mc Bee, SC 29101
|
- sq. feet
|
- baths - beds |
show details | |

|
#47
W Foxworth Mill Rd # 29153
Sumter, SC 29153
|
- sq. feet
|
- baths 3 beds |
show details | |

|
#48
Elizabeth Dr
Dalzell, SC 29040
|
- sq. feet
|
- baths - beds |
show details | |

|
#49
Millikin Ave
Hartsville, SC 29550
|
1,048 sq. feet
|
- baths - beds |
show details | |

|
Check over 1 million property listings on Foreclosure.com!
|
browse all offers | |||

Latest news about housing in Bishopville, SC collected exclusively by city-data.com from local newspapers, TV, and radio stations

 | What's New or Coming To Sumter (2765 replies) |
| Haunted houses (6 replies) |
| Five Most Underrated Cities to Visit in South Carolina (20 replies) |
| Columbia Common (2253 replies) |
| NFL team in South Carolina? Would Governor support it? (419 replies) |
| moving to sc but where? (14 replies) |

Median year apartment built: 1987
Household type by relationship:
Households: 3,067- Male householders: 768 (417 living alone), Female householders: 599 (205 living alone)
334 spouses (323 opposite-sex spouses), 52 unmarried partners, (45 opposite-sex unmarried partners), 616 children (551 natural, 0 adopted, 64 stepchildren), 275 grandchildren, 23 brothers or sisters, 57 parents, 0 foster children, 55 other relatives, 69 non-relatives
- In group quarters: 213
Size of family households: 440 2-persons, 111 3-persons, 84 4-persons, 66 5-persons, 63 6-persons.
Size of nonfamily households: 632 1-person, 2 2-persons, 7 4-persons.
68 married couples with children.
293 single-parent households (70 men, 223 women).
91.5% of residents of Bishopville speak English at home.
3.5% of residents speak Spanish at home (89% speak English very well, 11% speak English well).
1.5% of residents speak other Indo-European language at home (100% speak English very well).
2.9% of residents speak other language at home (100% speak English very well).
Foreign born population: 196 (6.4%)
(0.0% of them are naturalized citizens)
| Here: | 6.4 |
| State: | 6.4 |
| Here: | 4.2 |
| State: | 4.5 |

- Bedrooms in owner-occupied houses and condos in Bishopville, South Carolina
- 0no bedroom
- 01 bedroom
- 452 bedrooms
- 5383 bedrooms
- 794 bedrooms
- 325+ bedrooms

- Bedrooms in renter-occupied apartments in Bishopville, South Carolina
- 50no bedroom
- 1551 bedroom
- 3032 bedrooms
- 2043 bedrooms
- 04 bedrooms
- 05+ bedrooms

- Cars and other vehicles available in Bishopville in owner-occupied houses/condos
- 27no vehicle
- 2961 vehicle
- 2092 vehicles
- 1093 vehicles
- 84 vehicles
- 455+ vehicles

- Cars and other vehicles available in Bishopville in renter-occupied apartments
- 214no vehicle
- 2631 vehicle
- 1732 vehicles
- 83 vehicles
- 04 vehicles
- 535+ vehicles

- Rooms in owner-occupied houses in Bishopville, South Carolina
- 01 room
- 02 rooms
- 03 rooms
- 04 rooms
- 1125 rooms
- 2636 rooms
- 1287 rooms
- 298 rooms
- 1649+ rooms

- Rooms in renter-occupied apartments in Bishopville, South Carolina
- 501 room
- 142 rooms
- 1623 rooms
- 1854 rooms
- 2335 rooms
- 616 rooms
- 07 rooms
- 78 rooms
- 09+ rooms


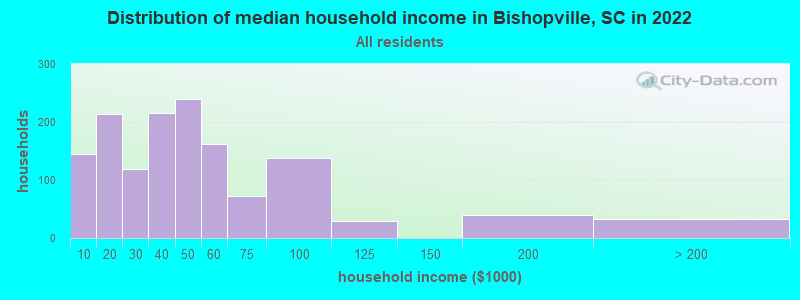
Bishopville, SC household income distribution

- 144Less than $10,000
- 214$10,000 to $19,999
- 119$20,000 to $29,999
- 215$30,000 to $39,999
- 239$40,000 to $49,999
- 162$50,000 to $59,999
- 72$60,000 to $74,999
- 138$75,000 to $99,999
- 30$100,000 to $124,999
- 39$150,000 to $199,999
- 33$200,000 or more
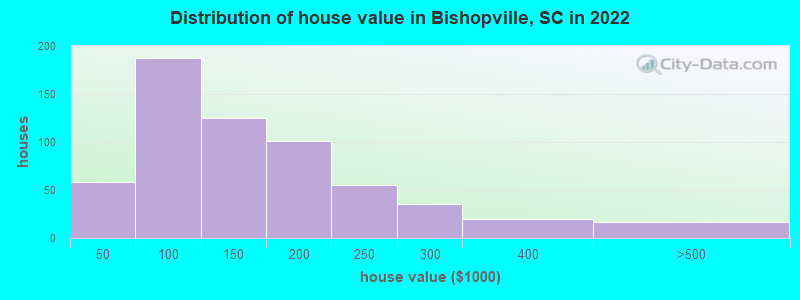
Home value of owner - occupied houses in 2022 in Bishopville, SC
-
- 29$15,000 to $19,999
- 28$20,000 to $24,999
- 63$60,000 to $69,999
- 45$70,000 to $79,999
- 67$80,000 to $89,999
- 10$90,000 to $99,999
- 34$100,000 to $124,999
- 90$125,000 to $149,999
- 99$150,000 to $174,999
- 1$175,000 to $199,999
- 54$200,000 to $249,999
- 35$250,000 to $299,999
- 20$300,000 to $399,999
- 16$400,000 to $499,999
Rent paid by renters in 2022 in Bishopville, SC
-
- 55Less than $100
- 53$100 to $149
- 32$150 to $199
- 6$200 to $249
- 19$250 to $299
- 13$300 to $349
- 34$350 to $399
- 52$400 to $449
- 22$450 to $499
- 6$500 to $549
- 5$550 to $599
- 56$600 to $649
- 98$650 to $699
- 27$700 to $749
- 10$750 to $799
- 41$800 to $899
- 24$1,500 to $1,999
- 85No cash rent


Percentage of workers working in this county: 56.3%
Number of people working at home: 37 (3.3% of all workers)
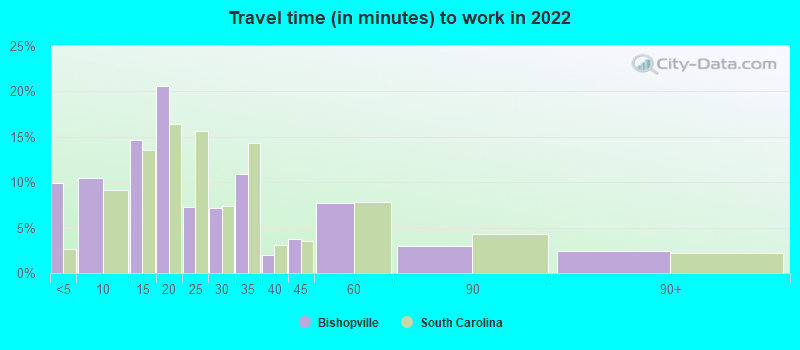
Travel time to work (commute)
- Less than 5 minutes: 89
- 5 to 9 minutes: 183
- 10 to 14 minutes: 175
- 15 to 19 minutes: 155
- 20 to 24 minutes: 42
- 25 to 29 minutes: 15
- 30 to 34 minutes: 173
- 35 to 39 minutes: 65
- 40 to 44 minutes: 25
- 45 to 59 minutes: 70
- 60 to 89 minutes: 42
- 90 or more minutes: 2
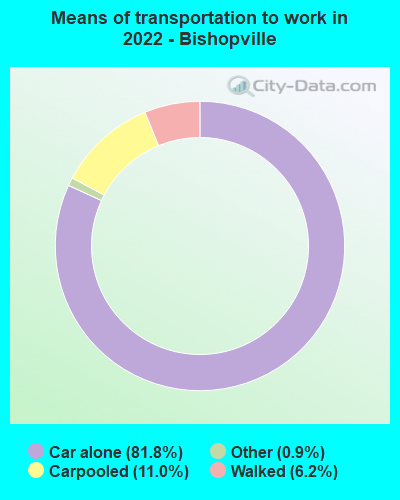
Means of transportation to work:
- Drove a car alone: 1,777 (77.8%)
- Carpooled: 251 (11.0%)
- Taxi: 22 (1.0%)
- Walked: 125 (5.5%)
- Worked at home: 37 (1.6%)

- Unemployment by race in 2022
- Unemployment rate for White non-Hispanic residents
- 2.1%Males
- Unemployment rate for Black residents
- 3.8%Males
- 5.3%Females

- Year of entry for the foreign-born population in Bishopville, South Carolina
- 2042010 or later
- 112000 to 2009
- 01990 to 1999
- 151980 to 1989
- 81970 to 1979
- 0Before 1970
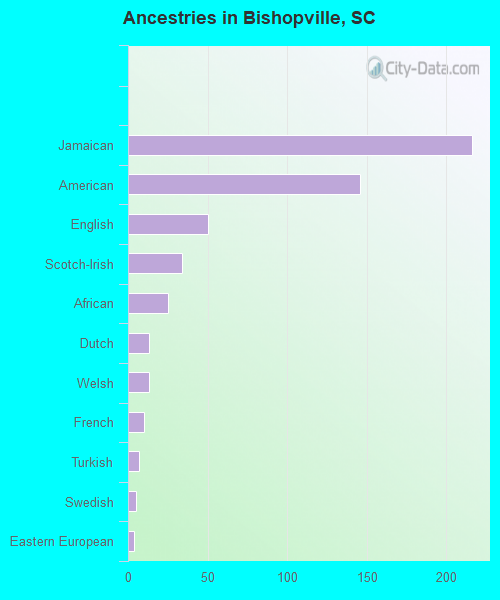
First ancestries reported:
- Jamaican: 216 (9.4%)
- American: 146 (6.4%)
- English: 50 (2.2%)
- Scotch-Irish: 34 (1.5%)
- African: 25 (1.1%)
- Dutch: 13 (0.6%)
- Welsh: 13 (0.6%)
- French: 10 (0.4%)
- Turkish: 7 (0.3%)
- Swedish: 5 (0.2%)
- Eastern European: 4 (0.2%)
Most common places of birth for foreign-born residents (%):
| Bishopville: | 87.2% (171) |
| South Carolina: | 2.6% (7,073) |
| Bishopville: | 5.1% (10) |
| South Carolina: | 22.5% (60,774) |
Place of birth for U.S.-born residents:
- This state: 2,204
- Other state: 601
- Northeast: 271
- Midwest: 44
- South: 282
- West: 0
88.4% of Bishopville residents lived in the same house 1 years ago.
Out of people who lived in different houses, 19.5% lived in this county.
Out of people who lived in different counties, 97.6% lived in South Carolina.
| Bishopville: | 88.4% |
| State average: | 86.5% |
Education attainment for males 25 years and older:
- No schooling: 39
- Nursery to 4th grade: 1
- 5th and 6th grade: 0
- 7th and 8th grade: 46
- 9th grade: 15
- 10th grade: 27
- 11th grade: 23
- 12th grade, no diploma: 46
- High school graduate (or equivalency): 416
- Less than 1 year of college: 32
- Some college more than 1 year, no degree: 165
- Associate degree: 89
- Bachelor's degree: 147
- Master's degree: 57
- Professional school degree: 12
- Doctorate degree: 32

Education attainment for females 25 years and older:
- No schooling: 3
- Nursery to 4th grade: 0
- 5th and 6th grade: 0
- 7th and 8th grade: 11
- 9th grade: 25
- 10th grade: 5
- 11th grade: 58
- 12th grade, no diploma: 0
- High school graduate (or equivalency): 391
- Less than 1 year of college: 63
- Some college more than 1 year, no degree: 193
- Associate degree: 79
- Bachelor's degree: 163
- Master's degree: 72
- Professional school degree: 0
- Doctorate degree: 0


Housing units in structures:
- One, detached: 1,065
- One, attached: 15
- Two: 65
- 3 or 4: 246
- 5 to 9: 88
- 20 to 49: 56
- 50 or more: 19
- Mobile homes: 65
Housing units lacking complete kitchen facilities in 2022: 3.9%
House/condo owner moved in on average 16 years ago
Renter moved in on average 7 years ago

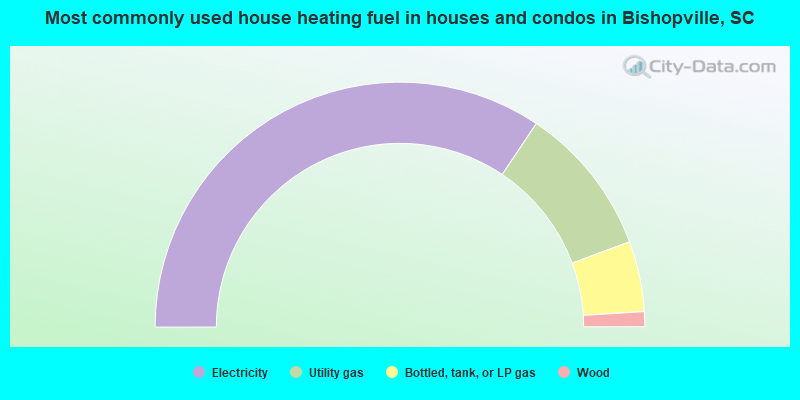
- 68.8%Electricity
- 19.9%Utility gas
- 9.3%Bottled, tank, or LP gas
- 2.0%Wood
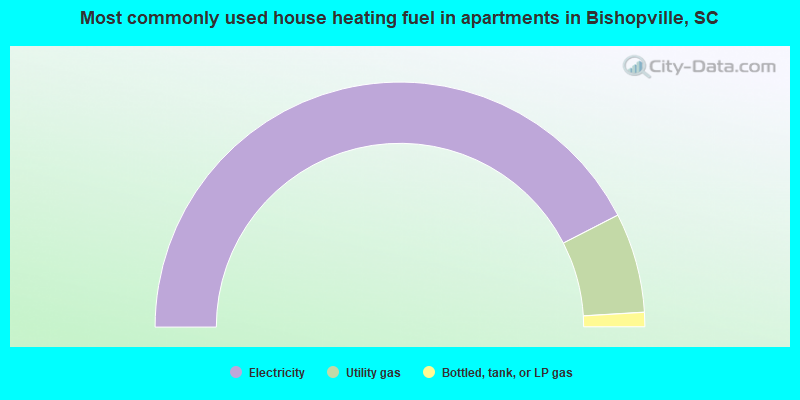
- 84.9%Electricity
- 13.2%Utility gas
- 1.9%Bottled, tank, or LP gas
Private vs. public school enrollment:
| Here: | 7.1% |
| South Carolina: | 14.4% |
| Here: | 19.0% |
| South Carolina: | 11.1% |
| Here: | 0.0% |
| South Carolina: | 21.9% |


