Black Diamond, WA (Washington) Houses and Residents
| Black Diamond: | $845,669 |
| Washington: | $569,500 |
Mean price in 2022:
Detached houses: $784,939
Here: $784,939 State: $734,307 Mobile homes: $233,335
Here: $233,335 State: $218,362
Total population: 4,338 (Urban population: 3,720, Rural population: 199 (all nonfarm))
Houses: 2,240 (2,139 occupied: 1,846 owner occupied, 290 renter occupied)
| % of renters here: | 14% |
| State: | 36% |
Housing density: 417 houses/condos per square mile
Median price asked for vacant for-sale houses and condos in 2022 in this county: $843,880.
Median gross rent in Black Diamond, WA in 2022: $1,393
Housing units in Black Diamond with a mortgage: 1,338 (238 second mortgage, 0 home equity loan, 198 both second mortgage and home equity loan)
Houses without a mortgage: 0
Median household income for houses/condos with a mortgage: $150,137
Median household income for apartments without a mortgage: $130,215
Median monthly housing costs: $2,294
Compare current foreclosures near Black Diamond, WA:
| Photo | Address | Area | Beds / Baths | Price | Details |
|---|---|---|---|---|---|

|
#1
218th Ave SE
Black Diamond, WA 98010
|
1,290 sq. feet
|
1 baths 3 beds |
show details | |

|
#2
Terrace Pl
Black Diamond, WA 98010
|
1,390 sq. feet
|
1 baths 3 beds |
show details | |

|
#3
SE Cottonwood St
Black Diamond, WA 98010
|
- sq. feet
|
- baths - beds |
show details | |

|
#4
SE Fir St, Apt L202
Black Diamond, WA 98010
|
- sq. feet
|
- baths - beds |
show details | |

|
#5
Stuart Ave SE
Black Diamond, WA 98010
|
- sq. feet
|
- baths - beds |
show details | |

|
#6
3rd Ave, Trlr 301
Black Diamond, WA 98010
|
- sq. feet
|
- baths - beds |
show details | |

|
#7
Newport Way NW Apt D2
Issaquah, WA 98027
|
1,545 sq. feet
|
2 baths 3 beds |
show details | |

|
#8
57th Ave S Unit B104
Seattle, WA 98178
|
572 sq. feet
|
1 baths 1 beds |
show details | |

|
#9
42nd Ave S Apt 101
Kent, WA 98032
|
995 sq. feet
|
2 baths 2 beds |
show details | |

|
#10
13th Pl S
Seattle, WA 98198
|
1,490 sq. feet
|
1 baths 4 beds |
show details |
| Photo | Address | Area | Beds / Baths | Price | Details |
|---|---|---|---|---|---|

|
#11
42nd Ct NE
Auburn, WA 98002
|
1,584 sq. feet
|
2 baths 3 beds |
show details | |

|
#12
112th Ave SE Apt A105
Kent, WA 98031
|
1,416 sq. feet
|
3 baths 3 beds |
show details | |

|
#13
Military Rd S Apt 3
Seattle, WA 98188
|
1,053 sq. feet
|
2 baths 2 beds |
show details | |

|
#14
279th Avenue Ct E
Wilkeson, WA 98396
|
2,880 sq. feet
|
2 baths 4 beds |
show details | |

|
#15
N 3rd St
Renton, WA 98057
|
610 sq. feet
|
1 baths 1 beds |
show details | |

|
#16
25th Ave S
Seattle, WA 98198
|
1,140 sq. feet
|
1 baths 4 beds |
show details | |

|
#17
S 272nd St
Seattle, WA 98198
|
960 sq. feet
|
1 baths 2 beds |
show details | |

|
#18
9th Ave S
Federal Way, WA 98003
|
1,000 sq. feet
|
1 baths 3 beds |
show details | |

|
#19
SE Petrovitsky Rd
Renton, WA 98058
|
860 sq. feet
|
1 baths 2 beds |
show details | |

|
#20
S 359th St
Federal Way, WA 98003
|
1,096 sq. feet
|
1 baths 2 beds |
show details |
| Photo | Address | Area | Beds / Baths | Price | Details |
|---|---|---|---|---|---|

|
#21
50th St SE
Auburn, WA 98092
|
2,560 sq. feet
|
2 baths 5 beds |
show details | |

|
#22
SW Gibson Ln
Issaquah, WA 98027
|
2,290 sq. feet
|
3 baths 3 beds |
show details | |

|
#23
NE 13th Pl
Renton, WA 98059
|
3,190 sq. feet
|
2 baths 3 beds |
show details | |

|
#24
28th St E
Bonney Lake, WA 98391
|
3,330 sq. feet
|
3 baths 3 beds |
show details | |

|
#25
S 261st Pl
Seattle, WA 98198
|
1,730 sq. feet
|
1 baths 4 beds |
show details | |

|
#26
158th Pl SE
Renton, WA 98058
|
2,350 sq. feet
|
3 baths 4 beds |
show details | |

|
#27
Driftwood Dr E
Bonney Lake, WA 98391
|
5,661 sq. feet
|
4 baths 5 beds |
show details | |

|
#28
S 316th St
Auburn, WA 98001
|
2,010 sq. feet
|
2 baths 5 beds |
show details | |

|
#29
SE 217th Pl
Kent, WA 98031
|
1,260 sq. feet
|
1 baths 3 beds |
show details | |

|
#30
4th Ave S
Federal Way, WA 98003
|
2,120 sq. feet
|
3 baths 5 beds |
show details |
| Photo | Address | Area | Beds / Baths | Price | Details |
|---|---|---|---|---|---|

|
#31
8th Ave S
Seattle, WA 98198
|
2,870 sq. feet
|
3 baths 5 beds |
show details | |

|
#32
Auburn Way S Apt 41
Auburn, WA 98092
|
1,259 sq. feet
|
3 baths 3 beds |
show details | |

|
#33
SE Groshell St
Snoqualmie, WA 98065
|
2,540 sq. feet
|
4 baths 3 beds |
show details | |

|
#34
118th Pl SE
Kent, WA 98030
|
1,260 sq. feet
|
2 baths 3 beds |
show details | |

|
#35
9th Avenue Ct SE
Puyallup, WA 98372
|
1,262 sq. feet
|
1 baths 3 beds |
show details | |

|
#36
Mountain View Ln NW
Issaquah, WA 98027
|
2,442 sq. feet
|
4 baths 3 beds |
show details | |

|
#37
5th Pl NE
Issaquah, WA 98029
|
1,270 sq. feet
|
3 baths 3 beds |
show details | |

|
#38
S 170th St
Seattle, WA 98188
|
2,650 sq. feet
|
2 baths 5 beds |
show details | |

|
#39
119th Ave SE
Kent, WA 98030
|
2,760 sq. feet
|
2 baths 4 beds |
show details | |

|
#40
S 182nd St
Seattle, WA 98188
|
1,168 sq. feet
|
2 baths 3 beds |
show details |
| Photo | Address | Area | Beds / Baths | Price | Details |
|---|---|---|---|---|---|

|
#41
55th St SE
Auburn, WA 98092
|
2,680 sq. feet
|
3 baths 4 beds |
show details | |

|
#42
48th Ave S
Seattle, WA 98188
|
1,650 sq. feet
|
3 baths 3 beds |
show details | |

|
#43
SE 176th St
Renton, WA 98058
|
1,300 sq. feet
|
2 baths 2 beds |
show details | |

|
#44
34th St E
Puyallup, WA 98371
|
6,331 sq. feet
|
3 baths 5 beds |
show details | |

|
#45
34th St E
Puyallup, WA 98371
|
6,331 sq. feet
|
4 baths 5 beds |
show details | |

|
#46
SW 294th St
Federal Way, WA 98023
|
3,350 sq. feet
|
3 baths 5 beds |
show details | |

|
#47
J St SE
Auburn, WA 98002
|
1,090 sq. feet
|
2 baths 3 beds |
show details | |

|
#48
1st Ave S
Federal Way, WA 98003
|
5,280 sq. feet
|
3 baths 4 beds |
show details | |

|
#49
17th St SE
Auburn, WA 98002
|
1,987 sq. feet
|
2 baths 4 beds |
show details | |

|
Check over 1 million property listings on Foreclosure.com!
|
browse all offers | |||


Median year apartment built: 1975
Household type by relationship:
Households: 5,343- Male householders: 1,212 (279 living alone), Female householders: 870 (168 living alone)
1,227 spouses (1,227 opposite-sex spouses), 63 unmarried partners, (63 opposite-sex unmarried partners), 1,661 children (1,602 natural, 58 adopted, 0 stepchildren), 35 grandchildren, 52 brothers or sisters, 32 parents, 0 foster children, 48 other relatives, 139 non-relatives
Size of family households: 643 2-persons, 415 3-persons, 341 4-persons, 65 5-persons, 22 6-persons.
Size of nonfamily households: 482 1-person, 106 2-persons, 34 3-persons.
1,006 married couples with children.
223 single-parent households (203 men, 20 women).
88.3% of residents of Black Diamond speak English at home.
3.8% of residents speak Spanish at home (35% speak English very well, 65% speak English not well).
1.9% of residents speak other Indo-European language at home (89% speak English very well, 11% speak English well).
3.8% of residents speak Asian or Pacific Island language at home (100% speak English very well).
Foreign born population: 527 (9.9%)
(57.5% of them are naturalized citizens)
| Here: | 7.7 |
| State: | 6.5 |
| Here: | 4.7 |
| State: | 3.9 |

- Bedrooms in owner-occupied houses and condos in Black Diamond, Washington
- 0no bedroom
- 01 bedroom
- 1252 bedrooms
- 8303 bedrooms
- 6544 bedrooms
- 2375+ bedrooms

- Bedrooms in renter-occupied apartments in Black Diamond, Washington
- 25no bedroom
- 221 bedroom
- 902 bedrooms
- 1213 bedrooms
- 344 bedrooms
- 05+ bedrooms

- Cars and other vehicles available in Black Diamond in owner-occupied houses/condos
- 9no vehicle
- 2071 vehicle
- 9152 vehicles
- 5623 vehicles
- 554 vehicles
- 985+ vehicles

- Cars and other vehicles available in Black Diamond in renter-occupied apartments
- 10no vehicle
- 1791 vehicle
- 452 vehicles
- 263 vehicles
- 134 vehicles
- 175+ vehicles

- Rooms in owner-occupied houses in Black Diamond, Washington
- 01 room
- 02 rooms
- 213 rooms
- 294 rooms
- 3615 rooms
- 2436 rooms
- 2077 rooms
- 2448 rooms
- 7419+ rooms

- Rooms in renter-occupied apartments in Black Diamond, Washington
- 01 room
- 252 rooms
- 143 rooms
- 1004 rooms
- 365 rooms
- 346 rooms
- 317 rooms
- 348 rooms
- 179+ rooms


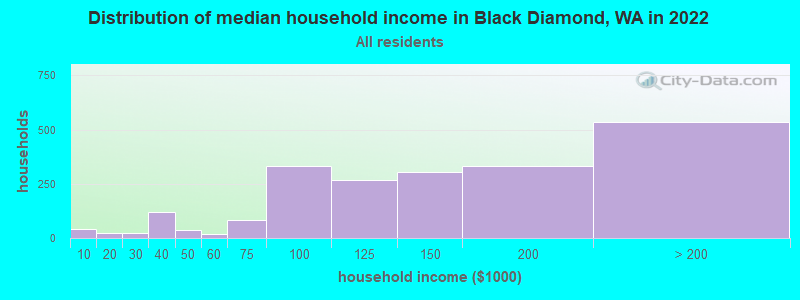
Black Diamond, WA household income distribution

- 43Less than $10,000
- 21$10,000 to $19,999
- 22$20,000 to $29,999
- 119$30,000 to $39,999
- 37$40,000 to $49,999
- 18$50,000 to $59,999
- 82$60,000 to $74,999
- 333$75,000 to $99,999
- 269$100,000 to $124,999
- 306$125,000 to $149,999
- 333$150,000 to $199,999
- 535$200,000 or more
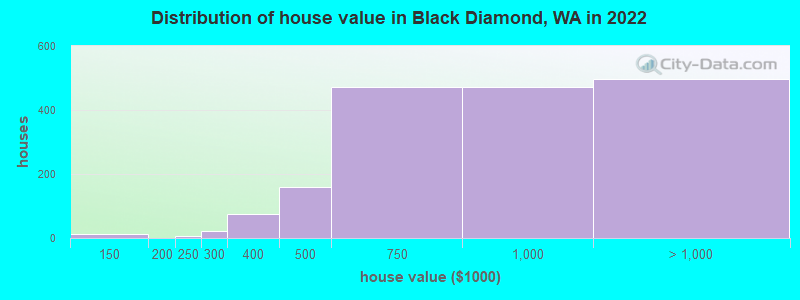
Home value of owner - occupied houses in 2022 in Black Diamond, WA
-
- 12$100,000 to $124,999
- 5$200,000 to $249,999
- 22$250,000 to $299,999
- 75$300,000 to $399,999
- 159$400,000 to $499,999
- 471$500,000 to $749,999
- 472$750,000 to $999,999
- 392$1,000,000 to $1,499,999
- 89$1,500,000 to $1,999,999
- 15$2,000,000 or more
Rent paid by renters in 2022 in Black Diamond, WA
-
- 81Less than $100
- 36$500 to $549
- 7$550 to $599
- 19$600 to $649
- 9$750 to $799
- 20$900 to $999
- 16$1,250 to $1,499
- 25$1,500 to $1,999
- 56$2,000 to $2,499
- 28$2,500 to $2,999
- 4No cash rent

Percentage of workers working in this county: 94.7%
Number of people working at home: 814 (27.4% of all workers)
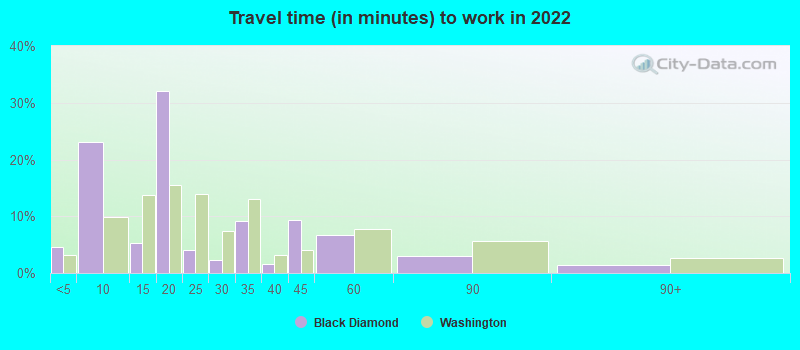
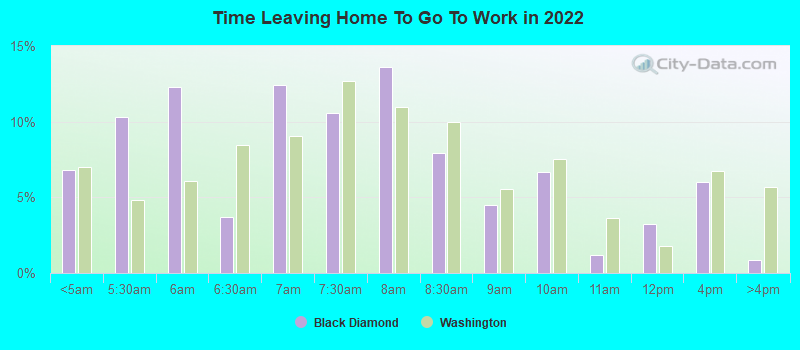
Travel time to work (commute)
- Less than 5 minutes: 46
- 5 to 9 minutes: 220
- 10 to 14 minutes: 95
- 15 to 19 minutes: 242
- 20 to 24 minutes: 226
- 25 to 29 minutes: 36
- 30 to 34 minutes: 234
- 35 to 39 minutes: 99
- 40 to 44 minutes: 166
- 45 to 59 minutes: 319
- 60 to 89 minutes: 187
- 90 or more minutes: 151
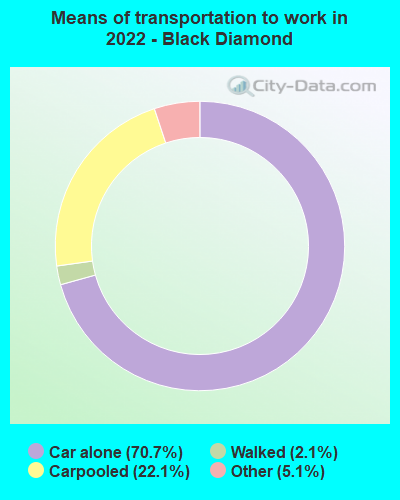
Means of transportation to work:
- Drove a car alone: 793 (44.9%)
- Carpooled: 238 (13.5%)
- Taxi: 51 (2.9%)
- Walked: 20 (1.1%)
- Worked at home: 814 (46.1%)
- Unemployment by race in 2022
- Unemployment rate for White non-Hispanic residents
- 1.4%Males

- Year of entry for the foreign-born population in Black Diamond, Washington
- 1362010 or later
- 1082000 to 2009
- 1521990 to 1999
- 291980 to 1989
- 61970 to 1979
- 51Before 1970

First ancestries reported:
- German: 338 (16.5%)
- English: 213 (10.4%)
- American: 201 (9.8%)
- Italian: 134 (6.5%)
- Irish: 83 (4.0%)
- Norwegian: 74 (3.6%)
- European: 65 (3.2%)
- Ukrainian: 48 (2.3%)
- Dutch: 45 (2.2%)
- Scotch-Irish: 45 (2.2%)
- Basque: 36 (1.8%)
- Polish: 33 (1.6%)
- Scandinavian: 33 (1.6%)
- British: 23 (1.1%)
- Czech: 18 (0.9%)
- Russian: 17 (0.8%)
- Canadian: 16 (0.8%)
- Swedish: 16 (0.8%)
- French Canadian: 13 (0.6%)
- French: 12 (0.6%)
- Estonian: 9 (0.4%)
- Scottish: 9 (0.4%)
- Greek: 7 (0.3%)
- Northern European: 6 (0.3%)
Most common places of birth for foreign-born residents (%):
| Black Diamond: | 23.7% (125) |
| Washington: | 21.1% (241,655) |
| Black Diamond: | 18.0% (95) |
| Washington: | 6.3% (71,661) |
| Black Diamond: | 12.3% (65) |
| Washington: | 0.9% (9,937) |
| Black Diamond: | 7.6% (40) |
| Washington: | 8.9% (101,353) |
| Black Diamond: | 7.0% (37) |
| Washington: | 4.3% (48,886) |
| Black Diamond: | 6.6% (35) |
| Washington: | 0.3% (3,171) |
| Black Diamond: | 6.1% (32) |
| Washington: | 4.1% (47,238) |
| Black Diamond: | 5.3% (28) |
| Washington: | 3.1% (35,872) |
| Black Diamond: | 4.0% (21) |
| Washington: | 0.3% (3,673) |
| Black Diamond: | 3.2% (17) |
| Washington: | 1.6% (17,761) |
| Black Diamond: | 2.7% (14) |
| Washington: | 1.9% (21,540) |
| Black Diamond: | 2.5% (13) |
| Washington: | 0.5% (5,640) |
| Black Diamond: | 2.3% (12) |
| Washington: | 0.8% (8,785) |
| Black Diamond: | 2.3% (12) |
| Washington: | 0.2% (2,424) |
Place of birth for U.S.-born residents:
- This state: 2,254
- Other state: 2,489
- Northeast: 145
- Midwest: 523
- South: 685
- West: 1,124
79.5% of Black Diamond residents lived in the same house 1 years ago.
Out of people who lived in different houses, 41.3% lived in this county.
Out of people who lived in different counties, 27.7% lived in Washington.
| Black Diamond: | 79.5% |
| State average: | 85.2% |
Education attainment for males 25 years and older:
- No schooling: 0
- Nursery to 4th grade: 0
- 5th and 6th grade: 20
- 7th and 8th grade: 28
- 9th grade: 0
- 10th grade: 0
- 11th grade: 0
- 12th grade, no diploma: 0
- High school graduate (or equivalency): 277
- Less than 1 year of college: 211
- Some college more than 1 year, no degree: 231
- Associate degree: 256
- Bachelor's degree: 646
- Master's degree: 226
- Professional school degree: 61
- Doctorate degree: 20

Education attainment for females 25 years and older:
- No schooling: 0
- Nursery to 4th grade: 0
- 5th and 6th grade: 0
- 7th and 8th grade: 0
- 9th grade: 0
- 10th grade: 0
- 11th grade: 8
- 12th grade, no diploma: 0
- High school graduate (or equivalency): 285
- Less than 1 year of college: 95
- Some college more than 1 year, no degree: 141
- Associate degree: 157
- Bachelor's degree: 667
- Master's degree: 314
- Professional school degree: 12
- Doctorate degree: 52


Housing units in structures:
- One, detached: 2,087
- Mobile homes: 128
- Boats, RVs, vans, etc.: 24
House/condo owner moved in on average 8 years ago
Renter moved in on average 3 years ago

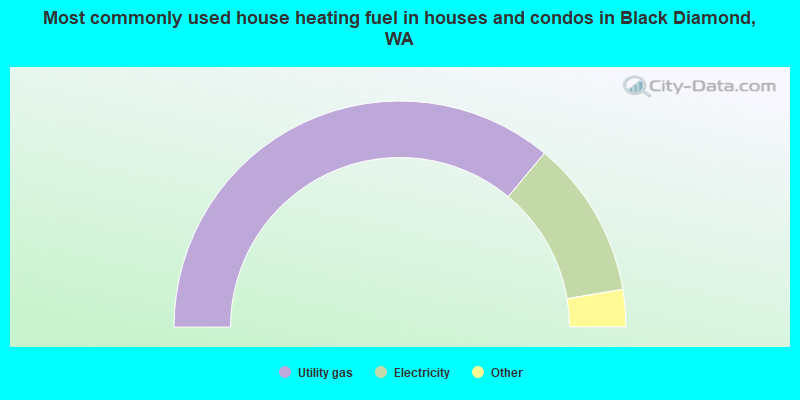
- 72.1%Utility gas
- 22.6%Electricity
- 2.0%Wood
- 1.8%Fuel oil, kerosene, etc.
- 1.4%Bottled, tank, or LP gas
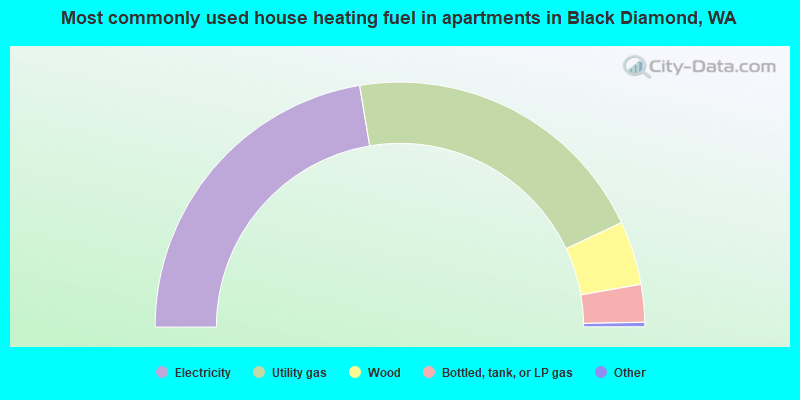
- 45.0%Electricity
- 41.5%Utility gas
- 8.5%Wood
- 5.0%Bottled, tank, or LP gas
Private vs. public school enrollment:
| Here: | 0.6% |
| Washington: | 12.4% |
| Here: | 17.0% |
| Washington: | 9.2% |
| Here: | 55.1% |
| Washington: | 16.5% |


