Black Lick, PA (Pennsylvania) Houses and Residents
| Black Lick: | $89,932 |
| Pennsylvania: | $245,500 |
Mean price in 2022:
Detached houses: $172,890
Here: $172,890 State: $317,202 Mobile homes: $55,811
Here: $55,811 State: $92,414
Total population: 1,462 (Urban population: 973 (all inside urban clusters), Rural population: 466 (all nonfarm))
Houses: 530 (432 occupied: 325 owner occupied, 104 renter occupied)
| % of renters here: | 24% |
| State: | 31% |
Housing density: 207 houses/condos per square mile
Median price asked for vacant for-sale houses and condos in 2022 in this county: $5,044.
Median contract rent in 2022: $443
Median rent asked for vacant for-rent units in 2022: $1,773
Median gross rent in Black Lick, PA in 2022: $552
Housing units in Black Lick with a mortgage: 94 (32 second mortgage, 0 home equity loan, 34 both second mortgage and home equity loan)
Houses without a mortgage: 0
Median household income for houses/condos with a mortgage: $96,388
Median household income for apartments without a mortgage: $29,193
Median monthly housing costs: $547
Compare current foreclosures near Black Lick, PA:
| Photo | Address | Area | Beds / Baths | Price | Details |
|---|---|---|---|---|---|

|
#1
Wheeler Ln
Latrobe, PA 15650
|
2,212 sq. feet
|
2 baths 3 beds |
$52,500
|
show details |

|
#2
Railroad St
Derry, PA 15627
|
- sq. feet
|
1 baths 3 beds |
$33,300
|
show details |

|
#3
W 4th Ave
Derry, PA 15627
|
- sq. feet
|
1 baths 4 beds |
$39,900
|
show details |

|
#4
Indiana Avenue Ext
Avonmore, PA 15618
|
- sq. feet
|
2 baths 4 beds |
show details | |

|
#5
Westmoreland Ave
Avonmore, PA 15618
|
1,824 sq. feet
|
2 baths 4 beds |
show details | |

|
#6
Miller St
Latrobe, PA 15650
|
- sq. feet
|
2 baths 2 beds |
show details | |

|
#7
Moween Rd
Saltsburg, PA 15681
|
1,876 sq. feet
|
2 baths 3 beds |
show details | |

|
#8
Virginia Ave
Johnstown, PA 15906
|
1,160 sq. feet
|
1 baths 2 beds |
show details | |

|
#9
Pine St
Homer City, PA 15748
|
1,316 sq. feet
|
1 baths 3 beds |
show details | |

|
#10
Main St
Latrobe, PA 15650
|
1,256 sq. feet
|
1 baths 3 beds |
show details |
| Photo | Address | Area | Beds / Baths | Price | Details |
|---|---|---|---|---|---|

|
#11
Route 259
Bolivar, PA 15923
|
1,574 sq. feet
|
2 baths 3 beds |
show details | |

|
#12
Maple Ave
Blairsville, PA 15717
|
1,056 sq. feet
|
1 baths 2 beds |
show details | |

|
#13
Strangford Rd
Blairsville, PA 15717
|
- sq. feet
|
1 baths 2 beds |
show details | |

|
#14
Pauline Dr
Saltsburg, PA 15681
|
1,220 sq. feet
|
2 baths 3 beds |
show details | |

|
#15
Byron Pl
Indiana, PA 15701
|
- sq. feet
|
2 baths 3 beds |
show details | |

|
#16
E Brown St
Blairsville, PA 15717
|
- sq. feet
|
2 baths 3 beds |
show details | |

|
#17
W 2nd Ave
Derry, PA 15627
|
- sq. feet
|
1 baths 3 beds |
show details | |

|
#18
Sherwood Dr
Johnstown, PA 15905
|
- sq. feet
|
- baths - beds |
$39,900
|
show details |

|
#19
Hancock St
Clymer, PA 15728
|
- sq. feet
|
1 baths 2 beds |
show details | |

|
#20
Unity St
Latrobe, PA 15650
|
- sq. feet
|
1 baths 5 beds |
show details |
| Photo | Address | Area | Beds / Baths | Price | Details |
|---|---|---|---|---|---|

|
#21
Allen Bridge Rd
Indiana, PA 15701
|
- sq. feet
|
- baths - beds |
show details | |

|
#22
Rudder Rd
Ligonier, PA 15658
|
- sq. feet
|
- baths - beds |
show details | |

|
#23
Forest St
Latrobe, PA 15650
|
- sq. feet
|
- baths - beds |
show details | |

|
#24
Penn Run Aly
Penn Run, PA 15765
|
- sq. feet
|
- baths - beds |
show details | |

|
#25
Route 553 Hwy
Penn Run, PA 15765
|
- sq. feet
|
- baths - beds |
show details | |

|
#26
Trolley St
Blairsville, PA 15717
|
- sq. feet
|
- baths - beds |
show details | |

|
#27
S Ridge Rd
Shelocta, PA 15774
|
- sq. feet
|
- baths - beds |
show details | |

|
#28
Hopewell Ave
Saltsburg, PA 15681
|
- sq. feet
|
- baths - beds |
show details | |

|
#29
State Route 981
Latrobe, PA 15650
|
- sq. feet
|
- baths - beds |
show details | |

|
#30
Mitchell Dr Apt 102
Latrobe, PA 15650
|
- sq. feet
|
- baths - beds |
show details |
| Photo | Address | Area | Beds / Baths | Price | Details |
|---|---|---|---|---|---|

|
#31
Iselin Rd
Saltsburg, PA 15681
|
- sq. feet
|
- baths - beds |
show details | |

|
#32
Mccurdy Trl
Ligonier, PA 15658
|
- sq. feet
|
- baths - beds |
show details | |

|
#33
S Lytle Rd
Shelocta, PA 15774
|
- sq. feet
|
- baths - beds |
show details | |

|
#34
Ropers View Rd
Vintondale, PA 15961
|
- sq. feet
|
- baths - beds |
show details | |

|
#35
Spruce Ln
Indiana, PA 15701
|
- sq. feet
|
- baths - beds |
show details | |

|
#36
S Ruby St
Derry, PA 15627
|
- sq. feet
|
- baths - beds |
show details | |

|
#37
Barkley Church Rd
Homer City, PA 15748
|
- sq. feet
|
- baths - beds |
show details | |

|
#38
11th Street
Bradenville, PA 15620
|
- sq. feet
|
- baths - beds |
show details | |

|
#39
E Harrison Ave
Latrobe, PA 15650
|
- sq. feet
|
- baths - beds |
show details | |

|
#40
Indiana Ave
Avonmore, PA 15618
|
- sq. feet
|
- baths - beds |
show details |
| Photo | Address | Area | Beds / Baths | Price | Details |
|---|---|---|---|---|---|

|
#41
Receski Rd
Indiana, PA 15701
|
- sq. feet
|
- baths - beds |
show details | |

|
#42
Ben Franklin Hwy, # 31
Belsano, PA 15922
|
- sq. feet
|
- baths - beds |
show details | |

|
#43
Roskovensky Rd
Latrobe, PA 15650
|
- sq. feet
|
- baths - beds |
show details | |

|
#44
Horrell Rd
Apollo, PA 15613
|
- sq. feet
|
- baths - beds |
show details | |

|
#45
Franklin St
Clymer, PA 15728
|
- sq. feet
|
- baths - beds |
show details | |

|
#46
Rear Sunshine Avenue
Johnstown, PA 15905
|
- sq. feet
|
- baths - beds |
show details | |

|
#47
Julia Dr
Johnstown, PA 15905
|
- sq. feet
|
- baths - beds |
show details | |

|
#48
Cool Springs Ln
Ligonier, PA 15658
|
- sq. feet
|
- baths - beds |
show details | |

|
#49
Pine Dr
New Alexandria, PA 15670
|
- sq. feet
|
- baths - beds |
show details | |

|
Check over 1 million property listings on Foreclosure.com!
|
browse all offers | |||


 | Anyone remember this bar in Homer City? (23 replies) |
| Blairsville and surrounding areas (14 replies) |

Median year apartment built: 1963
Household type by relationship:
Households: 993- Male householders: 243 (49 living alone), Female householders: 187 (72 living alone)
218 spouses (218 opposite-sex spouses), 13 unmarried partners, (13 opposite-sex unmarried partners), 177 children (153 natural, 0 adopted, 23 stepchildren), 18 grandchildren, 31 brothers or sisters, 15 parents, 0 foster children, 48 other relatives, 0 non-relatives
- In group quarters: 37
Size of family households: 229 2-persons, 21 3-persons, 45 5-persons.
Size of nonfamily households: 119 1-person, 8 2-persons.
99 married couples with children.
4 single-parent households (4 men, 0 women).
100.3% of residents of Black Lick speak English at home.
0.1% of residents speak Spanish at home (100% speak English not well).
| Here: | 5.6 |
| State: | 6.8 |
| Here: | 3.2 |
| State: | 4.3 |

- Bedrooms in owner-occupied houses and condos in Black Lick, Pennsylvania
- 0no bedroom
- 101 bedroom
- 1092 bedrooms
- 1933 bedrooms
- 74 bedrooms
- 75+ bedrooms

- Bedrooms in renter-occupied apartments in Black Lick, Pennsylvania
- 11no bedroom
- 541 bedroom
- 242 bedrooms
- 03 bedrooms
- 164 bedrooms
- 05+ bedrooms

- Cars and other vehicles available in Black Lick in owner-occupied houses/condos
- 18no vehicle
- 1001 vehicle
- 1612 vehicles
- 293 vehicles
- 04 vehicles
- 185+ vehicles

- Cars and other vehicles available in Black Lick in renter-occupied apartments
- 25no vehicle
- 611 vehicle
- 192 vehicles
- 03 vehicles
- 04 vehicles
- 05+ vehicles

- Rooms in owner-occupied houses in Black Lick, Pennsylvania
- 01 room
- 02 rooms
- 03 rooms
- 494 rooms
- 1205 rooms
- 956 rooms
- 07 rooms
- 488 rooms
- 149+ rooms

- Rooms in renter-occupied apartments in Black Lick, Pennsylvania
- 111 room
- 02 rooms
- 543 rooms
- 164 rooms
- 05 rooms
- 06 rooms
- 247 rooms
- 08 rooms
- 09+ rooms


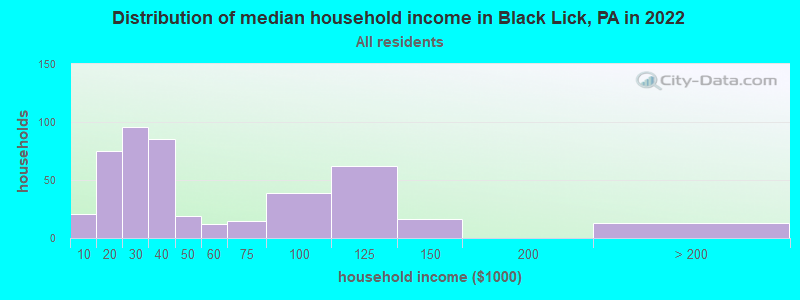
Black Lick, PA household income distribution

- 21Less than $10,000
- 75$10,000 to $19,999
- 96$20,000 to $29,999
- 85$30,000 to $39,999
- 19$40,000 to $49,999
- 12$50,000 to $59,999
- 15$60,000 to $74,999
- 39$75,000 to $99,999
- 62$100,000 to $124,999
- 16$125,000 to $149,999
- 13$200,000 or more
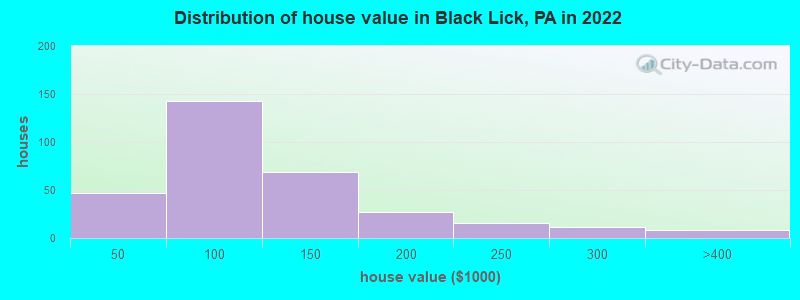
Home value of owner - occupied houses in 2022 in Black Lick, PA
-
- 26$10,000 to $14,999
- 13$20,000 to $24,999
- 7$40,000 to $49,999
- 7$50,000 to $59,999
- 27$60,000 to $69,999
- 82$70,000 to $79,999
- 5$80,000 to $89,999
- 13$90,000 to $99,999
- 27$100,000 to $124,999
- 41$125,000 to $149,999
- 7$150,000 to $174,999
- 19$175,000 to $199,999
- 15$200,000 to $249,999
- 10$250,000 to $299,999
- 7$300,000 to $399,999
Rent paid by renters in 2022 in Black Lick, PA
-
- 6$100 to $149
- 6$150 to $199
- 8$250 to $299
- 7$400 to $449
- 23$450 to $499
- 14$500 to $549
- 11$1,250 to $1,499
- 26No cash rent


Percentage of workers working in this county: 79.6%
Number of people working at home: 0 (0.0% of all workers)
Travel time to work (commute)
- Less than 5 minutes: 19
- 5 to 9 minutes: 152
- 10 to 14 minutes: 27
- 15 to 19 minutes: 26
- 20 to 24 minutes: 97
- 25 to 29 minutes: 0
- 30 to 34 minutes: 44
- 35 to 39 minutes: 0
- 40 to 44 minutes: 0
- 45 to 59 minutes: 0
- 60 to 89 minutes: 9
- 90 or more minutes: 0
Means of transportation to work:
- Drove a car alone: 420 (77.5%)
- Carpooled: 65 (12.0%)
- Bus or trolley bus: 8 (1.5%)
- Walked: 32 (5.9%)
- Worked at home: 17 (3.1%)


- Year of entry for the foreign-born population in Black Lick, Pennsylvania
- 61995 to March 2000
- 01990 to 1994
- 01985 to 1989
- 01980 to 1984
- 01975 to 1979
- 31970 to 1974
- 01965 to 1969
- 0Before 1965

First ancestries reported:
- German: 127 (37.7%)
- American: 59 (17.5%)
- English: 28 (8.3%)
- Irish: 24 (7.1%)
- Polish: 18 (5.3%)
- Italian: 16 (4.7%)
- Czechoslovakian: 14 (4.2%)
- Scotch-Irish: 13 (3.9%)
- Welsh: 12 (3.6%)
- Hungarian: 7 (2.1%)
- Slovene: 6 (1.8%)
- Scottish: 5 (1.5%)
Most common places of birth for foreign-born residents (%):
| Black Lick: | 66.7% (6) |
| Pennsylvania: | 0.9% (4,385) |
| Black Lick: | 33.3% (3) |
| Pennsylvania: | 5.1% (25,685) |
Place of birth for U.S.-born residents:
- This state: 851
- Other state: 131
- Northeast: 28
- Midwest: 23
- South: 59
- West: 16
98.5% of Black Lick residents lived in the same house 1 years ago.
Out of people who lived in different houses, 33.3% lived in this county.
Out of people who lived in different counties, 0.0% lived in Pennsylvania.
| Black Lick: | 98.5% |
| State average: | 89.3% |
Education attainment for males 25 years and older:
- No schooling: 41
- Nursery to 4th grade: 0
- 5th and 6th grade: 0
- 7th and 8th grade: 0
- 9th grade: 12
- 10th grade: 29
- 11th grade: 27
- 12th grade, no diploma: 27
- High school graduate (or equivalency): 120
- Less than 1 year of college: 86
- Some college more than 1 year, no degree: 36
- Associate degree: 20
- Bachelor's degree: 70
- Master's degree: 5
- Professional school degree: 0
- Doctorate degree: 0

Education attainment for females 25 years and older:
- No schooling: 1
- Nursery to 4th grade: 0
- 5th and 6th grade: 0
- 7th and 8th grade: 10
- 9th grade: 0
- 10th grade: 32
- 11th grade: 54
- 12th grade, no diploma: 9
- High school graduate (or equivalency): 147
- Less than 1 year of college: 75
- Some college more than 1 year, no degree: 14
- Associate degree: 63
- Bachelor's degree: 6
- Master's degree: 14
- Professional school degree: 0
- Doctorate degree: 0


Housing units in structures:
- One, detached: 282
- Two: 21
- 3 or 4: 7
- 5 to 9: 64
- 10 to 19: 10
- 20 to 49: 10
- Mobile homes: 130
House/condo owner moved in on average 24 years ago
Renter moved in on average 8 years ago

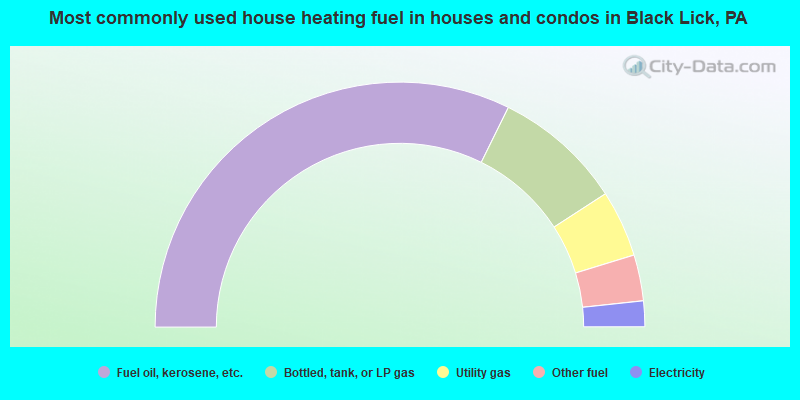
- 64.6%Fuel oil, kerosene, etc.
- 17.1%Bottled, tank, or LP gas
- 8.8%Utility gas
- 6.1%Other fuel
- 3.4%Electricity
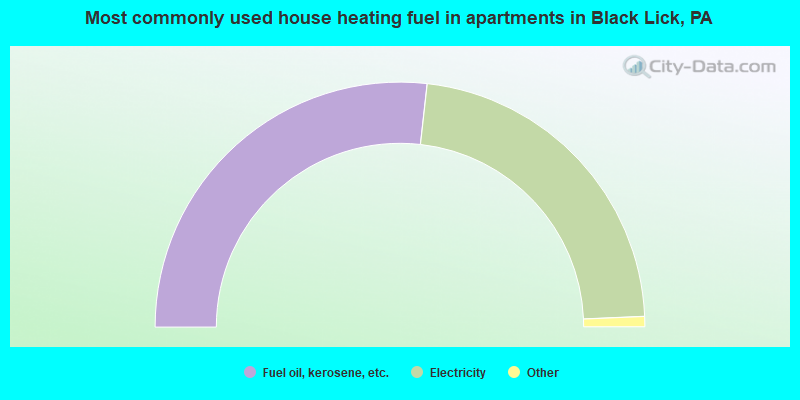
- 54.3%Fuel oil, kerosene, etc.
- 45.7%Electricity
Private vs. public school enrollment:
| Here: | 0.0% |
| Pennsylvania: | 15.7% |
| Here: | 0.0% |
| Pennsylvania: | 13.4% |
| Here: | 0.0% |
| Pennsylvania: | 39.8% |


