Bloomington, IL (Illinois) Houses and Residents
Estimated median house or condo value in 2022: $185,300 (it was $108,200 in 2000 )
Bloomington:
$185,300Illinois:
$251,600
Lower value quartile - upper value quartile: $126,000 - $287,200Mean price in 2022: Detached houses: $255,847 Here:
$255,847State:
$310,164
Townhouses or other attached units: $217,347 Here:
$217,347State:
$286,230
In 2-unit structures: $141,796 Here:
$141,796State:
$299,638
In 3-to-4-unit structures: $110,808 Here:
$110,808State:
$330,907
In 5-or-more-unit structures: $164,605 Here:
$164,605State:
$318,887
Mobile homes: $77,465 Here:
$77,465State:
$78,855
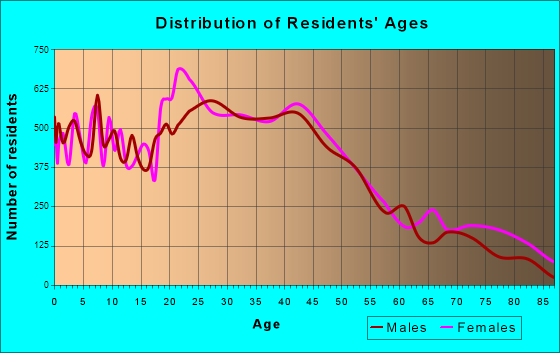
Total population: 78,730 (Urban population: 64,889, Rural population: 157 (all nonfarm) )
Houses: 38,224 (35,299 occupied: 21,428 owner occupied, 13,871 renter occupied )
% of renters here:
39%State:
33%
Housing density: 1,699 houses/condos per square mile
Median price asked for vacant for-sale houses and condos in 2022: $86,127.
Median contract rent in 2022: $808 (lower quartile is $625, upper quartile is $976)
Median rent asked for vacant for-rent units in 2022: $761
Median gross rent in Bloomington, IL in 2022: $965
Housing units in Bloomington with a mortgage: 13,390 (1,109 second mortgage, 54 home equity loan, 1,055 both second mortgage and home equity loan )Houses without a mortgage: 304
Median household income for houses/condos with a mortgage: $95,018
Median household income for apartments without a mortgage: $71,817
Median monthly housing costs: $1,040
Data:
Median house or condo value ($)
Median house or condo value ($ change since 2000)
Median house or condo value ($) - White
Median house or condo value ($) - Black or African American
Median house or condo value ($) - Asian
Median house or condo value ($) - Hispanic or Latino
Median house or condo value ($) - American Indian and Alaska Native
Median house or condo value ($) - Multirace
Median house or condo value ($) - Other Race
Median price asked for mobile homes ($)
Household density (households per square mile)
Mean house or condo value by units in structure - 1, detached ($)
Mean house or condo value by units in structure - 1, attached ($)
Mean house or condo value by units in structure - 2 ($)
Mean house or condo value by units in structure by units in structure - 3 or 4 ($)
Mean house or condo value by units in structure - 5 or more ($)
Mean house or condo value by units in structure - Boat, RV, van, etc. ($)
Mean house or condo value by units in structure - Mobile home ($)
Median contract rent ($)
Median contract rent - Lower quartile ($)
Median contract rent - Upper quartile ($)
Median gross rent ($)
Urban houses (%)
Rural houses (%)
Houses occupied (%)
Houses occupied (% change since 2000)
Houses owner occupied (%)
Houses owner occupied (% change since 2000)
Houses renter occupied (%)
Houses renter occupied (% change since 2000)
Vacant housing units - For rent (%)
Vacant housing units - For rent (% change since 2000)
Vacant housing units - For sale only (%)
Vacant housing units - For sale only (% change since 2000)
Vacant housing units - Rented or sold, not occupied (%)
Vacant housing units - Rented or sold, not occupied (% change since 2000)
Vacant housing units - For seasonal, recreational, or occasional use (%)
Vacant housing units - For seasonal, recreational, or occasional use (% change since 2000)
Vacant housing units - For migrant workers (%)
Vacant housing units - For migrant workers (% change since 2000)
Vacant housing units - Other vacant (%)
Vacant housing units - Other vacant (% change since 2000)
Median monthly housing costs ($)
Median household income for houses/condos with a mortgage ($)
Median household income for houses/condos without a mortgage ($)
Median household income ($)
Median household income ($) - White
Median household income ($) - Black or African American
Median household income ($) - Asian
Median household income ($) - Hispanic or Latino
Median household income ($) - American Indian and Alaska Native
Median household income ($) - Multirace
Median household income ($) - Other Race
Mortgage status - with mortgage (%)
Mortgage status - with second mortgage (%)
Mortgage status - with home equity loan (%)
Mortgage status - with both second mortgage and home equity loan (%)
Mortgage status - without a mortgage (%)
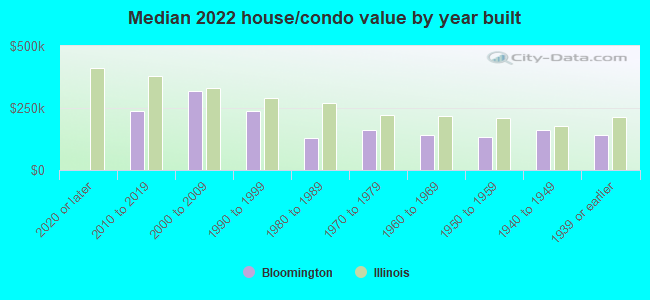
Median year house/condo built
Median year apartment built
Household type by relationship - Male householder living alone (%)
Household type by relationship - Male householder not living alone (%)
Household type by relationship - Female householder living alone (%)
Household type by relationship - Female householder not living alone (%)
Household type by relationship - Opposite-Sex spouse (%)
Household type by relationship - Same-Sex spouse (%)
Household type by relationship - Opposite-Sex unmarried partner (%)
Household type by relationship - Same-Sex unmarried partner (%)
Household type by relationship - In group quarters (%)
Size of family households - 2-person household (%)
Size of family households - 3-person household (%)
Size of family households - 4-person household (%)
Size of family households - 5-person household (%)
Size of family households - 6-person household (%)
Size of family households - 7-or-more-person household (%)
Size of nonfamily households - 1-person household (%)
Size of nonfamily households - 2-person household (%)
Size of nonfamily households - 3-person household (%)
Size of nonfamily households - 4-person household (%)
Size of nonfamily households - 5-person household (%)
Size of nonfamily households - 6-person household (%)
Size of nonfamily households - 7-or-moreperson household (%)
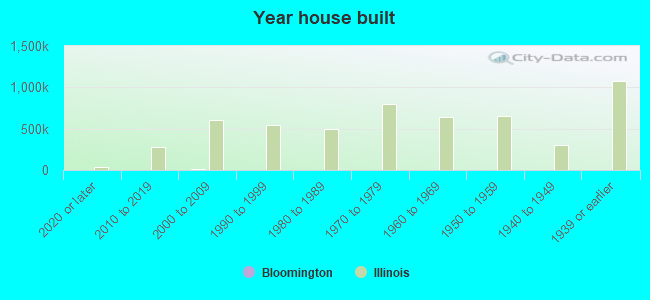
Year house built - Built 2010 or later (%)
Year house built - Built 2000 to 2009 (%)
Year house built - Built 1990 to 1999 (%)
Year house built - Built 1980 to 1989 (%)
Year house built - Built 1970 to 1979 (%)
Year house built - Built 1960 to 1969 (%)
Year house built - Built 1950 to 1959 (%)
Year house built - Built 1940 to 1949 (%)
Year house built - Built 1939 or earlier (%)
Median number of rooms in houses and condos
Median number of rooms in apartments
Median number of bedrooms in owner occupied houses
Mean number of bedrooms in owner occupied houses
Median number of bedrooms in renter occupied houses
Mean number of bedrooms in renter occupied houses
Median number of vehichles in owner occupied houses
Mean number of vehichles in owner occupied houses
Median number of vehichles in renter occupied houses
Mean number of vehichles in renter occupied houses
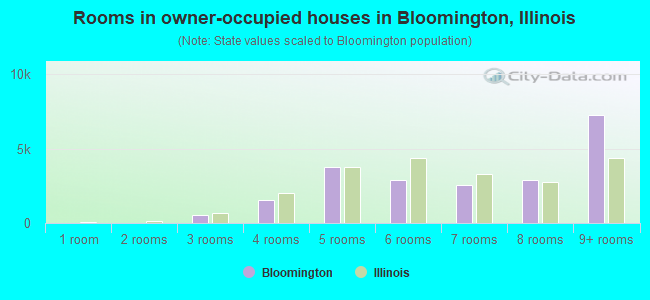
Rooms in owner-occupied houses - 1 room (%)
Rooms in owner-occupied houses - 2 rooms (%)
Rooms in owner-occupied houses - 3 rooms (%)
Rooms in owner-occupied houses - 4 rooms (%)
Rooms in owner-occupied houses - 5 rooms (%)
Rooms in owner-occupied houses - 6 rooms (%)
Rooms in owner-occupied houses - 7 rooms (%)
Rooms in owner-occupied houses - 8 rooms (%)
Rooms in owner-occupied houses - 9+ rooms (%)
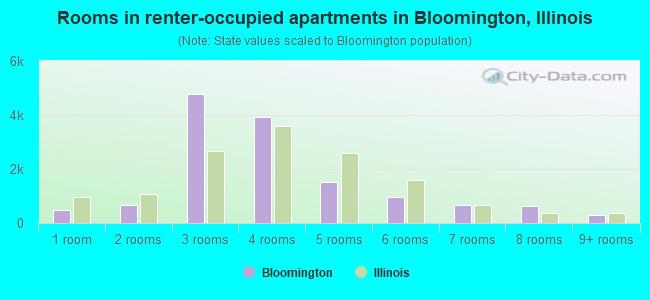
Rooms in renter-occupied houses - 1 room (%)
Rooms in renter-occupied houses - 2 rooms (%)
Rooms in renter-occupied houses - 3 rooms (%)
Rooms in renter-occupied houses - 4 rooms (%)
Rooms in renter-occupied houses - 5 rooms (%)
Rooms in renter-occupied houses - 6 rooms (%)
Rooms in renter-occupied houses - 7 rooms (%)
Rooms in renter-occupied houses - 8 rooms (%)
Rooms in renter-occupied houses - 9+ rooms (%)
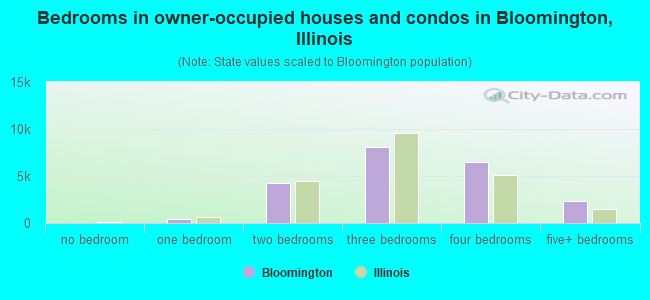
Bedrooms in owner-occupied houses - no bedrooms (%)
Bedrooms in owner-occupied houses - 1 bedroom (%)
Bedrooms in owner-occupied houses - 2 bedrooms (%)
Bedrooms in owner-occupied houses - 3 bedrooms (%)
Bedrooms in owner-occupied houses - 4 bedrooms (%)
Bedrooms in owner-occupied houses - 5+ bedrooms (%)
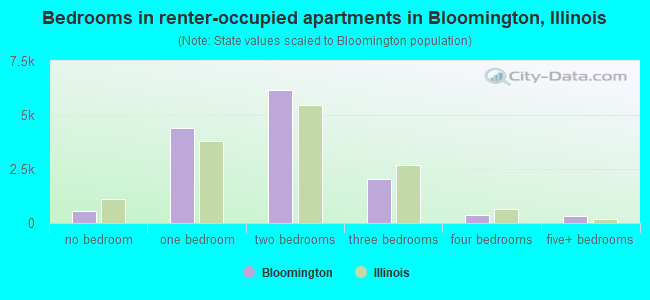
Bedrooms in renter-occupied houses - no bedrooms (%)
Bedrooms in renter-occupied houses - 1 bedroom (%)
Bedrooms in renter-occupied houses - 2 bedrooms (%)
Bedrooms in renter-occupied houses - 3 bedrooms (%)
Bedrooms in renter-occupied houses - 4 bedrooms (%)
Bedrooms in renter-occupied houses - 5+ bedrooms (%)
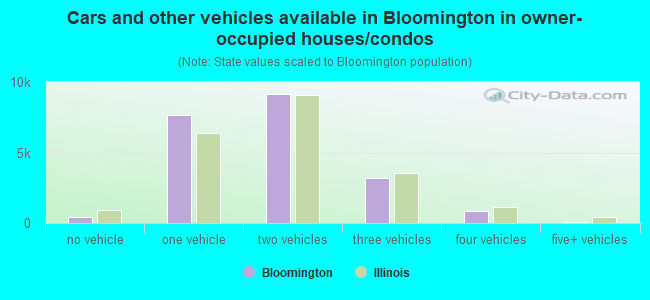
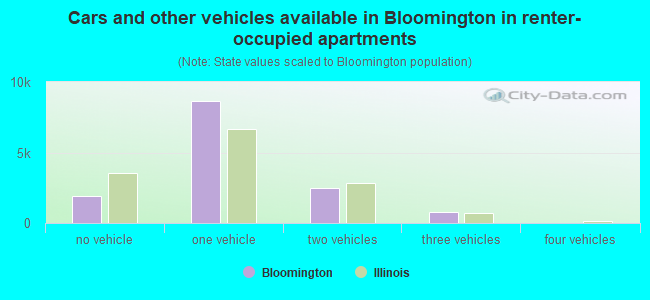
Vehicles available in owner-occupied houses - no vehicle available (%)
Vehicles available in owner-occupied houses - 1 vehicle available(%)
Vehicles available in owner-occupied houses - 2 Vehicles available (%)
Vehicles available in owner-occupied houses - 3 Vehicles available (%)
Vehicles available in owner-occupied houses - 4 Vehicles available (%)
Vehicles available in owner-occupied houses - 5+ Vehicles available (%)
Vehicles available in renter-occupied houses - no vehicle available (%)
Vehicles available in renter-occupied houses - 1 vehicle available (%)
Vehicles available in renter-occupied houses - 2 Vehicles available (%)
Vehicles available in renter-occupied houses - 3 Vehicles available (%)
Vehicles available in renter-occupied houses - 4 Vehicles available (%)
Vehicles available in renter-occupied houses - 5+ Vehicles available (%)
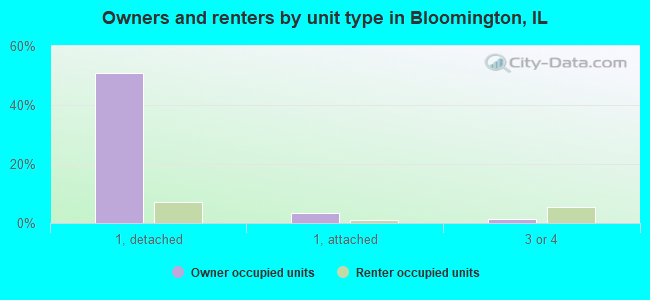
Housing units in structures - 1, detached (%)
Housing units in structures - 1, attached (%)
Housing units in structures - 2 (%)
Housing units in structures - 3 or 4 (%)
Housing units in structures - 5 to 9 (%)
Housing units in structures - 10 to 19 (%)
Housing units in structures - 20 to 49 (%)
Housing units in structures - 50 or more (%)
Housing units in structures - Mobile home (%)
Housing units in structures - Boat, RV, van, etc. (%)
Housing units in structures - Owners - 1, detached (%)
Housing units in structures - Owners - 1, attached (%)
Housing units in structures - Owners - 2 (%)
Housing units in structures - Owners - 3 or 4 (%)
Housing units in structures - Owners - 5 to 9 (%)
Housing units in structures - Owners - 10 to 19 (%)
Housing units in structures - Owners - 20 to 49 (%)
Housing units in structures - Owners - 50 or more (%)
Housing units in structures - Owners - Mobile home (%)
Housing units in structures - Owners - Boat, RV, van, etc. (%)
Housing units in structures - Renters - 1, detached (%)
Housing units in structures - Renters - 1, attached (%)
Housing units in structures - Renters - 2 (%)
Housing units in structures - Renters - 3 or 4 (%)
Housing units in structures - Renters - 5 to 9 (%)
Housing units in structures - Renters - 10 to 19 (%)
Housing units in structures - Renters - 20 to 49 (%)
Housing units in structures - Renters - 50 or more (%)
Housing units in structures - Renters - Mobile home (%)
Housing units in structures - Renters - Boat, RV, van, etc. (%)
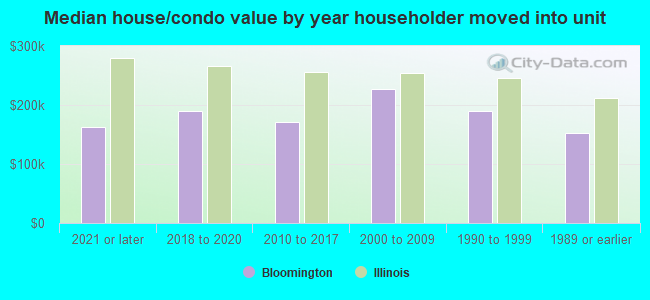
House/condo owner moved in on average (years ago)
Renter moved in on average (years ago)
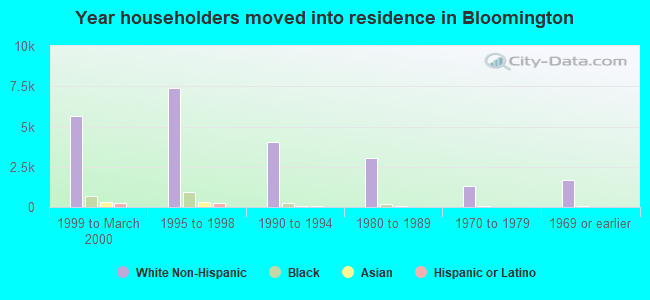
Year householder moved into unit - Moved in 1999 to March 2000 (%)
Year householder moved into unit - Moved in 1999 to March 2000 (%) - White
Year householder moved into unit - Moved in 1999 to March 2000 (%) - Black or African American
Year householder moved into unit - Moved in 1999 to March 2000 (%) - Asian
Year householder moved into unit - Moved in 1999 to March 2000 (%) - Hispanic or Latino
Year householder moved into unit - Moved in 1999 to March 2000 (%) - American Indian and Alaska Native
Year householder moved into unit - Moved in 1999 to March 2000 (%) - Multirace
Year householder moved into unit - Moved in 1999 to March 2000 (%) - Other Race
Year householder moved into unit - Moved in 1995 to 1998 (%)
Year householder moved into unit - Moved in 1995 to 1998 (%) - White
Year householder moved into unit - Moved in 1995 to 1998 (%) - Black or African American
Year householder moved into unit - Moved in 1995 to 1998 (%) - Asian
Year householder moved into unit - Moved in 1995 to 1998 (%) - Hispanic or Latino
Year householder moved into unit - Moved in 1995 to 1998 (%) - American Indian and Alaska Native
Year householder moved into unit - Moved in 1995 to 1998 (%) - Multirace
Year householder moved into unit - Moved in 1995 to 1998 (%) - Other Race
Year householder moved into unit - Moved in 1990 to 1994 (%)
Year householder moved into unit - Moved in 1990 to 1994 (%) - White
Year householder moved into unit - Moved in 1990 to 1994 (%) - Black or African American
Year householder moved into unit - Moved in 1990 to 1994 (%) - Asian
Year householder moved into unit - Moved in 1990 to 1994 (%) - Hispanic or Latino
Year householder moved into unit - Moved in 1990 to 1994 (%) - American Indian and Alaska Native
Year householder moved into unit - Moved in 1990 to 1994 (%) - Multirace
Year householder moved into unit - Moved in 1990 to 1994 (%) - Other Race
Year householder moved into unit - Moved in 1980 to 1989 (%)
Year householder moved into unit - Moved in 1980 to 1989 (%) - White
Year householder moved into unit - Moved in 1980 to 1989 (%) - Black or African American
Year householder moved into unit - Moved in 1980 to 1989 (%) - Asian
Year householder moved into unit - Moved in 1980 to 1989 (%) - Hispanic or Latino
Year householder moved into unit - Moved in 1980 to 1989 (%) - American Indian and Alaska Native
Year householder moved into unit - Moved in 1980 to 1989 (%) - Multirace
Year householder moved into unit - Moved in 1980 to 1989 (%) - Other Race
Year householder moved into unit - Moved in 1970 to 1979 (%)
Year householder moved into unit - Moved in 1970 to 1979 (%) - White
Year householder moved into unit - Moved in 1970 to 1979 (%) - Black or African American
Year householder moved into unit - Moved in 1970 to 1979 (%) - Asian
Year householder moved into unit - Moved in 1970 to 1979 (%) - Hispanic or Latino
Year householder moved into unit - Moved in 1970 to 1979 (%) - American Indian and Alaska Native
Year householder moved into unit - Moved in 1970 to 1979 (%) - Multirace
Year householder moved into unit - Moved in 1970 to 1979 (%) - Other Race
Year householder moved into unit - Moved in 1969 or earlier (%)
Year householder moved into unit - Moved in 1969 or earlier (%) - White
Year householder moved into unit - Moved in 1969 or earlier (%) - Black or African American
Year householder moved into unit - Moved in 1969 or earlier (%) - Asian
Year householder moved into unit - Moved in 1969 or earlier (%) - Hispanic or Latino
Year householder moved into unit - Moved in 1969 or earlier (%) - American Indian and Alaska Native
Year householder moved into unit - Moved in 1969 or earlier (%) - Multirace
Year householder moved into unit - Moved in 1969 or earlier (%) - Other Race
Housing units lacking complete plumbing facilities (%)
Housing units lacking complete kitchen facilities (%)
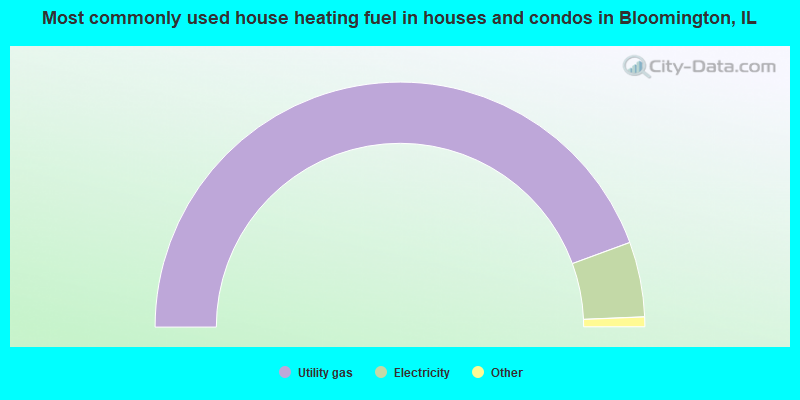
House heating fuel used in houses and condos - Utility gas (%)
House heating fuel used in houses and condos - Bottled, tank, or LP gas (%)
House heating fuel used in houses and condos - Electricity (%)
House heating fuel used in houses and condos - Fuel oil, kerosene, etc. (%)
House heating fuel used in houses and condos - Coal or coke (%)
House heating fuel used in houses and condos - Wood (%)
House heating fuel used in houses and condos - Solar energy (%)
House heating fuel used in houses and condos - Other fuel (%)
House heating fuel used in houses and condos - No fuel used (%)
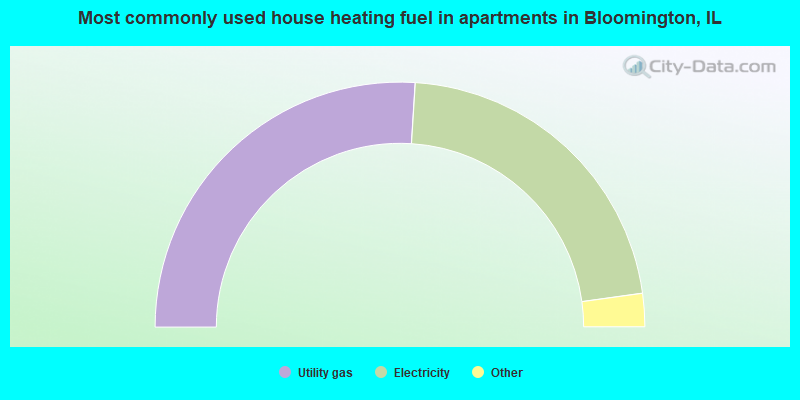
House heating fuel used in apartments - Utility gas (%)
House heating fuel used in apartments - Bottled, tank, or LP gas (%)
House heating fuel used in apartments - Electricity (%)
House heating fuel used in apartments - Fuel oil, kerosene, etc. (%)
House heating fuel used in apartments - Coal or coke (%)
House heating fuel used in apartments - Wood (%)
House heating fuel used in apartments - Solar energy (%)
House heating fuel used in apartments - Other fuel (%)
House heating fuel used in apartments - No fuel used (%)
Latest news about housing in Bloomington, IL collected exclusively by city-data.com from local newspapers, TV, and radio stations
Median year house/condo built: 1986Median year apartment built: 1973Household type by relationship:
Households: 78,874
Male householders: 17,763 (6,692 living alone ), Female householders: 17,536 (7,758 living alone )13,475 spouses (13,360 opposite-sex spouses ), 1,818 unmarried partners , (1,770 opposite-sex unmarried partners ), 20,774 children (19,134 natural , 1,341 adopted , 299 stepchildren ), 434 grandchildren , 1,539 brothers or sisters , 1,141 parents , 0 foster children , 100 other relatives , 2,480 non-relatives In group quarters: 1,814
Size of family households: 8,901 2-persons , 4,724 3-persons , 2,700 4-persons , 1,528 5-persons , 496 6-persons , 224 7-or-more-persons .
Size of nonfamily households: 14,450 1-person , 2,276 2-persons .
10,227 married couples with children. single-parent households (1,137 men , 3,695 women ).
87.0% of residents of Bloomington speak English at home. of residents speak Spanish at home (63% speak English very well , 22% speak English well , 12% speak English not well , 3% don't speak English at all ).of residents speak other Indo-European language at home (77% speak English very well , 16% speak English well , 2% speak English not well , 5% don't speak English at all ).of residents speak Asian or Pacific Island language at home (67% speak English very well , 20% speak English well , 13% speak English not well ).of residents speak other language at home (76% speak English very well , 18% speak English well , 6% speak English not well ).
Foreign born population: 6,456 (8.2%)of them are naturalized citizens )
Median number of rooms in houses and condos:
Median number of rooms in apartments
Owner-occupied Renter-occupied
Rooms in owner-occupied houses in Bloomington, Illinois
0 1 room 0 2 rooms 534 3 rooms 1,576 4 rooms 3,731 5 rooms 2,886 6 rooms 2,579 7 rooms 2,862 8 rooms 7,260 9+ rooms
Rooms in renter-occupied apartments in Bloomington, Illinois
482 1 room 650 2 rooms 4,792 3 rooms 3,941 4 rooms 1,509 5 rooms 946 6 rooms 660 7 rooms 612 8 rooms 279 9+ rooms
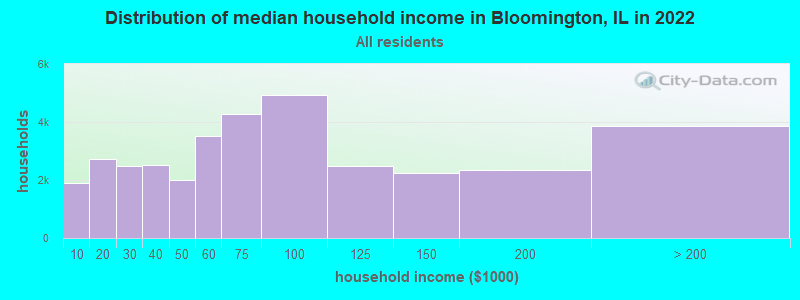
Bloomington, IL household income distribution 1,898 Less than $10,0002,731 $10,000 to $19,9992,490 $20,000 to $29,9992,512 $30,000 to $39,9991,990 $40,000 to $49,9993,525 $50,000 to $59,9994,276 $60,000 to $74,9994,941 $75,000 to $99,9992,497 $100,000 to $124,9992,225 $125,000 to $149,9992,356 $150,000 to $199,9993,858 $200,000 or more
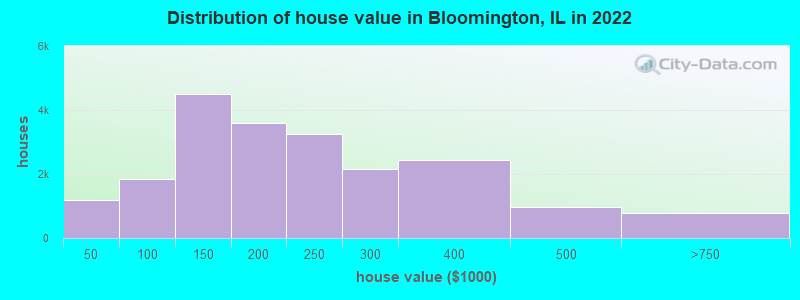
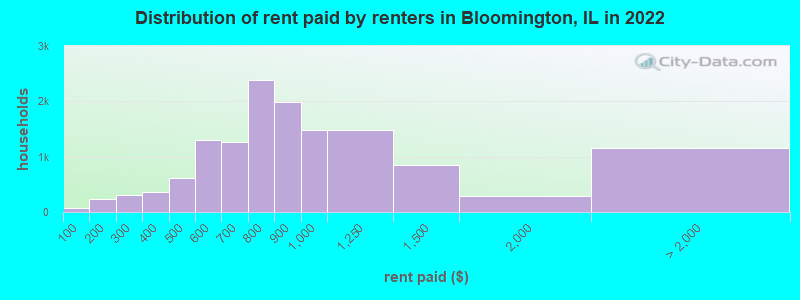
Home value of owner - occupied houses in 2022 in Bloomington, IL 307 Less than $10,000183 $10,000 to $14,999365 $15,000 to $19,99983 $20,000 to $24,99928 $25,000 to $29,99994 $30,000 to $34,99931 $35,000 to $39,99990 $40,000 to $49,999648 $50,000 to $59,999216 $60,000 to $69,999161 $70,000 to $79,999319 $80,000 to $89,999395 $90,000 to $99,9992,487 $100,000 to $124,9992,000 $125,000 to $149,9992,130 $150,000 to $174,9991,453 $175,000 to $199,9993,244 $200,000 to $249,9992,164 $250,000 to $299,9992,447 $300,000 to $399,999980 $400,000 to $499,999702 $500,000 to $749,99968 $750,000 to $999,9999 $2,000,000 or moreRent paid by renters in 2022 in Bloomington, IL 68 Less than $100136 $100 to $14994 $150 to $199227 $200 to $24988 $250 to $29971 $300 to $349284 $350 to $399343 $400 to $449279 $450 to $499660 $500 to $549636 $550 to $599834 $600 to $649437 $650 to $6991,064 $700 to $7491,321 $750 to $7991,993 $800 to $8991,482 $900 to $9991,478 $1,000 to $1,249851 $1,250 to $1,499289 $1,500 to $1,999169 $2,000 to $2,499119 $2,500 to $2,99984 $3,500 or more783 No cash rent
Percentage of workers working in this county: 90.4%Number of people working at home: 9,290 (23.0% of all workers )
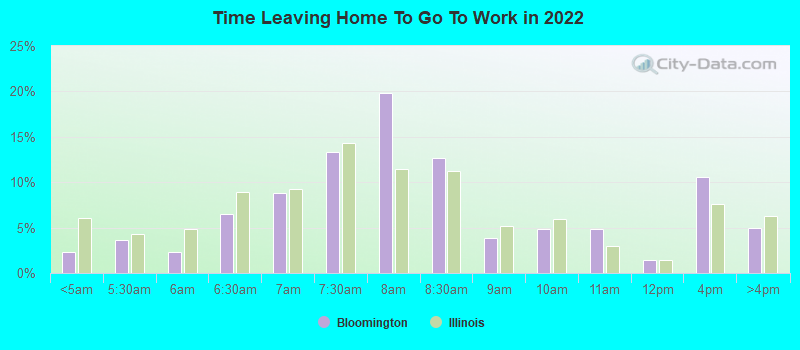
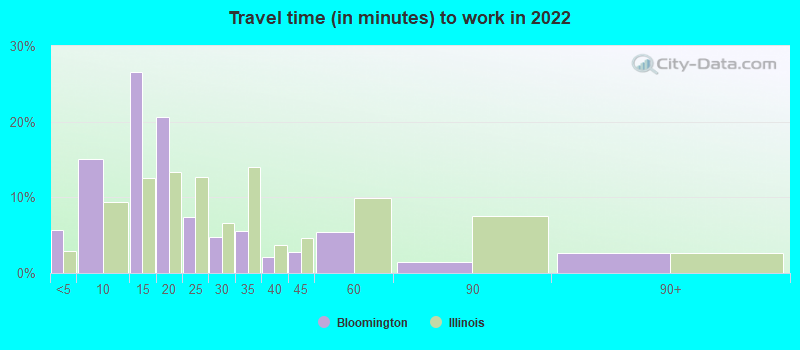
Travel time to work (commute)
Less than 5 minutes: 1,8015 to 9 minutes: 5,75810 to 14 minutes: 8,04115 to 19 minutes: 5,04320 to 24 minutes: 3,64925 to 29 minutes: 52230 to 34 minutes: 1,25335 to 39 minutes: 33540 to 44 minutes: 37545 to 59 minutes: 80860 to 89 minutes: 58490 or more minutes: 521
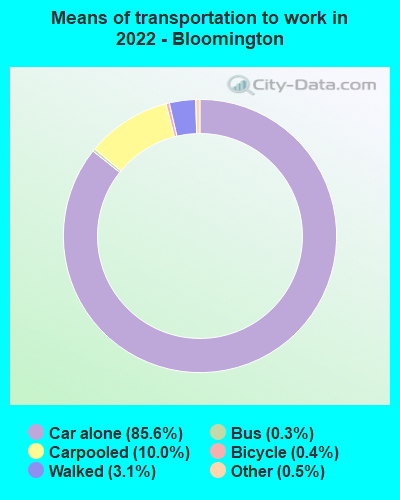
Means of transportation to work:
Drove a car alone: 35,673 (70.7%)Carpooled: 3,517 (7.0%)Bus : 135 (0.3%)Ferryboat: 12 (0.0%)Taxi: 132 (0.3%)Bicycle: 281 (0.6%)Walked: 1,224 (2.4%)Worked at home: 9,290 (18.4%)
Unemployment by race in 2022
Unemployment rate for White non-Hispanic residents 2.7% Males1.8% FemalesUnemployment rate for Black residents 10.4% Males4.5% FemalesUnemployment rate for Asian residents 3.1% Males4.7% FemalesUnemployment rate for other race residents 2.3% Males4.0% FemalesUnemployment rate for two or more race residents 8.1% Males0.8% FemalesUnemployment rate for Hispanic or Latino residents 1.6% Males4.4% Females
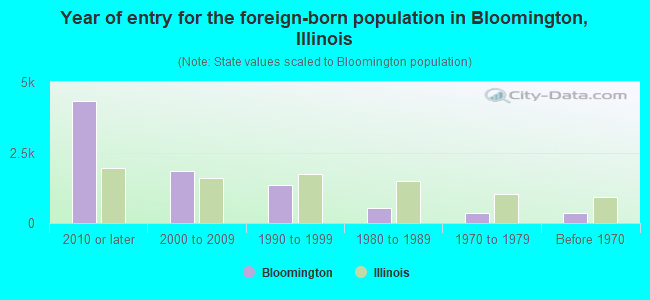
Year of entry for the foreign-born population in Bloomington, Illinois
4,322 2010 or later 1,842 2000 to 2009 1,339 1990 to 1999 517 1980 to 1989 347 1970 to 1979 348 Before 1970
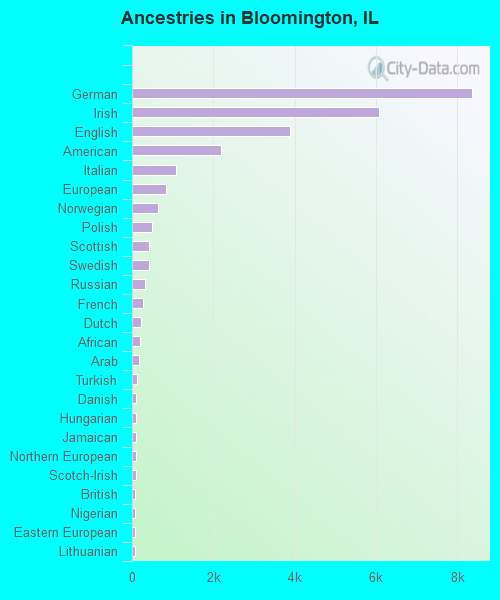
First ancestries reported:
German: 8,365 (19.6%)
Irish: 6,084 (14.3%)
English: 3,876 (9.1%)
American: 2,179 (5.1%)
Italian: 1,093 (2.6%)
European: 837 (2.0%)
Norwegian: 631 (1.5%)
Polish: 480 (1.1%)
Scottish: 419 (1.0%)
Swedish: 408 (1.0%)
Russian: 310 (0.7%)
French: 279 (0.7%)
Dutch: 217 (0.5%)
African: 206 (0.5%)
Arab: 169 (0.4%)
Turkish: 117 (0.3%)
Danish: 105 (0.2%)
Hungarian: 101 (0.2%)
Jamaican: 95 (0.2%)
Northern European: 91 (0.2%)
Scotch-Irish: 89 (0.2%)
British: 82 (0.2%)
Nigerian: 81 (0.2%)
Eastern European: 79 (0.2%)
Lithuanian: 77 (0.2%)
Greek: 76 (0.2%)
Belgian: 76 (0.2%)
Moroccan: 62 (0.1%)
Portuguese: 52 (0.1%)
Iranian: 49 (0.1%)
Canadian: 47 (0.1%)
French Canadian: 44 (0.1%)
Guyanese: 44 (0.1%)
Scandinavian: 43 (0.1%)
Welsh: 38 (0.09%)
Jordanian: 37 (0.09%)
Lebanese: 33 (0.08%)
Croatian: 32 (0.07%)
Serbian: 26 (0.06%)
Slovene: 25 (0.06%)
Egyptian: 23 (0.05%)
Australian: 22 (0.05%)
Latvian: 21 (0.05%)
Belizean: 20 (0.05%)
Czech: 20 (0.05%)
Yugoslavian: 17 (0.04%)
Austrian: 16 (0.04%)
Albanian: 13 (0.03%)
Ukrainian: 12 (0.03%)
Cape Verdean: 11 (0.03%)
Swiss: 10 (0.02%)
Senegalese: 7 (0.02%)
Romanian: 6 (0.01%)
Finnish: 6 (0.01%)
Haitian: 5 (0.01%)
Macedonian: 4 (0.01%)
Most common places of birth for foreign-born residents (%): India Bloomington:
45.8% (3,664)Illinois:
9.2% (166,409)
Mexico Bloomington:
13.2% (1,054)Illinois:
34.7% (626,958)
China, excluding Hong Kong and Taiwan Bloomington:
8.2% (658)Illinois:
4.1% (74,364)
Philippines Bloomington:
3.0% (236)Illinois:
5.2% (93,003)
Kuwait Bloomington:
2.3% (182)Illinois:
0.1% (1,630)
Guatemala Bloomington:
2.2% (177)Illinois:
1.3% (22,793)
Burma (Myanmar) Bloomington:
1.9% (152)Illinois:
0.3% (4,552)
Congo Bloomington:
1.6% (129)Illinois:
0.1% (1,142)
Korea Bloomington:
1.6% (127)Illinois:
2.2% (40,393)
Place of birth for U.S.-born residents:
This state: 56,189Other state: 15,198Northeast: 1,657Midwest: 8,038South: 3,497West: 2,006 86.5% of Bloomington residents lived in the same house 1 years ago.
Out of people who lived in different houses, 34.4% lived in this county.
Out of people who lived in different counties, 66.5% lived in Illinois.
Bloomington:
86.5%State average:
88.3%
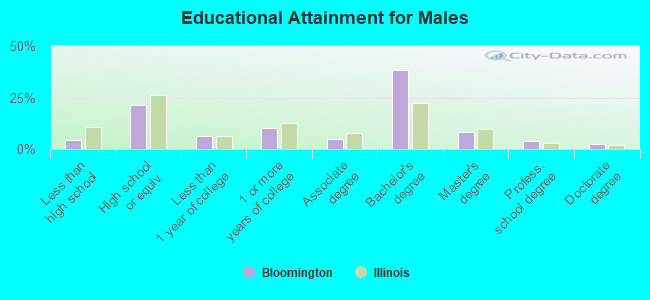
Education attainment for males 25 years and older:
No schooling: 549Nursery to 4th grade: 05th and 6th grade: 07th and 8th grade: 09th grade: 11110th grade: 16311th grade: 23512th grade, no diploma: 148High school graduate (or equivalency): 5,865Less than 1 year of college: 1,740Some college more than 1 year, no degree: 2,808Associate degree: 1,359Bachelor's degree: 10,576Master's degree: 2,214Professional school degree: 1,035Doctorate degree: 672
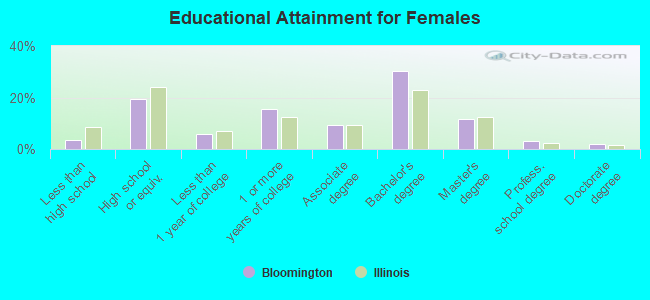
Education attainment for females 25 years and older:
No schooling: 356Nursery to 4th grade: 05th and 6th grade: 1597th and 8th grade: 09th grade: 7110th grade: 16911th grade: 15812th grade, no diploma: 0High school graduate (or equivalency): 5,171Less than 1 year of college: 1,561Some college more than 1 year, no degree: 4,159Associate degree: 2,527Bachelor's degree: 8,099Master's degree: 3,107Professional school degree: 802Doctorate degree: 492
Housing units in structures:
One, detached: 21,375One, attached: 1,624Two: 1,4603 or 4: 2,8175 to 9: 2,50110 to 19: 4,42120 to 49: 1,70050 or more: 1,352Mobile homes: 974Median worth of mobile homes: $52,400
Housing units lacking complete plumbing facilities in 2022: 1.1%Housing units lacking complete kitchen facilities in 2022: 2.1%House/condo owner moved in on average 11 years ago
Renter moved in on average 2 years ago
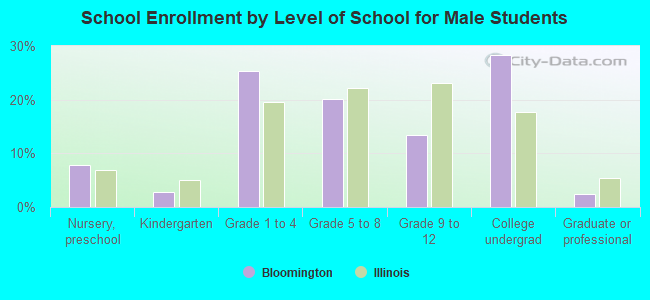
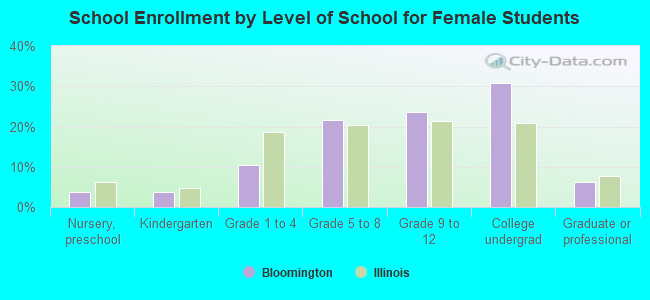
Private vs. public school enrollment:
Students in private schools in grades 1 to 8 (elementary and middle school): 1,142 Students in private schools in grades 9 to 12 (high school): 859 Students in private undergraduate colleges: 1,152