Bloomington, IN (Indiana) Houses and Residents
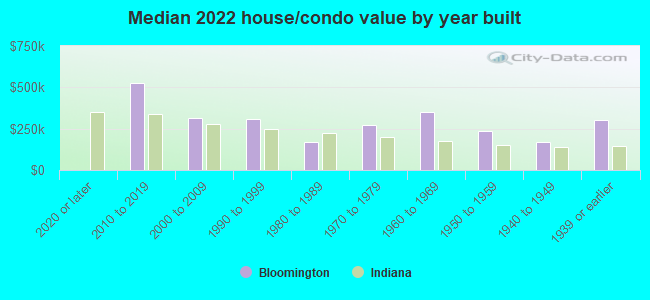
| Bloomington: | $289,000 |
| Indiana: | $208,700 |
Mean price in 2022:
Detached houses: $356,268
Here: $356,268 State: $257,916 Townhouses or other attached units: $215,970
Here: $215,970 State: $224,114 In 2-unit structures: $202,561
Here: $202,561 State: $175,375 In 3-to-4-unit structures: $174,667
Here: $174,667 State: $151,116 In 5-or-more-unit structures: $83,529
Here: $83,529 State: $200,844 Mobile homes: $21,886
Here: $21,886 State: $67,116
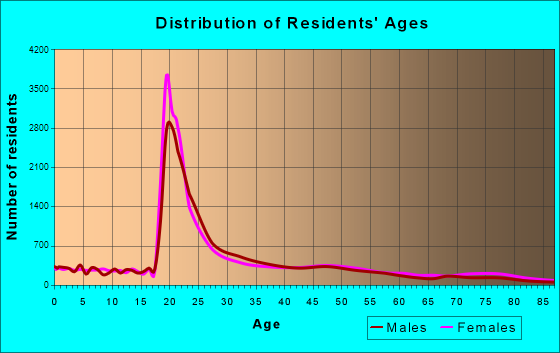
Total population: 83,322 (Urban population: 68,987, Rural population: 242 (all nonfarm))
Houses: 38,784 (34,880 occupied: 11,393 owner occupied, 23,487 renter occupied)
| % of renters here: | 67% |
| State: | 29% |
Housing density: 1,965 houses/condos per square mile
Median price asked for vacant for-sale houses and condos in 2022: $239,790.
Median contract rent in 2022: $904 (lower quartile is $736, upper quartile is $1,277)
Median rent asked for vacant for-rent units in 2022: $2,080
Median gross rent in Bloomington, IN in 2022: $1,106
Housing units in Bloomington with a mortgage: 7,096 (889 second mortgage, 82 home equity loan, 745 both second mortgage and home equity loan)
Houses without a mortgage: 157
Median household income for houses/condos with a mortgage: $114,573
Median household income for apartments without a mortgage: $118,661
Median monthly housing costs: $1,104
Compare current foreclosures in Bloomington, IN:
| Photo | Address | Area | Beds / Baths | Price | Details |
|---|---|---|---|---|---|

|
#1
S Walter Ave
Bloomington, IN 47403
|
1,800 sq. feet
|
2 baths 4 beds |
show details | |

|
#2
E Farr Rd
Bloomington, IN 47408
|
1,333 sq. feet
|
2 baths 3 beds |
show details | |

|
#3
E Robinson Rd
Bloomington, IN 47408
|
960 sq. feet
|
2 baths 3 beds |
show details | |

|
#4
S Cave Creek Dr
Bloomington, IN 47403
|
3,176 sq. feet
|
3 baths 4 beds |
show details | |

|
#5
S Roxbury Cir
Bloomington, IN 47401
|
2,580 sq. feet
|
1 baths 3 beds |
show details | |

|
#6
N Thomas Rd
Bloomington, IN 47404
|
1,272 sq. feet
|
1 baths 3 beds |
show details | |

|
#7
S Harmony Rd
Bloomington, IN 47403
|
960 sq. feet
|
1 baths 3 beds |
show details | |

|
#8
N Andy Way
Bloomington, IN 47404
|
2,044 sq. feet
|
2 baths 3 beds |
show details | |

|
#9
S Yonkers St
Bloomington, IN 47403
|
1,120 sq. feet
|
1 baths 3 beds |
show details | |

|
#10
W Lawson Rd
Bloomington, IN 47404
|
868 sq. feet
|
1 baths 2 beds |
show details |
| Photo | Address | Area | Beds / Baths | Price | Details |
|---|---|---|---|---|---|

|
#11
S Bushmill Dr
Bloomington, IN 47403
|
1,124 sq. feet
|
2 baths 3 beds |
show details | |

|
#12
S Wickens St
Bloomington, IN 47403
|
1,796 sq. feet
|
2 baths 3 beds |
show details | |

|
#13
S Anne Ct
Bloomington, IN 47403
|
1,104 sq. feet
|
1 baths 3 beds |
show details | |

|
#14
W Reeves Rd
Bloomington, IN 47404
|
1,208 sq. feet
|
1 baths 3 beds |
show details | |

|
#15
W Johanna Dr
Bloomington, IN 47404
|
1,348 sq. feet
|
2 baths 3 beds |
show details | |

|
#16
S Deer Trce
Bloomington, IN 47401
|
1,844 sq. feet
|
2 baths 3 beds |
show details | |

|
#17
S Rockport Rd
Bloomington, IN 47403
|
1,056 sq. feet
|
1 baths 3 beds |
show details | |

|
#18
N Hartstrait Rd
Bloomington, IN 47404
|
1,272 sq. feet
|
2 baths 3 beds |
show details | |

|
#19
W Graves Rd
Bloomington, IN 47403
|
1,392 sq. feet
|
1 baths 2 beds |
show details | |

|
#20
N Rosewood Ct
Bloomington, IN 47404
|
2,357 sq. feet
|
2 baths 4 beds |
show details |
| Photo | Address | Area | Beds / Baths | Price | Details |
|---|---|---|---|---|---|

|
#21
W Evergreen Dr
Bloomington, IN 47404
|
1,460 sq. feet
|
1 baths 2 beds |
show details | |

|
#22
N Logan Rd # A
Bloomington, IN 47404
|
1,190 sq. feet
|
2 baths 5 beds |
show details | |

|
#23
W Harvest Ln
Bloomington, IN 47404
|
4,648 sq. feet
|
3 baths 3 beds |
show details | |

|
#24
S Harmony Rd
Bloomington, IN 47403
|
1,196 sq. feet
|
1 baths 3 beds |
show details | |

|
#25
N Mount Gilead Rd
Bloomington, IN 47408
|
936 sq. feet
|
2 baths 4 beds |
show details | |

|
#26
W Ratliff Rd
Bloomington, IN 47404
|
976 sq. feet
|
1 baths 3 beds |
show details | |

|
#27
S Burch Rd # B
Bloomington, IN 47403
|
1,812 sq. feet
|
2 baths 3 beds |
show details | |

|
#28
S Isabel Ct
Bloomington, IN 47403
|
1,572 sq. feet
|
2 baths 3 beds |
show details | |

|
#29
S Hickory Dr
Bloomington, IN 47403
|
1,375 sq. feet
|
1 baths 3 beds |
show details | |

|
#30
E State Road 46
Bloomington, IN 47401
|
1,177 sq. feet
|
1 baths 3 beds |
show details |
| Photo | Address | Area | Beds / Baths | Price | Details |
|---|---|---|---|---|---|

|
#31
E Boltinghouse Rd
Bloomington, IN 47408
|
1,074 sq. feet
|
1 baths 2 beds |
show details | |

|
#32
W State Road 45
Bloomington, IN 47403
|
1,752 sq. feet
|
1 baths 4 beds |
show details | |

|
#33
E Rhorer Rd
Bloomington, IN 47401
|
1,368 sq. feet
|
2 baths 2 beds |
show details | |

|
#34
S Harmony Rd
Bloomington, IN 47403
|
960 sq. feet
|
1 baths 3 beds |
show details | |

|
#35
W Nestle Down Dr
Bloomington, IN 47404
|
1,520 sq. feet
|
2 baths 3 beds |
show details | |

|
#36
N Overhill Dr
Bloomington, IN 47408
|
1,056 sq. feet
|
1 baths 3 beds |
show details | |

|
#37
S Commons Dr
Bloomington, IN 47401
|
1,200 sq. feet
|
1 baths 2 beds |
show details | |

|
#38
S Morning Glory Ct
Bloomington, IN 47401
|
2,380 sq. feet
|
2 baths 3 beds |
show details | |

|
#39
S Fieldstone Blvd
Bloomington, IN 47403
|
1,291 sq. feet
|
2 baths 3 beds |
show details | |

|
#40
N Triple Crown Dr
Bloomington, IN 47404
|
- sq. feet
|
2 baths 3 beds |
show details |
| Photo | Address | Area | Beds / Baths | Price | Details |
|---|---|---|---|---|---|

|
#41
S Cuffers Dr
Bloomington, IN 47403
|
- sq. feet
|
- baths - beds |
show details | |

|
#42
N Forbes Dr
Bloomington, IN 47408
|
- sq. feet
|
- baths - beds |
show details | |

|
#43
N Lenzy Way, Unit 312
Bloomington, IN 47404
|
- sq. feet
|
- baths - beds |
show details | |

|
#44
S College Dr
Bloomington, IN 47403
|
- sq. feet
|
- baths - beds |
show details | |

|
#45
W Kirkwood Ave
Bloomington, IN 47404
|
- sq. feet
|
- baths - beds |
show details | |

|
#46
W Leonard Springs Rd
Bloomington, IN 47403
|
- sq. feet
|
- baths - beds |
show details | |

|
#47
S Fairfax Rd Apt 1
Bloomington, IN 47401
|
- sq. feet
|
- baths - beds |
show details | |

|
#48
S Cory Ln Lot 16
Bloomington, IN 47403
|
- sq. feet
|
- baths - beds |
show details | |

|
#49
N Arlington Park Dr Apt 307
Bloomington, IN 47404
|
- sq. feet
|
- baths - beds |
show details | |

|
Check over 1 million property listings on Foreclosure.com!
|
browse all offers | |||

Latest news about housing in Bloomington, IN collected exclusively by city-data.com from local newspapers, TV, and radio stations


Median year apartment built: 1983
Household type by relationship:
Households: 77,358- Male householders: 18,768 (6,864 living alone), Female householders: 16,112 (8,604 living alone)
8,400 spouses (8,254 opposite-sex spouses), 2,758 unmarried partners, (2,448 opposite-sex unmarried partners), 9,015 children (8,392 natural, 471 adopted, 152 stepchildren), 160 grandchildren, 574 brothers or sisters, 384 parents, 0 foster children, 62 other relatives, 8,472 non-relatives
- In group quarters: 12,653
Size of family households: 6,063 2-persons, 2,330 3-persons, 858 4-persons, 648 5-persons, 593 6-persons, 313 7-or-more-persons.
Size of nonfamily households: 15,468 1-person, 5,775 2-persons, 1,273 3-persons, 926 4-persons, 554 5-persons, 79 7-or-more-persons.
4,758 married couples with children.
3,379 single-parent households (515 men, 2,864 women).
84.4% of residents of Bloomington speak English at home.
2.7% of residents speak Spanish at home (68% speak English very well, 16% speak English well, 15% speak English not well).
5.4% of residents speak other Indo-European language at home (87% speak English very well, 9% speak English well, 3% speak English not well).
5.8% of residents speak Asian or Pacific Island language at home (58% speak English very well, 37% speak English well, 3% speak English not well, 2% don't speak English at all).
1.5% of residents speak other language at home (79% speak English very well, 10% speak English well, 11% speak English not well).
Foreign born population: 7,984 (10.3%)
(44.3% of them are naturalized citizens)
| Here: | 6.3 |
| State: | 6.6 |
| Here: | 3.8 |
| State: | 4.3 |
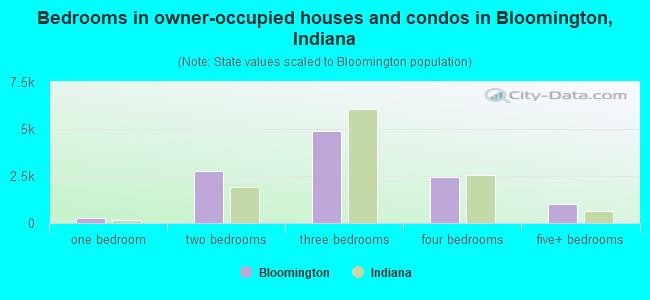
- Bedrooms in owner-occupied houses and condos in Bloomington, Indiana
- 0no bedroom
- 2551 bedroom
- 2,7662 bedrooms
- 4,9193 bedrooms
- 2,4264 bedrooms
- 1,0275+ bedrooms
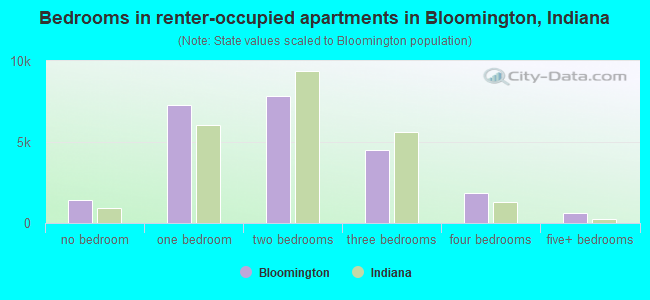
- Bedrooms in renter-occupied apartments in Bloomington, Indiana
- 1,415no bedroom
- 7,2691 bedroom
- 7,8562 bedrooms
- 4,4923 bedrooms
- 1,8274 bedrooms
- 6285+ bedrooms
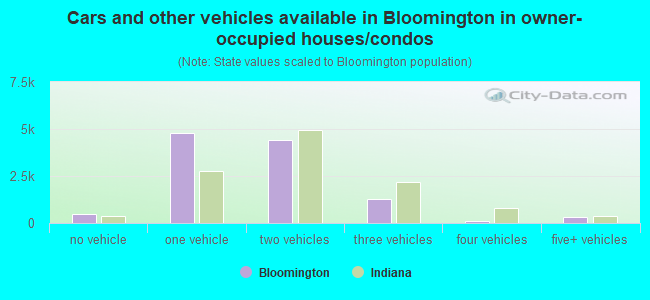
- Cars and other vehicles available in Bloomington in owner-occupied houses/condos
- 483no vehicle
- 4,7941 vehicle
- 4,4312 vehicles
- 1,2863 vehicles
- 814 vehicles
- 3185+ vehicles
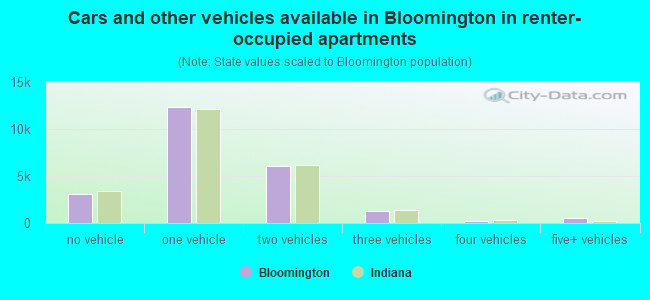
- Cars and other vehicles available in Bloomington in renter-occupied apartments
- 3,038no vehicle
- 12,2891 vehicle
- 6,0992 vehicles
- 1,3043 vehicles
- 2054 vehicles
- 5525+ vehicles
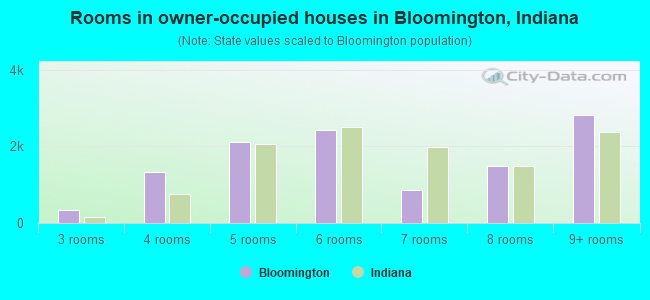
- Rooms in owner-occupied houses in Bloomington, Indiana
- 01 room
- 02 rooms
- 3463 rooms
- 1,3324 rooms
- 2,1175 rooms
- 2,4286 rooms
- 8527 rooms
- 1,5008 rooms
- 2,8189+ rooms
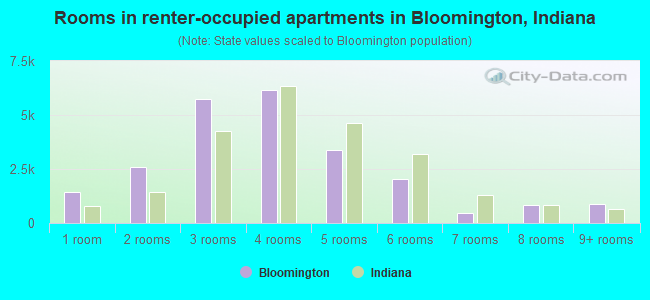
- Rooms in renter-occupied apartments in Bloomington, Indiana
- 1,4151 room
- 2,5762 rooms
- 5,7493 rooms
- 6,1714 rooms
- 3,3795 rooms
- 2,0146 rooms
- 4717 rooms
- 8208 rooms
- 8929+ rooms
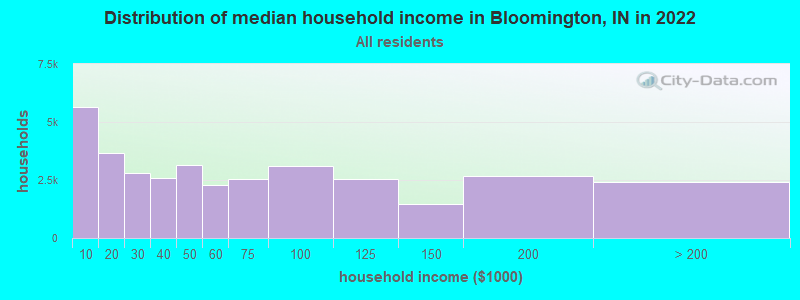
Bloomington, IN household income distribution

- 5,642Less than $10,000
- 3,683$10,000 to $19,999
- 2,782$20,000 to $29,999
- 2,585$30,000 to $39,999
- 3,156$40,000 to $49,999
- 2,294$50,000 to $59,999
- 2,535$60,000 to $74,999
- 3,122$75,000 to $99,999
- 2,539$100,000 to $124,999
- 1,448$125,000 to $149,999
- 2,679$150,000 to $199,999
- 2,415$200,000 or more
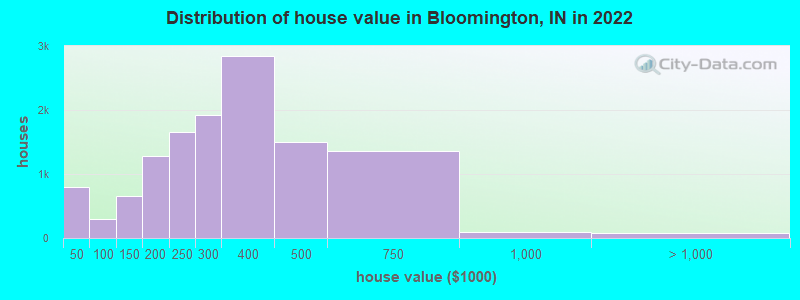
Home value of owner - occupied houses in 2022 in Bloomington, IN
-
- 101Less than $10,000
- 57$10,000 to $14,999
- 53$15,000 to $19,999
- 400$20,000 to $24,999
- 37$25,000 to $29,999
- 115$35,000 to $39,999
- 34$40,000 to $49,999
- 32$50,000 to $59,999
- 41$70,000 to $79,999
- 31$80,000 to $89,999
- 163$90,000 to $99,999
- 275$100,000 to $124,999
- 376$125,000 to $149,999
- 672$150,000 to $174,999
- 615$175,000 to $199,999
- 1,658$200,000 to $249,999
- 1,922$250,000 to $299,999
- 2,839$300,000 to $399,999
- 1,500$400,000 to $499,999
- 1,359$500,000 to $749,999
- 100$750,000 to $999,999
- 58$1,000,000 to $1,499,999
- 25$2,000,000 or more
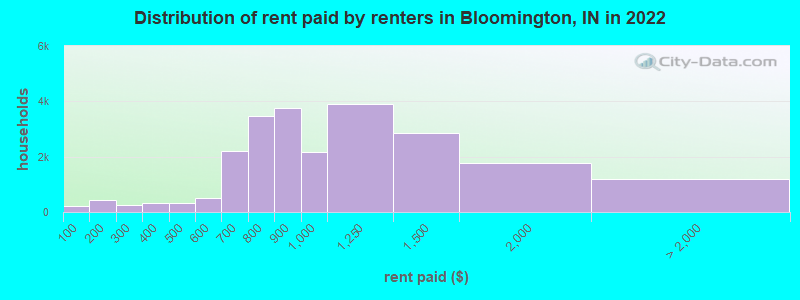
Rent paid by renters in 2022 in Bloomington, IN
-
- 229Less than $100
- 150$100 to $149
- 283$150 to $199
- 132$200 to $249
- 121$250 to $299
- 112$300 to $349
- 206$350 to $399
- 215$400 to $449
- 104$450 to $499
- 257$500 to $549
- 253$550 to $599
- 845$600 to $649
- 1,359$650 to $699
- 1,874$700 to $749
- 1,607$750 to $799
- 3,749$800 to $899
- 2,182$900 to $999
- 3,894$1,000 to $1,249
- 2,849$1,250 to $1,499
- 1,760$1,500 to $1,999
- 267$2,000 to $2,499
- 234$2,500 to $2,999
- 123$3,000 to $3,499
- 213$3,500 or more
- 337No cash rent
Percentage of workers working in this county: 86.0%
Number of people working at home: 6,767 (17.0% of all workers)
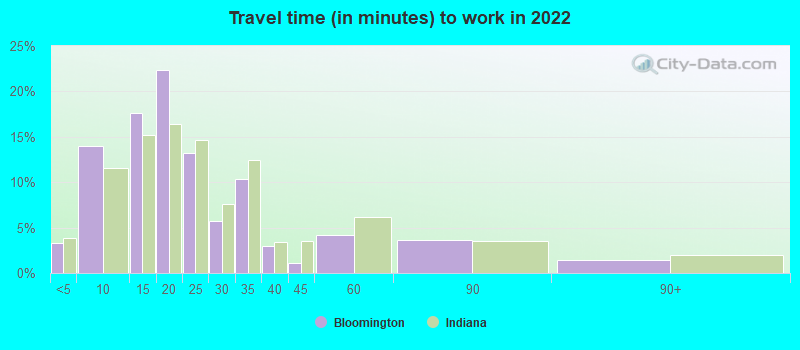
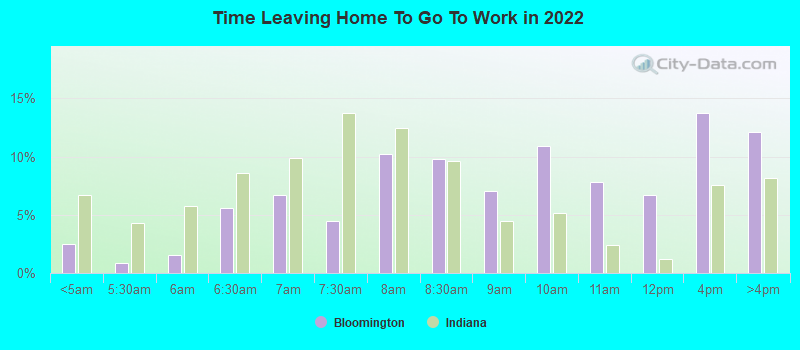
Travel time to work (commute)
- Less than 5 minutes: 1,617
- 5 to 9 minutes: 6,095
- 10 to 14 minutes: 8,088
- 15 to 19 minutes: 7,665
- 20 to 24 minutes: 3,268
- 25 to 29 minutes: 1,596
- 30 to 34 minutes: 2,636
- 35 to 39 minutes: 930
- 40 to 44 minutes: 911
- 45 to 59 minutes: 862
- 60 to 89 minutes: 900
- 90 or more minutes: 562
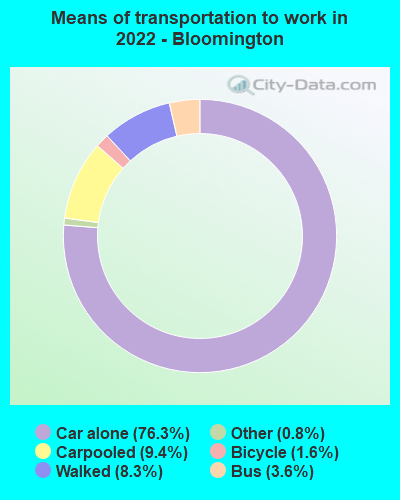
Means of transportation to work:
- Drove a car alone: 40,880 (68.5%)
- Carpooled: 5,019 (8.4%)
- Bus: 1,917 (3.2%)
- Taxi: 425 (0.7%)
- Bicycle: 872 (1.5%)
- Walked: 4,430 (7.4%)
- Worked at home: 6,096 (10.2%)
- Unemployment by race in 2022
- Unemployment rate for White non-Hispanic residents
- 9.1%Males
- 4.2%Females
- Unemployment rate for Black residents
- 0.9%Males
- 12.7%Females
- Unemployment rate for American Indian and Alaska Native residents
- 18.7%Females
- Unemployment rate for Asian residents
- 18.0%Males
- 10.5%Females
- Unemployment rate for other race residents
- 0.8%Males
- 11.2%Females
- Unemployment rate for two or more race residents
- 4.3%Males
- 9.1%Females
- Unemployment rate for Hispanic or Latino residents
- 2.7%Males
- 5.5%Females
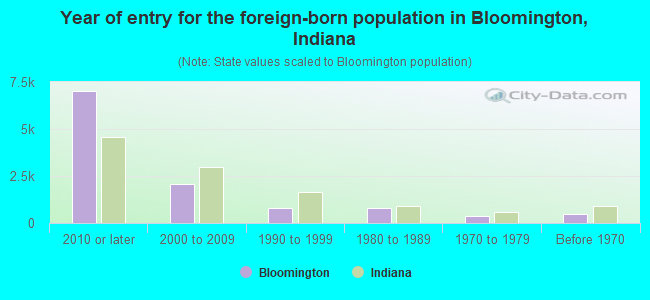
- Year of entry for the foreign-born population in Bloomington, Indiana
- 7,0152010 or later
- 2,0912000 to 2009
- 8141990 to 1999
- 8211980 to 1989
- 3691970 to 1979
- 490Before 1970
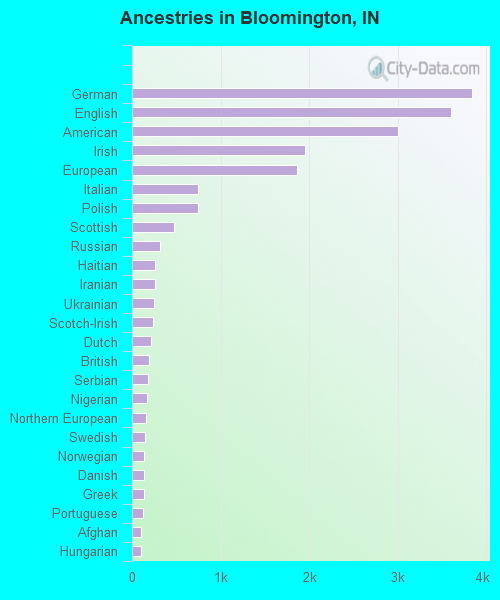
First ancestries reported:
- German: 3,841 (11.9%)
- English: 3,605 (11.2%)
- American: 3,001 (9.3%)
- Irish: 1,959 (6.1%)
- European: 1,865 (5.8%)
- Italian: 747 (2.3%)
- Polish: 740 (2.3%)
- Scottish: 472 (1.5%)
- Russian: 320 (1.0%)
- Haitian: 260 (0.8%)
- Iranian: 255 (0.8%)
- Ukrainian: 253 (0.8%)
- Scotch-Irish: 233 (0.7%)
- Dutch: 218 (0.7%)
- British: 194 (0.6%)
- Serbian: 185 (0.6%)
- Nigerian: 169 (0.5%)
- Northern European: 153 (0.5%)
- Swedish: 145 (0.5%)
- Norwegian: 141 (0.4%)
- Danish: 136 (0.4%)
- Greek: 130 (0.4%)
- Portuguese: 128 (0.4%)
- Afghan: 103 (0.3%)
- Hungarian: 100 (0.3%)
- French: 88 (0.3%)
- Ghanaian: 81 (0.3%)
- Croatian: 70 (0.2%)
- Eastern European: 67 (0.2%)
- Welsh: 67 (0.2%)
- Finnish: 62 (0.2%)
- Romanian: 55 (0.2%)
- Arab: 54 (0.2%)
- Kenyan: 46 (0.1%)
- Ethiopian: 45 (0.1%)
- Turkish: 44 (0.1%)
- Lithuanian: 41 (0.1%)
- Belgian: 39 (0.1%)
- Canadian: 36 (0.1%)
- Slovak: 35 (0.1%)
- Icelander: 35 (0.1%)
- African: 32 (0.10%)
- Brazilian: 30 (0.09%)
- Latvian: 27 (0.08%)
- Slavic: 26 (0.08%)
- Yugoslavian: 25 (0.08%)
- French Canadian: 23 (0.07%)
- Lebanese: 19 (0.06%)
- Scandinavian: 19 (0.06%)
- Slovene: 15 (0.05%)
- Austrian: 15 (0.05%)
- Egyptian: 14 (0.04%)
- Estonian: 13 (0.04%)
- Swiss: 13 (0.04%)
- Israeli: 11 (0.03%)
- Czech: 8 (0.02%)
- Bulgarian: 8 (0.02%)
- Basque: 7 (0.02%)
- Jamaican: 6 (0.02%)
- New Zealander: 4 (0.01%)
- Assyrian: 4 (0.01%)
Most common places of birth for foreign-born residents (%):
| Bloomington: | 17.7% (1,843) |
| Indiana: | 5.3% (19,877) |
| Bloomington: | 14.9% (1,549) |
| Indiana: | 8.5% (32,127) |
| Bloomington: | 5.8% (602) |
| Indiana: | 2.0% (7,653) |
| Bloomington: | 4.3% (451) |
| Indiana: | 0.6% (2,272) |
| Bloomington: | 3.4% (354) |
| Indiana: | 27.0% (101,996) |
| Bloomington: | 3.4% (350) |
| Indiana: | 1.7% (6,439) |
| Bloomington: | 2.5% (264) |
| Indiana: | 3.1% (11,851) |
| Bloomington: | 1.9% (194) |
| Indiana: | 0.2% (705) |
| Bloomington: | 1.8% (184) |
| Indiana: | 0.4% (1,388) |
| Bloomington: | 1.7% (175) |
| Indiana: | 0.9% (3,307) |
| Bloomington: | 1.6% (171) |
| Indiana: | 1.2% (4,520) |
| Bloomington: | 1.6% (163) |
| Indiana: | 2.1% (7,834) |
| Bloomington: | 1.6% (163) |
| Indiana: | 0.2% (770) |
Place of birth for U.S.-born residents:
- This state: 36,898
- Other state: 31,579
- Northeast: 6,491
- Midwest: 13,820
- South: 6,579
- West: 4,689
66.0% of Bloomington residents lived in the same house 1 years ago.
Out of people who lived in different houses, 32.3% lived in this county.
Out of people who lived in different counties, 55.7% lived in Indiana.
| Bloomington: | 66.0% |
| State average: | 87.1% |
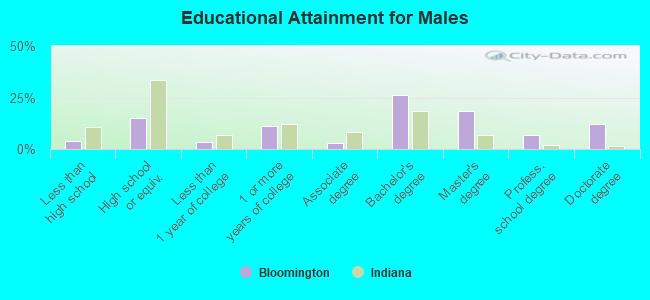
Education attainment for males 25 years and older:
- No schooling: 0
- Nursery to 4th grade: 0
- 5th and 6th grade: 0
- 7th and 8th grade: 43
- 9th grade: 0
- 10th grade: 116
- 11th grade: 376
- 12th grade, no diploma: 185
- High school graduate (or equivalency): 2,682
- Less than 1 year of college: 594
- Some college more than 1 year, no degree: 2,022
- Associate degree: 519
- Bachelor's degree: 4,670
- Master's degree: 3,349
- Professional school degree: 1,241
- Doctorate degree: 2,176
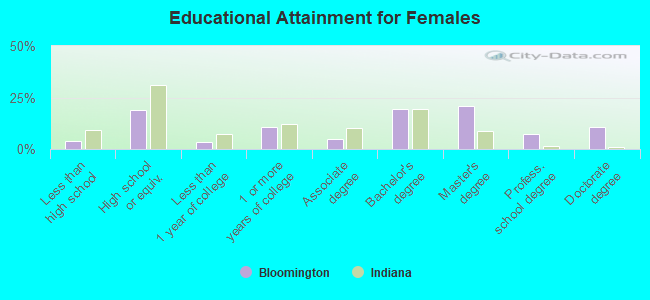
Education attainment for females 25 years and older:
- No schooling: 32
- Nursery to 4th grade: 0
- 5th and 6th grade: 0
- 7th and 8th grade: 117
- 9th grade: 44
- 10th grade: 370
- 11th grade: 85
- 12th grade, no diploma: 90
- High school graduate (or equivalency): 3,545
- Less than 1 year of college: 657
- Some college more than 1 year, no degree: 2,020
- Associate degree: 934
- Bachelor's degree: 3,638
- Master's degree: 3,904
- Professional school degree: 1,340
- Doctorate degree: 1,959
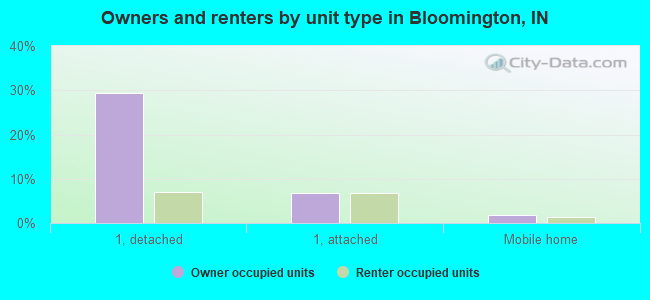
Housing units in structures:
- One, detached: 14,009
- One, attached: 4,284
- Two: 834
- 3 or 4: 3,116
- 5 to 9: 6,491
- 10 to 19: 3,943
- 20 to 49: 2,479
- 50 or more: 3,194
- Mobile homes: 434
Median worth of mobile homes: $18,100
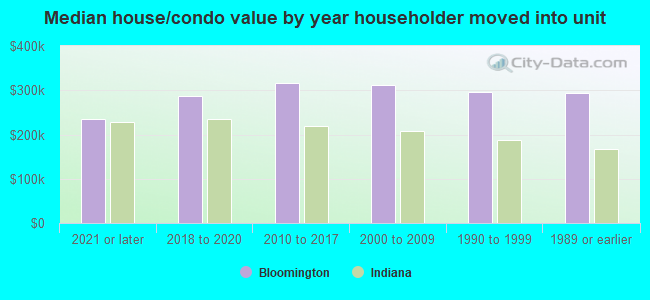
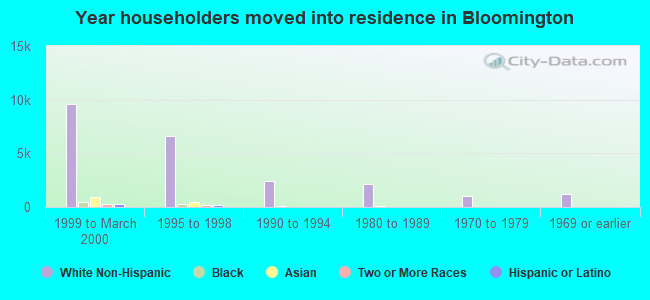
House/condo owner moved in on average 10 years ago
Renter moved in on average 1 years ago
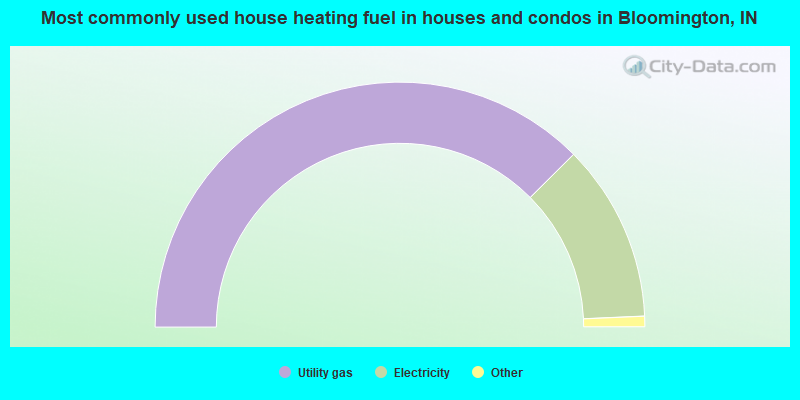
- 75.1%Utility gas
- 23.5%Electricity
- 0.7%Bottled, tank, or LP gas
- 0.4%Solar energy
- 0.2%Fuel oil, kerosene, etc.
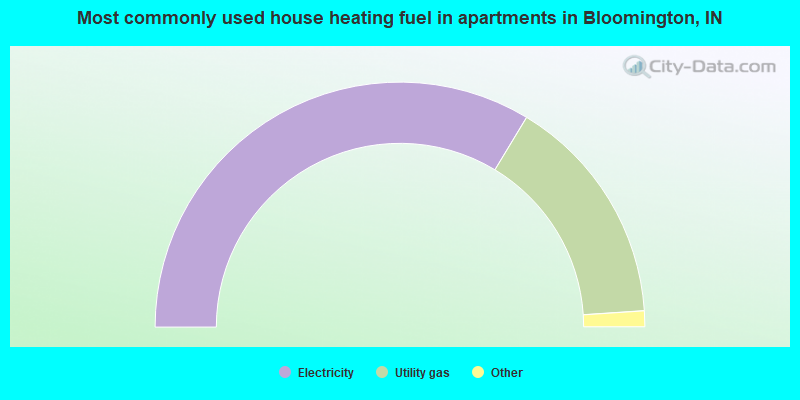
- 67.3%Electricity
- 30.6%Utility gas
- 1.4%Bottled, tank, or LP gas
- 0.5%No fuel used
- 0.1%Solar energy
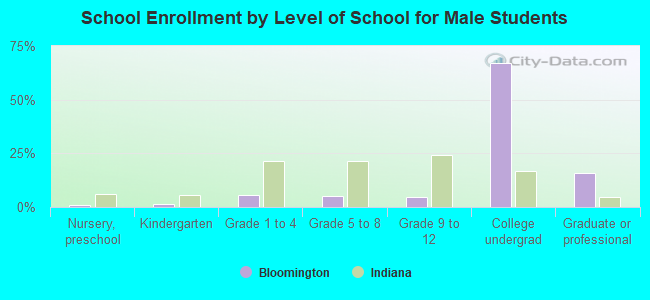
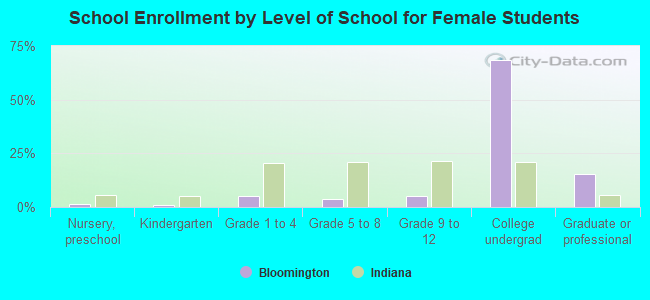
Private vs. public school enrollment:
| Here: | 9.3% |
| Indiana: | 14.9% |
| Here: | 5.3% |
| Indiana: | 11.4% |
| Here: | 1.6% |
| Indiana: | 22.3% |