Blountville, TN (Tennessee) Houses and Residents
| Blountville: | $199,889 |
| Tennessee: | $284,800 |
Mean price in 2022:
Detached houses: $323,134
Here: $323,134 State: $374,382 Townhouses or other attached units: $154,516
Here: $154,516 State: $354,101 Mobile homes: $71,591
Here: $71,591 State: $101,421
Total population: 3,074 (Urban population: 2,311, Rural population: 708 (all nonfarm))
Houses: 1,188 (1,080 occupied: 913 owner occupied, 192 renter occupied)
| % of renters here: | 17% |
| State: | 33% |
Housing density: 208 houses/condos per square mile
Median price asked for vacant for-sale houses and condos in 2022 in this county: $155,669.
Median contract rent in 2022: $826 (lower quartile is $536, upper quartile is $873)
Median rent asked for vacant for-rent units in 2022: $1,107
Median gross rent in Blountville, TN in 2022: $969
Housing units in Blountville with a mortgage: 428 (50 second mortgage, 31 home equity loan, 23 both second mortgage and home equity loan)
Houses without a mortgage: 13
Median household income for houses/condos with a mortgage: $79,654
Median household income for apartments without a mortgage: $43,321
Median monthly housing costs: $700
Compare current foreclosures near Blountville, TN:
| Photo | Address | Area | Beds / Baths | Price | Details |
|---|---|---|---|---|---|

|
#1
Morelock Dr
Blountville, TN 37617
|
1,440 sq. feet
|
3 baths - beds |
show details | |

|
#2
Royal Oak Dr
Blountville, TN 37617
|
1,908 sq. feet
|
2 baths - beds |
show details | |

|
#3
Harr Trail Rd
Blountville, TN 37617
|
1,344 sq. feet
|
1 baths - beds |
show details | |

|
#4
Barger Hollow Rd
Blountville, TN 37617
|
1,092 sq. feet
|
1 baths - beds |
show details | |

|
#5
Muddy Creek Rd
Blountville, TN 37617
|
3,480 sq. feet
|
2 baths - beds |
show details | |

|
#6
Milden Hall Rd
Blountville, TN 37617
|
1,776 sq. feet
|
1 baths - beds |
show details | |

|
#7
Central Heights Rd
Blountville, TN 37617
|
2,085 sq. feet
|
1 baths - beds |
show details | |

|
#8
Birch St
Blountville, TN 37617
|
1,144 sq. feet
|
1 baths - beds |
show details | |

|
#9
Highway 11 W
Blountville, TN 37617
|
1,848 sq. feet
|
1 baths - beds |
show details | |

|
#10
Big Hollow Rd
Blountville, TN 37617
|
2,240 sq. feet
|
2 baths - beds |
show details |
| Photo | Address | Area | Beds / Baths | Price | Details |
|---|---|---|---|---|---|

|
#11
Emory Harr Private Dr
Blountville, TN 37617
|
1,680 sq. feet
|
1 baths - beds |
show details | |

|
#12
Highland Meadows Dr
Blountville, TN 37617
|
1,620 sq. feet
|
- baths - beds |
show details | |

|
#13
Highway 11 W
Blountville, TN 37617
|
- sq. feet
|
- baths - beds |
show details | |

|
#14
Shipley Ferry Rd # 4
Blountville, TN 37617
|
- sq. feet
|
- baths - beds |
show details | |

|
#15
Buena Vista Dr
Blountville, TN 37617
|
- sq. feet
|
- baths - beds |
show details | |

|
#16
Highway 394 Lot 13
Blountville, TN 37617
|
- sq. feet
|
- baths - beds |
show details | |

|
#17
Ethel Beard Rd
Blountville, TN 37617
|
1,620 sq. feet
|
- baths - beds |
show details | |

|
#18
Mcmurray Private Dr
Blountville, TN 37617
|
- sq. feet
|
- baths - beds |
show details | |

|
#19
Highway 394
Blountville, TN 37617
|
- sq. feet
|
- baths - beds |
show details | |

|
#20
Courtney Dr
Blountville, TN 37617
|
- sq. feet
|
- baths - beds |
show details |
| Photo | Address | Area | Beds / Baths | Price | Details |
|---|---|---|---|---|---|

|
#21
Muddy Creek Rd Lot 27
Blountville, TN 37617
|
- sq. feet
|
- baths - beds |
show details | |

|
#22
Island Rd
Blountville, TN 37617
|
- sq. feet
|
- baths - beds |
show details | |

|
#23
Fall Creek Rd Apt 11
Blountville, TN 37617
|
- sq. feet
|
- baths - beds |
show details | |

|
#24
Highway 126
Blountville, TN 37617
|
- sq. feet
|
- baths - beds |
show details | |

|
#25
Olinger Rd
Blountville, TN 37617
|
- sq. feet
|
- baths - beds |
show details | |

|
#26
5th St
Bristol, TN 37620
|
2,380 sq. feet
|
2 baths 5 beds |
$360,000
|
show details |

|
#27
S Summer Sound Rd
Piney Flats, TN 37686
|
1,404 sq. feet
|
3 baths 4 beds |
show details | |

|
#28
Miller Hill Rd
Johnson City, TN 37601
|
- sq. feet
|
- baths - beds |
$93,600
|
show details |

|
#29
Fowlers Branch Rd
Hiltons, VA 24258
|
- sq. feet
|
2 baths 3 beds |
show details | |

|
#30
Peery St
Kingsport, TN 37665
|
1,354 sq. feet
|
2 baths 3 beds |
show details |
| Photo | Address | Area | Beds / Baths | Price | Details |
|---|---|---|---|---|---|

|
#31
Ridgecrest Ave
Kingsport, TN 37660
|
- sq. feet
|
2 baths 3 beds |
show details | |

|
#32
S Riverside Dr
Elizabethton, TN 37643
|
936 sq. feet
|
1 baths 2 beds |
show details | |

|
#33
Cross St
Gate City, VA 24251
|
- sq. feet
|
1 baths 3 beds |
show details | |

|
#34
Pine St
Weber City, VA 24290
|
- sq. feet
|
1 baths 3 beds |
show details | |

|
#35
Highland St
Gate City, VA 24251
|
1,404 sq. feet
|
2 baths 3 beds |
show details | |

|
#36
Cleveland Rd
Abingdon, VA 24211
|
1,069 sq. feet
|
1 baths 3 beds |
show details | |

|
#37
Princeton Rd
Kingsport, TN 37660
|
1,111 sq. feet
|
1 baths - beds |
show details | |

|
#38
Grove Park Dr
Bristol, TN 37620
|
1,664 sq. feet
|
2 baths - beds |
show details | |

|
#39
E Carters Valley Rd
Gate City, VA 24251
|
1,400 sq. feet
|
1 baths 2 beds |
show details | |

|
#40
Howard Lipford Dr
Elizabethton, TN 37643
|
1,988 sq. feet
|
1 baths - beds |
show details |
| Photo | Address | Area | Beds / Baths | Price | Details |
|---|---|---|---|---|---|

|
#41
Archcrest St
Kingsport, TN 37664
|
1,036 sq. feet
|
2 baths - beds |
show details | |

|
#42
Miller Hill Rd
Bristol, VA 24202
|
3,096 sq. feet
|
3 baths 3 beds |
show details | |

|
#43
Bethesda Rd
Bristol, VA 24202
|
1,565 sq. feet
|
1 baths 3 beds |
show details | |

|
#44
Greene Meadows Dr
Elizabethton, TN 37643
|
2,352 sq. feet
|
3 baths - beds |
show details | |

|
#45
Old Elizabethton Hwy
Bluff City, TN 37618
|
2,826 sq. feet
|
2 baths - beds |
show details | |

|
#46
Tranbarger Rd
Bristol, VA 24202
|
1,092 sq. feet
|
2 baths 4 beds |
show details | |

|
#47
Haskell Station Rd
Bristol, VA 24202
|
1,063 sq. feet
|
1 baths 3 beds |
show details | |

|
#48
Hill Park Dr
Bristol, VA 24201
|
1,422 sq. feet
|
1 baths 4 beds |
show details | |

|
#49
Oakwinds Cir
Bristol, VA 24202
|
1,056 sq. feet
|
1 baths 3 beds |
show details | |

|
Check over 1 million property listings on Foreclosure.com!
|
browse all offers | |||

Latest news about housing in Blountville, TN collected exclusively by city-data.com from local newspapers, TV, and radio stations

 | Tricities Condos/Townhouses (8 replies) |
| WSJ: Johnson City #3 housing market in nation. (49 replies) |
| What Effect Will Covid 19 Have On Home Prices? (31 replies) |
| Blountville Apartments (3 replies) |
| Seeking information about home builders (6 replies) |
| Houses for rent (16 replies) |

Median year apartment built: 1992
Household type by relationship:
Households: 3,308- Male householders: 648 (58 living alone), Female householders: 438 (149 living alone)
555 spouses (535 opposite-sex spouses), 81 unmarried partners, (81 opposite-sex unmarried partners), 556 children (489 natural, 7 adopted, 59 stepchildren), 101 grandchildren, 13 brothers or sisters, 43 parents, 0 foster children, 34 other relatives, 43 non-relatives
- In group quarters: 792
Size of family households: 573 2-persons, 128 3-persons, 75 4-persons, 32 5-persons, 6 6-persons.
Size of nonfamily households: 205 1-person, 99 2-persons.
188 married couples with children.
80 single-parent households (71 men, 9 women).
96.5% of residents of Blountville speak English at home.
2.0% of residents speak Spanish at home (100% speak English very well).
0.4% of residents speak other Indo-European language at home (100% speak English very well).
0.2% of residents speak Asian or Pacific Island language at home (100% speak English very well).
0.3% of residents speak other language at home (100% speak English very well).
| Here: | 6.2 |
| State: | 6.5 |
| Here: | 4.2 |
| State: | 4.4 |

- Bedrooms in owner-occupied houses and condos in Blountville, Tennessee
- 0no bedroom
- 111 bedroom
- 2012 bedrooms
- 4883 bedrooms
- 1884 bedrooms
- 265+ bedrooms

- Bedrooms in renter-occupied apartments in Blountville, Tennessee
- 0no bedroom
- 511 bedroom
- 1002 bedrooms
- 423 bedrooms
- 04 bedrooms
- 05+ bedrooms

- Cars and other vehicles available in Blountville in owner-occupied houses/condos
- 0no vehicle
- 2611 vehicle
- 3682 vehicles
- 1663 vehicles
- 1164 vehicles
- 35+ vehicles

- Cars and other vehicles available in Blountville in renter-occupied apartments
- 30no vehicle
- 1171 vehicle
- 352 vehicles
- 113 vehicles
- 04 vehicles
- 05+ vehicles

- Rooms in owner-occupied houses in Blountville, Tennessee
- 01 room
- 02 rooms
- 123 rooms
- 1324 rooms
- 1285 rooms
- 3016 rooms
- 1737 rooms
- 268 rooms
- 1419+ rooms

- Rooms in renter-occupied apartments in Blountville, Tennessee
- 01 room
- 02 rooms
- 513 rooms
- 774 rooms
- 445 rooms
- 106 rooms
- 107 rooms
- 08 rooms
- 09+ rooms


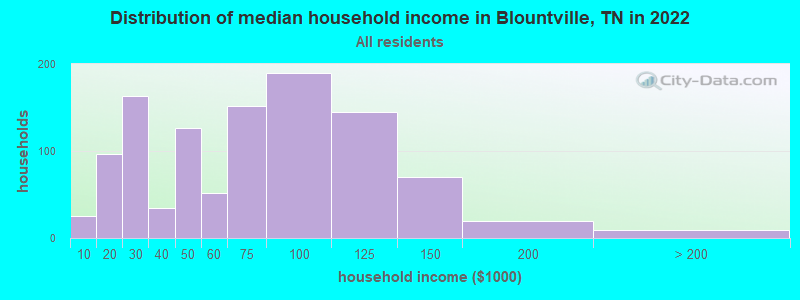
Blountville, TN household income distribution

- 25Less than $10,000
- 97$10,000 to $19,999
- 163$20,000 to $29,999
- 35$30,000 to $39,999
- 127$40,000 to $49,999
- 52$50,000 to $59,999
- 152$60,000 to $74,999
- 190$75,000 to $99,999
- 145$100,000 to $124,999
- 70$125,000 to $149,999
- 19$150,000 to $199,999
- 9$200,000 or more
Home value of owner - occupied houses in 2022 in Blountville, TN
-
- 14$25,000 to $29,999
- 11$40,000 to $49,999
- 47$80,000 to $89,999
- 18$90,000 to $99,999
- 151$100,000 to $124,999
- 68$125,000 to $149,999
- 81$150,000 to $174,999
- 83$175,000 to $199,999
- 141$200,000 to $249,999
- 50$250,000 to $299,999
- 150$300,000 to $399,999
- 50$400,000 to $499,999

Rent paid by renters in 2022 in Blountville, TN
-
- 60$500 to $549
- 26$700 to $749
- 46$800 to $899
- 46$900 to $999
- 23No cash rent


Percentage of workers working in this county: 69.4%
Number of people working at home: 66 (5.4% of all workers)
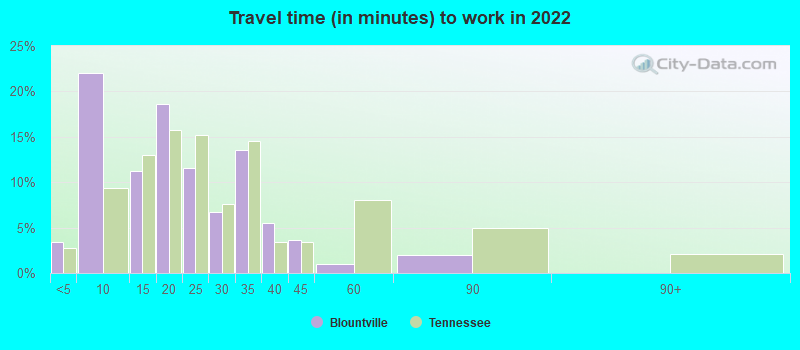
Travel time to work (commute)
- Less than 5 minutes: 161
- 5 to 9 minutes: 153
- 10 to 14 minutes: 132
- 15 to 19 minutes: 124
- 20 to 24 minutes: 166
- 25 to 29 minutes: 60
- 30 to 34 minutes: 179
- 35 to 39 minutes: 31
- 40 to 44 minutes: 81
- 45 to 59 minutes: 4
- 60 to 89 minutes: 16
- 90 or more minutes: 23
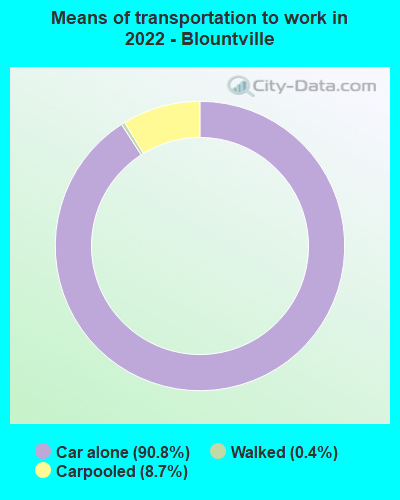
Means of transportation to work:
- Drove a car alone: 1,460 (84.1%)
- Carpooled: 148 (8.5%)
- Walked: 7 (0.4%)
- Worked at home: 66 (3.8%)

- Unemployment by race in 2022
- Unemployment rate for White non-Hispanic residents
- 8.5%Males

- Year of entry for the foreign-born population in Blountville, Tennessee
- 101995 to March 2000
- 01990 to 1994
- 01985 to 1989
- 01980 to 1984
- 01975 to 1979
- 01970 to 1974
- 01965 to 1969
- 0Before 1965

First ancestries reported:
- English: 520 (28.7%)
- American: 453 (25.0%)
- Irish: 400 (22.1%)
- German: 168 (9.3%)
- Scotch-Irish: 74 (4.1%)
- Italian: 23 (1.3%)
- Polish: 16 (0.9%)
- Scottish: 11 (0.6%)
- African: 10 (0.6%)
- French: 8 (0.4%)
- Hungarian: 7 (0.4%)
- French Canadian: 4 (0.2%)
Most common places of birth for foreign-born residents (%):
| Blountville: | 100.0% (10) |
| Tennessee: | 3.6% (5,726) |
Place of birth for U.S.-born residents:
- This state: 1,987
- Other state: 1,286
- Northeast: 80
- Midwest: 126
- South: 989
- West: 90
78.0% of Blountville residents lived in the same house 1 years ago.
Out of people who lived in different houses, 28.1% lived in this county.
Out of people who lived in different counties, 67.7% lived in Tennessee.
| Blountville: | 78.0% |
| State average: | 87.0% |
Education attainment for males 25 years and older:
- No schooling: 0
- Nursery to 4th grade: 0
- 5th and 6th grade: 0
- 7th and 8th grade: 23
- 9th grade: 12
- 10th grade: 15
- 11th grade: 45
- 12th grade, no diploma: 33
- High school graduate (or equivalency): 637
- Less than 1 year of college: 93
- Some college more than 1 year, no degree: 310
- Associate degree: 168
- Bachelor's degree: 151
- Master's degree: 73
- Professional school degree: 8
- Doctorate degree: 0

Education attainment for females 25 years and older:
- No schooling: 0
- Nursery to 4th grade: 0
- 5th and 6th grade: 0
- 7th and 8th grade: 69
- 9th grade: 0
- 10th grade: 7
- 11th grade: 38
- 12th grade, no diploma: 14
- High school graduate (or equivalency): 395
- Less than 1 year of college: 133
- Some college more than 1 year, no degree: 165
- Associate degree: 94
- Bachelor's degree: 226
- Master's degree: 102
- Professional school degree: 0
- Doctorate degree: 0


Housing units in structures:
- One, detached: 871
- One, attached: 12
- 5 to 9: 59
- 10 to 19: 40
- 50 or more: 14
- Mobile homes: 191
Median worth of mobile homes: $239,065
Housing units lacking complete kitchen facilities in 2022: 4.5%
House/condo owner moved in on average 16 years ago
Renter moved in on average 1 years ago

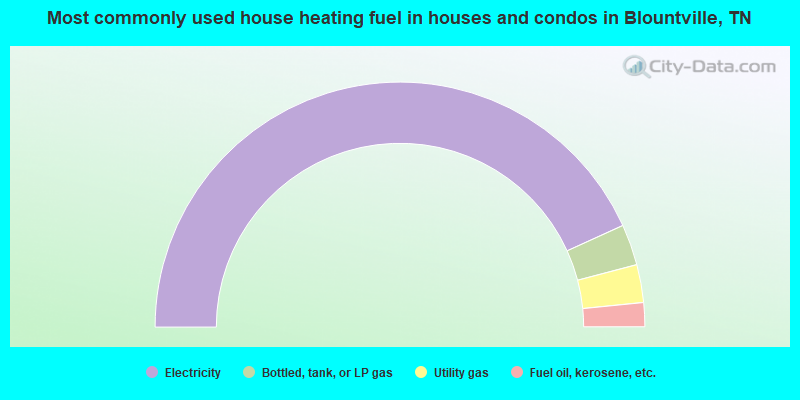
- 86.5%Electricity
- 5.4%Bottled, tank, or LP gas
- 5.0%Utility gas
- 3.2%Fuel oil, kerosene, etc.
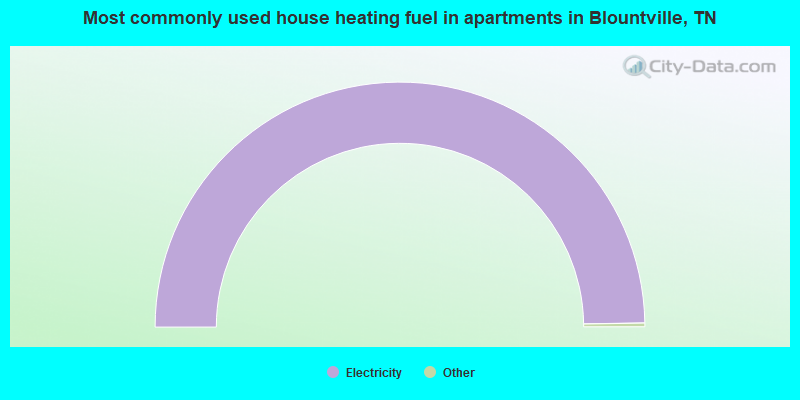
- 100.0%Electricity
Private vs. public school enrollment:
| Here: | 39.5% |
| Tennessee: | 15.0% |
| Here: | 78.3% |
| Tennessee: | 16.2% |
| Here: | 48.3% |
| Tennessee: | 23.5% |


