Blue Mound, TX (Texas) Houses and Residents
| Blue Mound: | $185,473 |
| Texas: | $275,400 |
Mean price in 2022:
Detached houses: $230,758
Here: $230,758 State: $369,058
Total population: 2,475 (Urban population: 2,390, Rural population: 0)
Houses: 937 (914 occupied: 748 owner occupied, 168 renter occupied)
| % of renters here: | 18% |
| State: | 38% |
Housing density: 1,744 houses/condos per square mile
Median price asked for vacant for-sale houses and condos in 2022: $578,512.
Median contract rent in 2022: $1,155 (lower quartile is $961, upper quartile is $1,429)
Median rent asked for vacant for-rent units in 2022: $855
Median gross rent in Blue Mound, TX in 2022: $1,398
Housing units in Blue Mound with a mortgage: 367 (9 second mortgage, 0 home equity loan, 10 both second mortgage and home equity loan)
Houses without a mortgage: 0
Median household income for houses/condos with a mortgage: $77,866
Median household income for apartments without a mortgage: $56,079
Median monthly housing costs: $1,064
Compare current foreclosures near Blue Mound, TX:
| Photo | Address | Area | Beds / Baths | Price | Details |
|---|---|---|---|---|---|

|
#1
Bay Club Dr
Arlington, TX 76013
|
4,020 sq. feet
|
4 baths 4 beds |
$780,000
|
show details |

|
#2
Harney Dr
Keller, TX 76244
|
2,027 sq. feet
|
2 baths 4 beds |
show details | |

|
#3
Evergreen Dr
Keller, TX 76244
|
2,144 sq. feet
|
2 baths 3 beds |
show details | |

|
#4
Milam St
Fort Worth, TX 76112
|
1,193 sq. feet
|
2 baths 3 beds |
show details | |

|
#5
Frances Ann Ct
Haslet, TX 76052
|
2,632 sq. feet
|
2 baths 3 beds |
show details | |

|
#6
Springdale Ct
Fort Worth, TX 76148
|
2,002 sq. feet
|
2 baths 3 beds |
show details | |

|
#7
Peppercorn Dr
Euless, TX 76039
|
2,552 sq. feet
|
2 baths 3 beds |
show details | |

|
#8
Glengate Ct
Arlington, TX 76016
|
1,052 sq. feet
|
2 baths 3 beds |
show details | |

|
#9
Chimney Ct
Arlington, TX 76016
|
2,033 sq. feet
|
2 baths 3 beds |
show details | |

|
#10
Meadowlark Dr
Rhome, TX 76078
|
1,782 sq. feet
|
2 baths 4 beds |
show details |
| Photo | Address | Area | Beds / Baths | Price | Details |
|---|---|---|---|---|---|

|
#11
Southwood Ct
Grapevine, TX 76051
|
3,206 sq. feet
|
3 baths 4 beds |
show details | |

|
#12
Arnold Ave
Arlington, TX 76010
|
2,638 sq. feet
|
2 baths 3 beds |
show details | |

|
#13
Montreal Cir
Haltom City, TX 76117
|
1,487 sq. feet
|
1 baths 3 beds |
show details | |

|
#14
Smilax Ave
Fort Worth, TX 76111
|
1,230 sq. feet
|
1 baths 3 beds |
show details | |

|
#15
Stone Lake Dr
Fort Worth, TX 76179
|
1,370 sq. feet
|
2 baths 3 beds |
show details | |

|
#16
Lionel Way
Fort Worth, TX 76108
|
1,934 sq. feet
|
2 baths 3 beds |
show details | |

|
#17
Darla Dr
Fort Worth, TX 76132
|
1,192 sq. feet
|
2 baths 3 beds |
show details | |

|
#18
Southpark Ln
Fort Worth, TX 76133
|
- sq. feet
|
2 baths 4 beds |
show details | |

|
#19
Bridal Trl
Fort Worth, TX 76179
|
2,600 sq. feet
|
2 baths 4 beds |
show details | |

|
#20
Chambers Creek Dr
Fort Worth, TX 76140
|
1,833 sq. feet
|
2 baths 3 beds |
show details |
| Photo | Address | Area | Beds / Baths | Price | Details |
|---|---|---|---|---|---|

|
#21
Edgefield Rd
Fort Worth, TX 76107
|
2,660 sq. feet
|
3 baths 4 beds |
show details | |

|
#22
N Ector Dr
Euless, TX 76039
|
1,643 sq. feet
|
2 baths 3 beds |
show details | |

|
#23
Briley Dr
North Richland Hills, TX 76180
|
1,763 sq. feet
|
2 baths 3 beds |
show details | |

|
#24
Arbor Lake Rd
Rhome, TX 76078
|
- sq. feet
|
2 baths 4 beds |
show details | |

|
#25
W N Woody Rd
Azle, TX 76020
|
1,872 sq. feet
|
2 baths 4 beds |
show details | |

|
#26
Gill St
Fort Worth, TX 76131
|
1,120 sq. feet
|
1 baths 3 beds |
show details | |

|
#27
Highland Dr
Colleyville, TX 76034
|
3,298 sq. feet
|
3 baths 4 beds |
show details | |

|
#28
Dillon Cir
Fort Worth, TX 76137
|
3,485 sq. feet
|
2 baths 4 beds |
show details | |

|
#29
Lilac St
Fort Worth, TX 76110
|
2,000 sq. feet
|
3 baths 3 beds |
show details | |

|
#30
Karla Dr
Hurst, TX 76053
|
1,586 sq. feet
|
2 baths 3 beds |
show details |
| Photo | Address | Area | Beds / Baths | Price | Details |
|---|---|---|---|---|---|

|
#31
Chris Dr
Keller, TX 76244
|
3,001 sq. feet
|
2 baths 4 beds |
show details | |

|
#32
Buck Mountain Pass
Fort Worth, TX 76179
|
1,316 sq. feet
|
2 baths 3 beds |
show details | |

|
#33
New Harbor Ln
Fort Worth, TX 76179
|
1,264 sq. feet
|
2 baths 3 beds |
show details | |

|
#34
Perdido Dr
Fort Worth, TX 76148
|
- sq. feet
|
2 baths 3 beds |
show details | |

|
#35
Saddle Trl
Fort Worth, TX 76116
|
1,797 sq. feet
|
2 baths 3 beds |
show details | |

|
#36
Oakhaven Ct
Arlington, TX 76016
|
1,707 sq. feet
|
2 baths 3 beds |
show details | |

|
#37
Melbourn St
Haltom City, TX 76117
|
968 sq. feet
|
1 baths 2 beds |
show details | |

|
#38
E Arlington Ave
Fort Worth, TX 76104
|
2,668 sq. feet
|
6 baths 6 beds |
show details | |

|
#39
Sweet Flag Lane
Fort Worth, TX 76123
|
2,816 sq. feet
|
2 baths 4 beds |
show details | |

|
#40
Bay Meadows Dr
Southlake, TX 76092
|
4,421 sq. feet
|
4 baths 5 beds |
show details |
| Photo | Address | Area | Beds / Baths | Price | Details |
|---|---|---|---|---|---|

|
#41
N Park Dr
Fort Worth, TX 76148
|
1,513 sq. feet
|
2 baths 3 beds |
show details | |

|
#42
Shallow Creek Dr
Fort Worth, TX 76179
|
1,736 sq. feet
|
2 baths 3 beds |
show details | |

|
#43
Montclair Dr
Fort Worth, TX 76103
|
1,428 sq. feet
|
3 baths 4 beds |
show details | |

|
#44
Norris Valley Dr
Fort Worth, TX 76135
|
1,032 sq. feet
|
2 baths 3 beds |
show details | |

|
#45
Mystic River Trl
Fort Worth, TX 76131
|
1,810 sq. feet
|
2 baths 4 beds |
show details | |

|
#46
Wooddale
Euless, TX 76039
|
1,899 sq. feet
|
2 baths 3 beds |
show details | |

|
#47
Plainfield Dr
Fort Worth, TX 76108
|
1,071 sq. feet
|
2 baths 3 beds |
show details | |

|
#48
Ridge Dr
Arlington, TX 76016
|
1,698 sq. feet
|
2 baths 3 beds |
show details | |

|
#49
Gold Seeker Way
Haslet, TX 76052
|
1,932 sq. feet
|
2 baths 4 beds |
show details | |

|
Check over 1 million property listings on Foreclosure.com!
|
browse all offers | |||


 | Our water meter is 2000 feet from property line and there is a leak (1 reply) |
| Newer homes not in a HOA? (11 replies) |
| 46 yr old, divorced female moving to Fort Worth (24 replies) |
| Blue Mound Water (1 reply) |
| 2018 Move to Fort Worth (32 replies) |
| City of Blue Mound (8 replies) |

Median year apartment built: 1966
Household type by relationship:
Households: 2,672- Male householders: 381 (62 living alone), Female householders: 515 (98 living alone)
603 spouses (600 opposite-sex spouses), 27 unmarried partners, (27 opposite-sex unmarried partners), 960 children (909 natural, 10 adopted, 40 stepchildren), 28 grandchildren, 26 brothers or sisters, 11 parents, 3 foster children, 27 other relatives, 87 non-relatives
Size of family households: 261 2-persons, 175 3-persons, 158 4-persons, 78 5-persons, 3 6-persons, 21 7-or-more-persons.
Size of nonfamily households: 174 1-person, 24 2-persons, 10 3-persons.
555 married couples with children.
123 single-parent households (55 men, 68 women).
58.8% of residents of Blue Mound speak English at home.
40.1% of residents speak Spanish at home (67% speak English very well, 14% speak English well, 15% speak English not well, 4% don't speak English at all).
0.5% of residents speak other Indo-European language at home (100% speak English very well).
0.8% of residents speak Asian or Pacific Island language at home (50% speak English very well, 20% speak English well, 30% speak English not well).
Foreign born population: 517 (19.3%)
(33.5% of them are naturalized citizens)
| Here: | 5.8 |
| State: | 6.3 |
| Here: | 5.7 |
| State: | 4.0 |

- Bedrooms in owner-occupied houses and condos in Blue Mound, Texas
- 14no bedroom
- 01 bedroom
- 402 bedrooms
- 4943 bedrooms
- 1454 bedrooms
- 565+ bedrooms

- Bedrooms in renter-occupied apartments in Blue Mound, Texas
- 0no bedroom
- 151 bedroom
- 192 bedrooms
- 1203 bedrooms
- 164 bedrooms
- 05+ bedrooms

- Cars and other vehicles available in Blue Mound in owner-occupied houses/condos
- 17no vehicle
- 1441 vehicle
- 3932 vehicles
- 1363 vehicles
- 514 vehicles
- 85+ vehicles

- Cars and other vehicles available in Blue Mound in renter-occupied apartments
- 15no vehicle
- 381 vehicle
- 992 vehicles
- 143 vehicles
- 44 vehicles
- 05+ vehicles

- Rooms in owner-occupied houses in Blue Mound, Texas
- 141 room
- 02 rooms
- 03 rooms
- 564 rooms
- 1895 rooms
- 3276 rooms
- 1417 rooms
- 198 rooms
- 39+ rooms

- Rooms in renter-occupied apartments in Blue Mound, Texas
- 01 room
- 02 rooms
- 23 rooms
- 184 rooms
- 435 rooms
- 706 rooms
- 247 rooms
- 38 rooms
- 99+ rooms


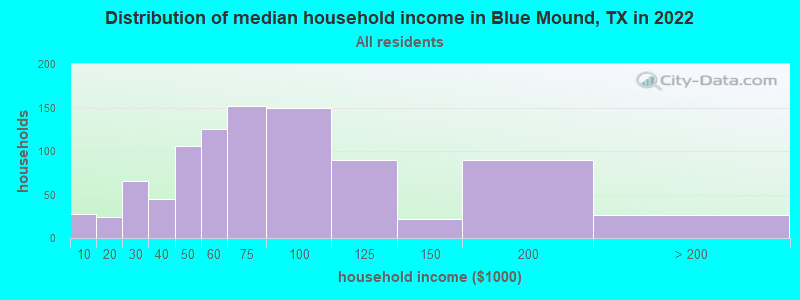
Blue Mound, TX household income distribution

- 28Less than $10,000
- 24$10,000 to $19,999
- 65$20,000 to $29,999
- 45$30,000 to $39,999
- 106$40,000 to $49,999
- 125$50,000 to $59,999
- 152$60,000 to $74,999
- 150$75,000 to $99,999
- 90$100,000 to $124,999
- 22$125,000 to $149,999
- 90$150,000 to $199,999
- 26$200,000 or more
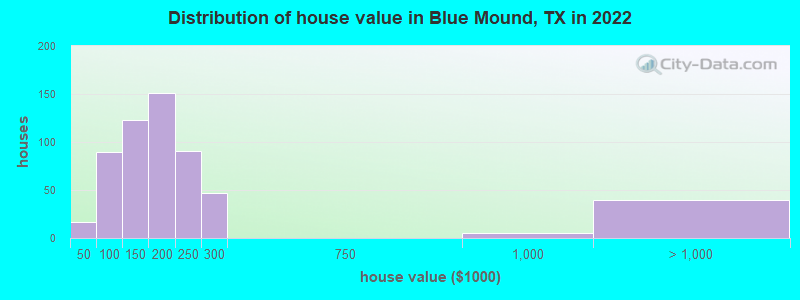
Home value of owner - occupied houses in 2022 in Blue Mound, TX
-
- 11Less than $10,000
- 3$20,000 to $24,999
- 2$35,000 to $39,999
- 8$50,000 to $59,999
- 10$70,000 to $79,999
- 36$80,000 to $89,999
- 35$90,000 to $99,999
- 82$100,000 to $124,999
- 41$125,000 to $149,999
- 73$150,000 to $174,999
- 77$175,000 to $199,999
- 91$200,000 to $249,999
- 46$250,000 to $299,999
- 5$750,000 to $999,999
- 40$1,000,000 to $1,499,999
Rent paid by renters in 2022 in Blue Mound, TX
-
- 2$500 to $549
- 4$600 to $649
- 10$700 to $749
- 11$800 to $899
- 19$900 to $999
- 41$1,000 to $1,249
- 38$1,250 to $1,499
- 2$1,500 to $1,999
- 13$2,500 to $2,999
- 23No cash rent


Percentage of workers working in this county: 90.7%
Number of people working at home: 126 (9.5% of all workers)
Travel time to work (commute)
- Less than 5 minutes: 9
- 5 to 9 minutes: 100
- 10 to 14 minutes: 146
- 15 to 19 minutes: 159
- 20 to 24 minutes: 292
- 25 to 29 minutes: 98
- 30 to 34 minutes: 196
- 35 to 39 minutes: 38
- 40 to 44 minutes: 39
- 45 to 59 minutes: 54
- 60 to 89 minutes: 47
- 90 or more minutes: 4
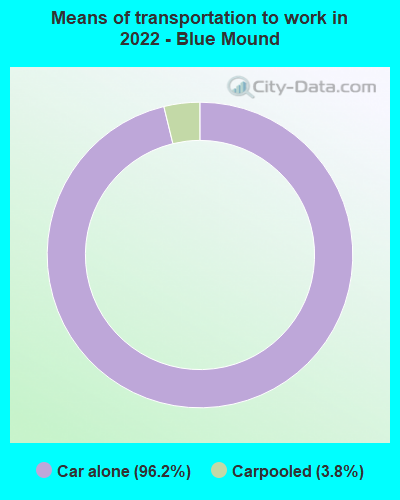
Means of transportation to work:
- Drove a car alone: 1,027 (84.2%)
- Carpooled: 41 (3.4%)
- Worked at home: 126 (10.3%)

- Unemployment by race in 2022
- Unemployment rate for White non-Hispanic residents
- 10.2%Males
- 2.5%Females
- Unemployment rate for two or more race residents
- 2.0%Males
- Unemployment rate for Hispanic or Latino residents
- 1.5%Males

- Year of entry for the foreign-born population in Blue Mound, Texas
- 1112010 or later
- 1772000 to 2009
- 631990 to 1999
- 1001980 to 1989
- 601970 to 1979
- 31Before 1970
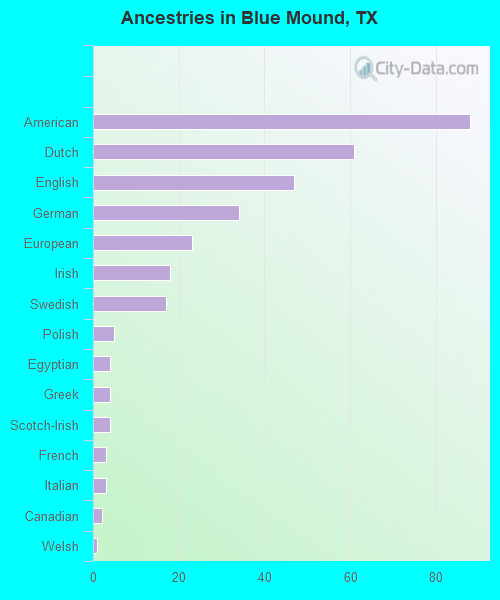
First ancestries reported:
- American: 88 (5.4%)
- Dutch: 61 (3.8%)
- English: 47 (2.9%)
- German: 34 (2.1%)
- European: 23 (1.4%)
- Irish: 18 (1.1%)
- Swedish: 17 (1.0%)
- Polish: 5 (0.3%)
- Egyptian: 4 (0.2%)
- Greek: 4 (0.2%)
- Scotch-Irish: 4 (0.2%)
- French: 3 (0.2%)
- Italian: 3 (0.2%)
- Canadian: 2 (0.1%)
- Welsh: 1 (0.06%)
Most common places of birth for foreign-born residents (%):
| Blue Mound: | 84.2% (442) |
| Texas: | 48.4% (2,411,723) |
| Blue Mound: | 8.0% (42) |
| Texas: | 3.0% (147,182) |
| Blue Mound: | 1.7% (9) |
| Texas: | 3.7% (184,770) |
Place of birth for U.S.-born residents:
- This state: 1,738
- Other state: 349
- Northeast: 52
- Midwest: 98
- South: 149
- West: 44
93.3% of Blue Mound residents lived in the same house 1 years ago.
Out of people who lived in different houses, 42.2% lived in this county.
Out of people who lived in different counties, 82.9% lived in Texas.
| Blue Mound: | 93.3% |
| State average: | 85.7% |
Education attainment for males 25 years and older:
- No schooling: 6
- Nursery to 4th grade: 30
- 5th and 6th grade: 8
- 7th and 8th grade: 21
- 9th grade: 112
- 10th grade: 60
- 11th grade: 29
- 12th grade, no diploma: 19
- High school graduate (or equivalency): 316
- Less than 1 year of college: 79
- Some college more than 1 year, no degree: 81
- Associate degree: 60
- Bachelor's degree: 56
- Master's degree: 7
- Professional school degree: 0
- Doctorate degree: 0

Education attainment for females 25 years and older:
- No schooling: 17
- Nursery to 4th grade: 6
- 5th and 6th grade: 39
- 7th and 8th grade: 42
- 9th grade: 56
- 10th grade: 21
- 11th grade: 0
- 12th grade, no diploma: 4
- High school graduate (or equivalency): 311
- Less than 1 year of college: 70
- Some college more than 1 year, no degree: 83
- Associate degree: 96
- Bachelor's degree: 50
- Master's degree: 23
- Professional school degree: 4
- Doctorate degree: 0


Housing units in structures:
- One, detached: 907
- 10 to 19: 14
- 50 or more: 12
- Mobile homes: 3
Housing units lacking complete kitchen facilities in 2022: 0.8%
House/condo owner moved in on average 18 years ago
Renter moved in on average 3 years ago

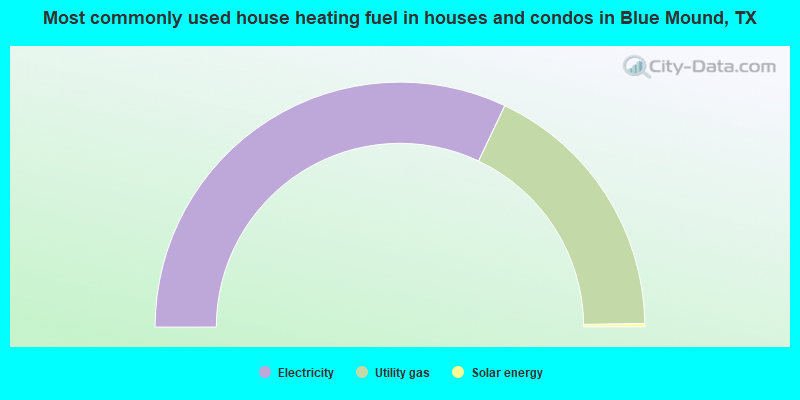
- 64.1%Electricity
- 35.5%Utility gas
- 0.4%Solar energy
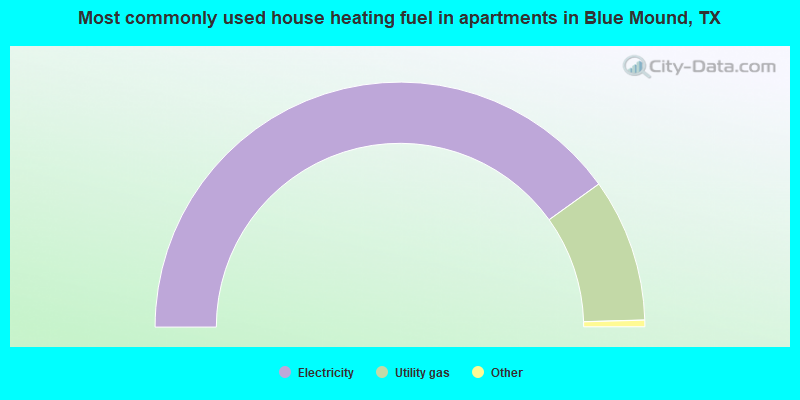
- 80.9%Electricity
- 19.1%Utility gas
Private vs. public school enrollment:
| Here: | 2.7% |
| Texas: | 8.8% |
| Here: | 16.7% |
| Texas: | 8.0% |
| Here: | 19.8% |
| Texas: | 16.2% |


