Blue Mountain, MS (Mississippi) Houses and Residents
| Blue Mountain: | $81,573 |
| Mississippi: | $162,500 |
Mean price in 2022:
Detached houses: $110,663
Here: $110,663 State: $226,494 Mobile homes: $84,820
Here: $84,820 State: $73,695
Total population: 918 (Urban population: 0, Rural population: 618 (3 farm, 615 nonfarm))
Houses: 358 (306 occupied: 158 owner occupied, 150 renter occupied)
| % of renters here: | 49% |
| State: | 30% |
Housing density: 310 houses/condos per square mile
Median price asked for vacant for-sale houses and condos in 2022 in this county: $128,750.
Median contract rent in 2022: $440
Median rent asked for vacant for-rent units in 2022: $709
Median gross rent in Blue Mountain, MS in 2022: $613
Housing units in Blue Mountain with a mortgage: 76 (0 second mortgage, 0 home equity loan, 0 both second mortgage and home equity loan)
Houses without a mortgage: 3
Median household income for houses/condos with a mortgage: $55,144
Median household income for apartments without a mortgage: $56,439
Median monthly housing costs: $588
Compare current foreclosures near Blue Mountain, MS:
| Photo | Address | Area | Beds / Baths | Price | Details |
|---|---|---|---|---|---|

|
#1
W Mill St
Blue Mountain, MS 38610
|
1,923 sq. feet
|
1 baths - beds |
show details | |

|
#2
W Main St
Blue Mountain, MS 38610
|
2,637 sq. feet
|
1 baths - beds |
show details | |

|
#3
Ridgeland Dr
Blue Mountain, MS 38610
|
1,215 sq. feet
|
- baths - beds |
show details | |

|
#4
N Mountain St
Blue Mountain, MS 38610
|
- sq. feet
|
- baths - beds |
show details | |

|
#5
Bethel Rd
Blue Mountain, MS 38610
|
1,152 sq. feet
|
- baths - beds |
show details | |

|
#6
County Road 719
Blue Mountain, MS 38610
|
1,176 sq. feet
|
- baths - beds |
show details | |

|
#7
County Road 836
Blue Mountain, MS 38610
|
- sq. feet
|
- baths - beds |
show details | |

|
#8
Carter St
Blue Mountain, MS 38610
|
- sq. feet
|
- baths - beds |
show details | |

|
#9
County Road 700
Blue Mountain, MS 38610
|
- sq. feet
|
- baths - beds |
show details | |

|
#10
County Road 841
Blue Mountain, MS 38610
|
- sq. feet
|
- baths - beds |
show details |
| Photo | Address | Area | Beds / Baths | Price | Details |
|---|---|---|---|---|---|

|
#11
County Road 727
Blue Mountain, MS 38610
|
1,259 sq. feet
|
- baths - beds |
show details | |

|
#12
County Road 841
Blue Mountain, MS 38610
|
1,848 sq. feet
|
- baths - beds |
show details | |

|
#13
Elm St
Ripley, MS 38663
|
941 sq. feet
|
1 baths 3 beds |
$86,900
|
show details |

|
#14
Graham Ave
Myrtle, MS 38650
|
1,312 sq. feet
|
2 baths 3 beds |
show details | |

|
#15
County Road 238
New Albany, MS 38652
|
1,012 sq. feet
|
- baths - beds |
$4,900
|
show details |

|
#16
Lake Arrowhead Dr
Hickory Flat, MS 38633
|
1,344 sq. feet
|
1 baths 3 beds |
show details | |

|
#17
Monticello St
New Albany, MS 38652
|
1,892 sq. feet
|
2 baths 3 beds |
show details | |

|
#18
County Road 64 S
New Albany, MS 38652
|
1,056 sq. feet
|
1 baths 3 beds |
show details | |

|
#19
Cherry Tree Ln
New Albany, MS 38652
|
1,674 sq. feet
|
1 baths 3 beds |
show details | |

|
#20
County Road 64 S
New Albany, MS 38652
|
1,161 sq. feet
|
1 baths - beds |
show details |
| Photo | Address | Area | Beds / Baths | Price | Details |
|---|---|---|---|---|---|

|
#21
Cherry Blvd
New Albany, MS 38652
|
1,675 sq. feet
|
1 baths - beds |
show details | |

|
#22
County Road 91
New Albany, MS 38652
|
1,152 sq. feet
|
1 baths - beds |
show details | |

|
#23
County Road 173
Guntown, MS 38849
|
1,472 sq. feet
|
1 baths - beds |
show details | |

|
#24
Rolling Hills Dr
New Albany, MS 38652
|
1,233 sq. feet
|
1 baths - beds |
show details | |

|
#25
Rolling Hills Dr
New Albany, MS 38652
|
1,220 sq. feet
|
1 baths - beds |
show details | |

|
#26
County Road 152
New Albany, MS 38652
|
1,380 sq. feet
|
1 baths - beds |
show details | |

|
#27
Woodland Dr
New Albany, MS 38652
|
1,552 sq. feet
|
1 baths - beds |
show details | |

|
#28
E Pontotoc Ave
Potts Camp, MS 38659
|
1,512 sq. feet
|
1 baths - beds |
show details | |

|
#29
County Road 140
New Albany, MS 38652
|
2,172 sq. feet
|
1 baths - beds |
show details | |

|
#30
Byrne St
New Albany, MS 38652
|
1,566 sq. feet
|
1 baths - beds |
show details |
| Photo | Address | Area | Beds / Baths | Price | Details |
|---|---|---|---|---|---|

|
#31
County Road 163
Dumas, MS 38625
|
728 sq. feet
|
- baths 3 beds |
show details | |

|
#32
James St
New Albany, MS 38652
|
910 sq. feet
|
1 baths - beds |
show details | |

|
#33
County Road 64 S
New Albany, MS 38652
|
962 sq. feet
|
- baths 3 beds |
show details | |

|
#34
Meadow Ln
New Albany, MS 38652
|
1,559 sq. feet
|
1 baths - beds |
show details | |

|
#35
County Road 501
Ripley, MS 38663
|
960 sq. feet
|
- baths 2 beds |
show details | |

|
#36
Highway 349 S
Potts Camp, MS 38659
|
1,222 sq. feet
|
1 baths - beds |
show details | |

|
#37
County Road 808
Ripley, MS 38663
|
1,152 sq. feet
|
1 baths - beds |
show details | |

|
#38
E Walnut St
Ripley, MS 38663
|
2,280 sq. feet
|
1 baths - beds |
show details | |

|
#39
W 1st St
Ripley, MS 38663
|
1,201 sq. feet
|
1 baths - beds |
show details | |

|
#40
Windham Ln
Ripley, MS 38663
|
2,189 sq. feet
|
1 baths - beds |
show details |
| Photo | Address | Area | Beds / Baths | Price | Details |
|---|---|---|---|---|---|

|
#41
Mary Ellen Dr
Ripley, MS 38663
|
1,656 sq. feet
|
1 baths - beds |
show details | |

|
#42
Highway 5
Hickory Flat, MS 38633
|
- sq. feet
|
- baths - beds |
show details | |

|
#43
Mill St
New Albany, MS 38652
|
1,092 sq. feet
|
- baths - beds |
show details | |

|
#44
Morton Rounds
New Albany, MS 38652
|
- sq. feet
|
- baths - beds |
show details | |

|
#45
Kings Creek Rd Apt 12
New Albany, MS 38652
|
- sq. feet
|
- baths - beds |
show details | |

|
#46
2nd St
Ashland, MS 38603
|
- sq. feet
|
- baths - beds |
show details | |

|
#47
County Road 239
Falkner, MS 38629
|
- sq. feet
|
- baths - beds |
show details | |

|
#48
Ashland Rd
Ripley, MS 38663
|
- sq. feet
|
- baths - beds |
show details | |

|
#49
State Highway 348, Lot 2
New Albany, MS 38652
|
- sq. feet
|
- baths - beds |
show details | |

|
Check over 1 million property listings on Foreclosure.com!
|
browse all offers | |||


 | housing needed at Blue Mountain College, Mississippi (0 replies) |
| Toyota plant in Blue Springs, MS (4363 replies) |

Median year apartment built: 1978
Household type by relationship:
Households: 1,093- Male householders: 173 (32 living alone), Female householders: 126 (49 living alone)
101 spouses (101 opposite-sex spouses), 19 unmarried partners, (19 opposite-sex unmarried partners), 232 children (159 natural, 7 adopted, 64 stepchildren), 82 grandchildren, 3 brothers or sisters, 0 parents, 0 foster children, 4 other relatives, 58 non-relatives
- In group quarters: 288
Size of family households: 69 2-persons, 74 3-persons, 18 4-persons, 9 5-persons, 26 6-persons, 4 7-or-more-persons.
Size of nonfamily households: 86 1-person, 14 2-persons, 4 5-persons.
26 married couples with children.
107 single-parent households (52 men, 55 women).
94.3% of residents of Blue Mountain speak English at home.
4.8% of residents speak Spanish at home (60% speak English very well, 6% speak English well, 24% speak English not well, 10% don't speak English at all).
0.1% of residents speak other language at home (100% speak English very well).
Foreign born population: 32 (2.9%)
(31.2% of them are naturalized citizens)
| Here: | 6.0 |
| State: | 6.3 |
| Here: | 5.7 |
| State: | 4.8 |

- Bedrooms in owner-occupied houses and condos in Blue Mountain, Mississippi
- 0no bedroom
- 11 bedroom
- 342 bedrooms
- 1143 bedrooms
- 64 bedrooms
- 45+ bedrooms

- Bedrooms in renter-occupied apartments in Blue Mountain, Mississippi
- 6no bedroom
- 121 bedroom
- 562 bedrooms
- 443 bedrooms
- 324 bedrooms
- 05+ bedrooms

- Cars and other vehicles available in Blue Mountain in owner-occupied houses/condos
- 0no vehicle
- 401 vehicle
- 582 vehicles
- 483 vehicles
- 64 vehicles
- 65+ vehicles

- Cars and other vehicles available in Blue Mountain in renter-occupied apartments
- 12no vehicle
- 891 vehicle
- 362 vehicles
- 93 vehicles
- 44 vehicles
- 05+ vehicles

- Rooms in owner-occupied houses in Blue Mountain, Mississippi
- 01 room
- 12 rooms
- 53 rooms
- 94 rooms
- 285 rooms
- 806 rooms
- 197 rooms
- 68 rooms
- 109+ rooms

- Rooms in renter-occupied apartments in Blue Mountain, Mississippi
- 61 room
- 122 rooms
- 103 rooms
- 304 rooms
- 115 rooms
- 536 rooms
- 07 rooms
- 48 rooms
- 249+ rooms


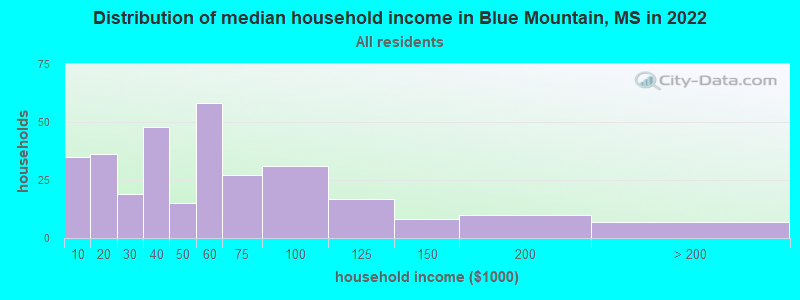
Blue Mountain, MS household income distribution

- 35Less than $10,000
- 36$10,000 to $19,999
- 19$20,000 to $29,999
- 48$30,000 to $39,999
- 15$40,000 to $49,999
- 58$50,000 to $59,999
- 27$60,000 to $74,999
- 31$75,000 to $99,999
- 17$100,000 to $124,999
- 8$125,000 to $149,999
- 10$150,000 to $199,999
- 7$200,000 or more
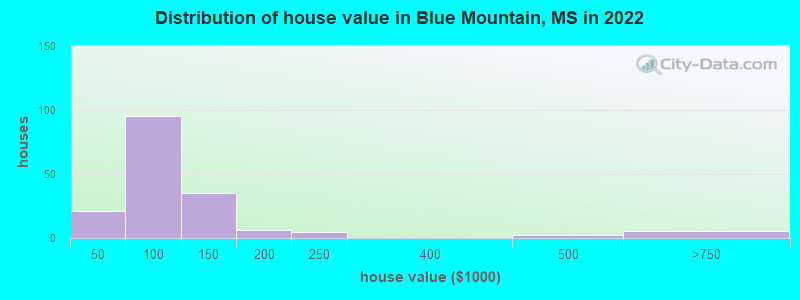
Home value of owner - occupied houses in 2022 in Blue Mountain, MS
-
- 1$30,000 to $34,999
- 1$35,000 to $39,999
- 18$40,000 to $49,999
- 43$50,000 to $59,999
- 1$60,000 to $69,999
- 21$70,000 to $79,999
- 7$80,000 to $89,999
- 3$90,000 to $99,999
- 16$100,000 to $124,999
- 18$125,000 to $149,999
- 4$150,000 to $174,999
- 1$175,000 to $199,999
- 4$200,000 to $249,999
- 2$400,000 to $499,999
- 5$500,000 to $749,999
Rent paid by renters in 2022 in Blue Mountain, MS
-
- 9Less than $100
- 17$100 to $149
- 7$150 to $199
- 5$250 to $299
- 11$300 to $349
- 16$400 to $449
- 9$450 to $499
- 22$500 to $549
- 3$550 to $599
- 38$600 to $649
- 17No cash rent


Percentage of workers working in this county: 64.3%
Number of people working at home: 42 (9.4% of all workers)
Travel time to work (commute)
- Less than 5 minutes: 53
- 5 to 9 minutes: 63
- 10 to 14 minutes: 33
- 15 to 19 minutes: 101
- 20 to 24 minutes: 50
- 25 to 29 minutes: 15
- 30 to 34 minutes: 19
- 35 to 39 minutes: 3
- 40 to 44 minutes: 16
- 45 to 59 minutes: 12
- 60 to 89 minutes: 18
- 90 or more minutes: 17
Means of transportation to work:
- Drove a car alone: 184 (77.0%)
- Carpooled: 29 (12.1%)
- Walked: 23 (9.6%)
- Other means: 3 (1.3%)

- Unemployment by race in 2022
- Unemployment rate for Black residents
- 29.6%Males
- Unemployment rate for other race residents
- 8.4%Females

- Year of entry for the foreign-born population in Blue Mountain, Mississippi
- 112010 or later
- 92000 to 2009
- 81990 to 1999
- 21980 to 1989
- 01970 to 1979
- 0Before 1970

First ancestries reported:
- English: 108 (17.0%)
- American: 101 (15.9%)
- Irish: 32 (5.0%)
- German: 23 (3.6%)
- Italian: 18 (2.8%)
- African: 11 (1.7%)
- Ukrainian: 4 (0.6%)
- European: 1 (0.2%)
- Scottish: 1 (0.2%)
Most common places of birth for foreign-born residents (%):
| Blue Mountain: | 26.5% (9) |
| Mississippi: | 0.9% (595) |
| Blue Mountain: | 26.5% (9) |
| Mississippi: | 25.4% (17,354) |
| Blue Mountain: | 14.7% (5) |
| Mississippi: | 1.9% (1,324) |
| Blue Mountain: | 11.8% (4) |
| Mississippi: | 0.4% (268) |
| Blue Mountain: | 11.8% (4) |
| Mississippi: | 1.4% (941) |
| Blue Mountain: | 2.9% (1) |
| Mississippi: | 0.4% (257) |
Place of birth for U.S.-born residents:
- This state: 832
- Other state: 225
- Northeast: 18
- Midwest: 19
- South: 157
- West: 30
90.7% of Blue Mountain residents lived in the same house 1 years ago.
Out of people who lived in different houses, 13.2% lived in this county.
Out of people who lived in different counties, 65.2% lived in Mississippi.
| Blue Mountain: | 90.7% |
| State average: | 88.9% |
Education attainment for males 25 years and older:
- No schooling: 0
- Nursery to 4th grade: 0
- 5th and 6th grade: 3
- 7th and 8th grade: 14
- 9th grade: 0
- 10th grade: 1
- 11th grade: 40
- 12th grade, no diploma: 6
- High school graduate (or equivalency): 77
- Less than 1 year of college: 5
- Some college more than 1 year, no degree: 39
- Associate degree: 8
- Bachelor's degree: 6
- Master's degree: 12
- Professional school degree: 0
- Doctorate degree: 0

Education attainment for females 25 years and older:
- No schooling: 1
- Nursery to 4th grade: 0
- 5th and 6th grade: 9
- 7th and 8th grade: 4
- 9th grade: 20
- 10th grade: 10
- 11th grade: 6
- 12th grade, no diploma: 4
- High school graduate (or equivalency): 117
- Less than 1 year of college: 10
- Some college more than 1 year, no degree: 21
- Associate degree: 5
- Bachelor's degree: 16
- Master's degree: 27
- Professional school degree: 9
- Doctorate degree: 0


Housing units in structures:
- One, detached: 286
- Two: 7
- 3 or 4: 20
- 5 to 9: 8
- 20 to 49: 3
- Mobile homes: 33
Median worth of mobile homes: $101,352
Housing units lacking complete kitchen facilities in 2022: 5.1%
House/condo owner moved in on average 21 years ago
Renter moved in on average 5 years ago

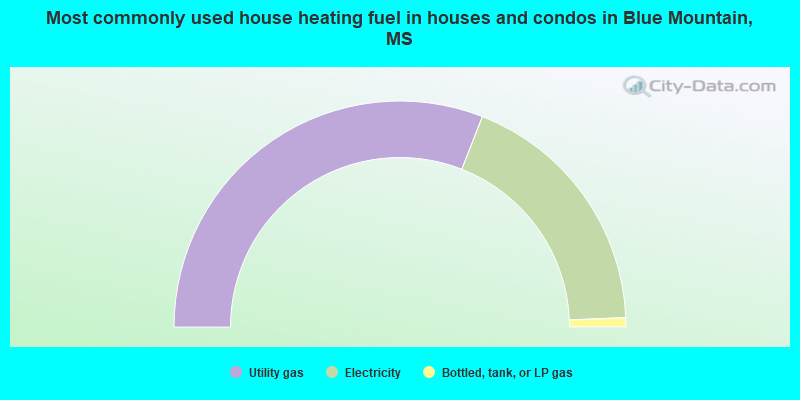
- 61.9%Utility gas
- 36.8%Electricity
- 1.3%Bottled, tank, or LP gas
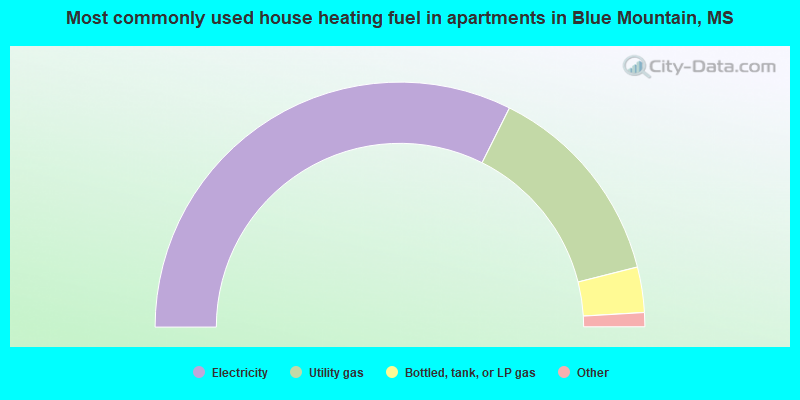
- 66.0%Electricity
- 27.9%Utility gas
- 6.1%Bottled, tank, or LP gas
Private vs. public school enrollment:
| Here: | 0.0% |
| Mississippi: | 16.1% |
| Here: | 15.0% |
| Mississippi: | 14.6% |
| Here: | 45.8% |
| Mississippi: | 12.8% |


