Blue Ridge, TX (Texas) Houses and Residents
| Blue Ridge: | $213,440 |
| Texas: | $275,400 |
Mean price in 2022:
Detached houses: $199,734
Here: $199,734 State: $369,058 Mobile homes: $256,010
Here: $256,010 State: $124,413
Total population: 842 (Urban population: 0, Rural population: 661 (all nonfarm))
Houses: 374 (336 occupied: 267 owner occupied, 71 renter occupied)
| % of renters here: | 21% |
| State: | 38% |
Housing density: 567 houses/condos per square mile
Median price asked for vacant for-sale houses and condos in 2022: $719,583.
Median contract rent in 2022: $1,059 (lower quartile is $735, upper quartile is $1,191)
Median rent asked for vacant for-rent units in 2022: $811
Median gross rent in Blue Ridge, TX in 2022: $1,295
Housing units in Blue Ridge with a mortgage: 158 (4 second mortgage, 0 home equity loan, 5 both second mortgage and home equity loan)
Houses without a mortgage: 0
Median household income for houses/condos with a mortgage: $120,503
Median household income for apartments without a mortgage: $51,542
Median monthly housing costs: $1,262
Compare current foreclosures near Blue Ridge, TX:
| Photo | Address | Area | Beds / Baths | Price | Details |
|---|---|---|---|---|---|

|
#1
Ridgeway Dr
Blue Ridge, TX 75424
|
1,426 sq. feet
|
2 baths 4 beds |
show details | |

|
#2
Scott Rd
Blue Ridge, TX 75424
|
- sq. feet
|
- baths - beds |
show details | |

|
#3
County Road 633
Blue Ridge, TX 75424
|
2,798 sq. feet
|
- baths - beds |
show details | |

|
#4
The Trails Dr
Blue Ridge, TX 75424
|
- sq. feet
|
- baths - beds |
show details | |

|
#5
Canyon View Ct
Mckinney, TX 75071
|
1,903 sq. feet
|
2 baths 3 beds |
show details | |

|
#6
Cherry Ln
Mckinney, TX 75071
|
- sq. feet
|
3 baths 4 beds |
show details | |

|
#7
Meadow Trl
Princeton, TX 75407
|
2,044 sq. feet
|
2 baths 5 beds |
show details | |

|
#8
Peachtree Ln
Mckinney, TX 75070
|
- sq. feet
|
2 baths 3 beds |
show details | |

|
#9
Rockport Dr
Mckinney, TX 75071
|
1,665 sq. feet
|
2 baths 3 beds |
show details | |

|
#10
Rochdale Dr
Anna, TX 75409
|
3,701 sq. feet
|
2 baths 5 beds |
show details |
| Photo | Address | Area | Beds / Baths | Price | Details |
|---|---|---|---|---|---|

|
#11
County Road 439
Princeton, TX 75407
|
1,596 sq. feet
|
2 baths 3 beds |
show details | |

|
#12
Chatsworth Dr
Anna, TX 75409
|
- sq. feet
|
2 baths 4 beds |
show details | |

|
#13
Indigo Rd
Princeton, TX 75407
|
- sq. feet
|
3 baths 4 beds |
show details | |

|
#14
Meadow View Dr
Princeton, TX 75407
|
1,936 sq. feet
|
2 baths 3 beds |
show details | |

|
#15
Cross Timbers Dr
Mckinney, TX 75069
|
2,433 sq. feet
|
2 baths 3 beds |
show details | |

|
#16
Oak Creek Dr
Mckinney, TX 75071
|
2,144 sq. feet
|
2 baths 2 beds |
show details | |

|
#17
Terrace View Dr
Mckinney, TX 75071
|
2,989 sq. feet
|
3 baths 3 beds |
show details | |

|
#18
Bonnie Ct
Anna, TX 75409
|
1,222 sq. feet
|
2 baths 3 beds |
show details | |

|
#19
Live Oak Dr
Anna, TX 75409
|
1,789 sq. feet
|
2 baths 3 beds |
show details | |

|
#20
Athabasca Falls Dr
Anna, TX 75409
|
2,696 sq. feet
|
2 baths 4 beds |
show details |
| Photo | Address | Area | Beds / Baths | Price | Details |
|---|---|---|---|---|---|

|
#21
Scarlet Vw
Anna, TX 75409
|
1,748 sq. feet
|
2 baths 4 beds |
show details | |

|
#22
Windham Dr
Van Alstyne, TX 75495
|
2,075 sq. feet
|
2 baths 3 beds |
show details | |

|
#23
County Road 865
Princeton, TX 75407
|
1,820 sq. feet
|
2 baths 3 beds |
show details | |

|
#24
Meadow Lark Ln
Anna, TX 75409
|
1,725 sq. feet
|
2 baths 4 beds |
show details | |

|
#25
Buffalo Bill Dr
Anna, TX 75409
|
3,770 sq. feet
|
3 baths 5 beds |
show details | |

|
#26
Acacia Dr
Anna, TX 75409
|
2,133 sq. feet
|
2 baths 3 beds |
show details | |

|
#27
Parkplace Rdg
Princeton, TX 75407
|
3,016 sq. feet
|
2 baths 3 beds |
show details | |

|
#28
Bill Wright Rd
Princeton, TX 75407
|
1,767 sq. feet
|
2 baths 3 beds |
show details | |

|
#29
Quail View Dr
Mckinney, TX 75071
|
2,388 sq. feet
|
2 baths 3 beds |
show details | |

|
#30
Bluff Creek Ln
Mckinney, TX 75071
|
3,312 sq. feet
|
2 baths 4 beds |
show details |
| Photo | Address | Area | Beds / Baths | Price | Details |
|---|---|---|---|---|---|

|
#31
Beechwood Ln
Mckinney, TX 75069
|
5,526 sq. feet
|
4 baths 5 beds |
show details | |

|
#32
Sunnyside Dr
Mckinney, TX 75071
|
3,396 sq. feet
|
3 baths 5 beds |
show details | |

|
#33
Slalom Dr
Mckinney, TX 75071
|
1,786 sq. feet
|
2 baths 3 beds |
show details | |

|
#34
Sprucewood Dr
Mckinney, TX 75071
|
3,505 sq. feet
|
4 baths 5 beds |
show details | |

|
#35
Purdue Dr
Allen, TX 75002
|
4,618 sq. feet
|
4 baths 4 beds |
show details | |

|
#36
Purdue Dr
Allen, TX 75002
|
4,618 sq. feet
|
4 baths 4 beds |
show details | |

|
#37
Gregory Dr
Mckinney, TX 75071
|
2,983 sq. feet
|
2 baths 4 beds |
show details | |

|
#38
Stacy Rd
Mckinney, TX 75069
|
2,537 sq. feet
|
3 baths 4 beds |
show details | |

|
#39
Berry Hl
Mckinney, TX 75069
|
1,468 sq. feet
|
2 baths 3 beds |
show details | |

|
#40
Collier Dr
Mckinney, TX 75071
|
2,695 sq. feet
|
3 baths 4 beds |
show details |
| Photo | Address | Area | Beds / Baths | Price | Details |
|---|---|---|---|---|---|

|
#41
Clear Brook Dr
Mckinney, TX 75071
|
1,659 sq. feet
|
2 baths 3 beds |
show details | |

|
#42
Shaker Run
Mckinney, TX 75069
|
2,144 sq. feet
|
2 baths 4 beds |
show details | |

|
#43
Kimbrough Ln
Mckinney, TX 75071
|
1,906 sq. feet
|
2 baths 4 beds |
show details | |

|
#44
Hyde Park Dr
Mckinney, TX 75069
|
1,323 sq. feet
|
2 baths 3 beds |
show details | |

|
#45
Douglas Dr
Mckinney, TX 75071
|
1,651 sq. feet
|
2 baths 3 beds |
show details | |

|
#46
Pine St
Mckinney, TX 75069
|
1,306 sq. feet
|
1 baths 3 beds |
show details | |

|
#47
High Pointe Blvd
Mckinney, TX 75071
|
2,203 sq. feet
|
2 baths 4 beds |
show details | |

|
#48
Bamboo Dr
Anna, TX 75409
|
1,786 sq. feet
|
2 baths 3 beds |
show details | |

|
#49
Summit Dr
Mckinney, TX 75071
|
2,267 sq. feet
|
2 baths 3 beds |
show details | |

|
Check over 1 million property listings on Foreclosure.com!
|
browse all offers | |||


 | Why so many homes for sale in Shadow Creek Ranch? (20 replies) |
| Crystal Ball...Collin County (47 replies) |
| What Gives? Why is it so difficult to rent a house in the Midland/Odessa area? (94 replies) |
| Recently Relocated North Carolinians (28 replies) |
| New Lanes Open on I-10 EB (79 replies) |
| Southside, Pearland, Sugar Land? (42 replies) |

Median year apartment built: 1988
Household type by relationship:
Households: 1,054- Male householders: 165 (24 living alone), Female householders: 171 (35 living alone)
163 spouses (163 opposite-sex spouses), 54 unmarried partners, (54 opposite-sex unmarried partners), 359 children (317 natural, 0 adopted, 41 stepchildren), 33 grandchildren, 18 brothers or sisters, 25 parents, 0 foster children, 31 other relatives, 31 non-relatives
Size of family households: 96 2-persons, 47 3-persons, 65 4-persons, 19 5-persons, 18 6-persons, 16 7-or-more-persons.
Size of nonfamily households: 64 1-person, 7 2-persons, 1 3-persons.
93 married couples with children.
121 single-parent households (69 men, 52 women).
79.7% of residents of Blue Ridge speak English at home.
18.2% of residents speak Spanish at home (74% speak English very well, 14% speak English well, 9% speak English not well, 3% don't speak English at all).
0.5% of residents speak other Indo-European language at home (100% speak English very well).
0.3% of residents speak Asian or Pacific Island language at home (100% speak English very well).
Foreign born population: 99 (9.4%)
(50.5% of them are naturalized citizens)
| Here: | 5.5 |
| State: | 6.3 |
| Here: | 4.1 |
| State: | 4.0 |

- Bedrooms in owner-occupied houses and condos in Blue Ridge, Texas
- 0no bedroom
- 01 bedroom
- 712 bedrooms
- 1653 bedrooms
- 294 bedrooms
- 25+ bedrooms

- Bedrooms in renter-occupied apartments in Blue Ridge, Texas
- 0no bedroom
- 51 bedroom
- 392 bedrooms
- 273 bedrooms
- 04 bedrooms
- 05+ bedrooms

- Cars and other vehicles available in Blue Ridge in owner-occupied houses/condos
- 0no vehicle
- 701 vehicle
- 1022 vehicles
- 593 vehicles
- 284 vehicles
- 95+ vehicles

- Cars and other vehicles available in Blue Ridge in renter-occupied apartments
- 0no vehicle
- 211 vehicle
- 392 vehicles
- 93 vehicles
- 34 vehicles
- 05+ vehicles

- Rooms in owner-occupied houses in Blue Ridge, Texas
- 01 room
- 02 rooms
- 53 rooms
- 374 rooms
- 965 rooms
- 686 rooms
- 457 rooms
- 68 rooms
- 109+ rooms

- Rooms in renter-occupied apartments in Blue Ridge, Texas
- 01 room
- 52 rooms
- 63 rooms
- 264 rooms
- 145 rooms
- 06 rooms
- 197 rooms
- 08 rooms
- 09+ rooms


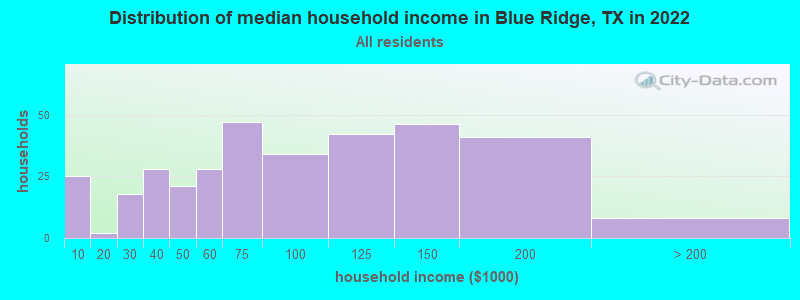
Blue Ridge, TX household income distribution

- 25Less than $10,000
- 2$10,000 to $19,999
- 18$20,000 to $29,999
- 28$30,000 to $39,999
- 21$40,000 to $49,999
- 28$50,000 to $59,999
- 47$60,000 to $74,999
- 34$75,000 to $99,999
- 42$100,000 to $124,999
- 46$125,000 to $149,999
- 41$150,000 to $199,999
- 8$200,000 or more
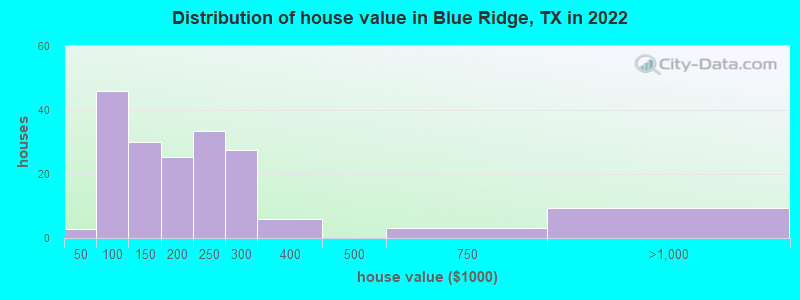
Home value of owner - occupied houses in 2022 in Blue Ridge, TX
-
- 2$20,000 to $24,999
- 14$50,000 to $59,999
- 1$60,000 to $69,999
- 21$70,000 to $79,999
- 7$80,000 to $89,999
- 25$100,000 to $124,999
- 4$125,000 to $149,999
- 10$150,000 to $174,999
- 14$175,000 to $199,999
- 33$200,000 to $249,999
- 27$250,000 to $299,999
- 5$300,000 to $399,999
- 2$500,000 to $749,999
- 9$750,000 to $999,999
Rent paid by renters in 2022 in Blue Ridge, TX
-
- 2$400 to $449
- 9$550 to $599
- 1$650 to $699
- 2$700 to $749
- 12$900 to $999
- 24$1,000 to $1,249
- 1$1,250 to $1,499
- 5$1,500 to $1,999


Percentage of workers working in this county: 84.9%
Number of people working at home: 64 (11.5% of all workers)
Travel time to work (commute)
- Less than 5 minutes: 17
- 5 to 9 minutes: 32
- 10 to 14 minutes: 14
- 15 to 19 minutes: 23
- 20 to 24 minutes: 83
- 25 to 29 minutes: 38
- 30 to 34 minutes: 79
- 35 to 39 minutes: 14
- 40 to 44 minutes: 50
- 45 to 59 minutes: 58
- 60 to 89 minutes: 24
- 90 or more minutes: 18
Means of transportation to work:
- Drove a car alone: 210 (76.9%)
- Carpooled: 50 (18.3%)
- Walked: 5 (1.8%)
- Worked at home: 8 (2.9%)

- Unemployment by race in 2022
- Unemployment rate for White non-Hispanic residents
- 0.8%Males
- 6.5%Females

- Year of entry for the foreign-born population in Blue Ridge, Texas
- 212010 or later
- 412000 to 2009
- 231990 to 1999
- 01980 to 1989
- 41970 to 1979
- 0Before 1970

First ancestries reported:
- American: 235 (38.8%)
- English: 37 (6.1%)
- Irish: 36 (5.9%)
- German: 24 (4.0%)
- European: 14 (2.3%)
- Scottish: 9 (1.5%)
- French: 6 (1.0%)
- Italian: 4 (0.7%)
- Scotch-Irish: 2 (0.3%)
- Belgian: 1 (0.2%)
Most common places of birth for foreign-born residents (%):
| Blue Ridge: | 64.9% (61) |
| Texas: | 48.4% (2,411,723) |
| Blue Ridge: | 18.1% (17) |
| Texas: | 0.1% (7,230) |
| Blue Ridge: | 3.2% (3) |
| Texas: | 2.1% (103,148) |
| Blue Ridge: | 3.2% (3) |
| Texas: | 4.5% (224,455) |
| Blue Ridge: | 2.1% (2) |
| Texas: | 1.8% (87,382) |
| Blue Ridge: | 2.1% (2) |
| Texas: | 1.2% (61,555) |
Place of birth for U.S.-born residents:
- This state: 773
- Other state: 167
- Northeast: 0
- Midwest: 34
- South: 70
- West: 65
91.3% of Blue Ridge residents lived in the same house 1 years ago.
Out of people who lived in different houses, 28.6% lived in this county.
Out of people who lived in different counties, 49.1% lived in Texas.
| Blue Ridge: | 91.3% |
| State average: | 85.7% |
Education attainment for males 25 years and older:
- No schooling: 14
- Nursery to 4th grade: 0
- 5th and 6th grade: 3
- 7th and 8th grade: 2
- 9th grade: 8
- 10th grade: 10
- 11th grade: 13
- 12th grade, no diploma: 2
- High school graduate (or equivalency): 136
- Less than 1 year of college: 20
- Some college more than 1 year, no degree: 50
- Associate degree: 34
- Bachelor's degree: 23
- Master's degree: 2
- Professional school degree: 2
- Doctorate degree: 0

Education attainment for females 25 years and older:
- No schooling: 5
- Nursery to 4th grade: 3
- 5th and 6th grade: 3
- 7th and 8th grade: 18
- 9th grade: 5
- 10th grade: 8
- 11th grade: 4
- 12th grade, no diploma: 0
- High school graduate (or equivalency): 99
- Less than 1 year of college: 22
- Some college more than 1 year, no degree: 49
- Associate degree: 35
- Bachelor's degree: 59
- Master's degree: 8
- Professional school degree: 0
- Doctorate degree: 0


Housing units in structures:
- One, detached: 278
- One, attached: 12
- Two: 17
- Mobile homes: 65
Median worth of mobile homes: $175,023
House/condo owner moved in on average 10 years ago
Renter moved in on average 1 years ago

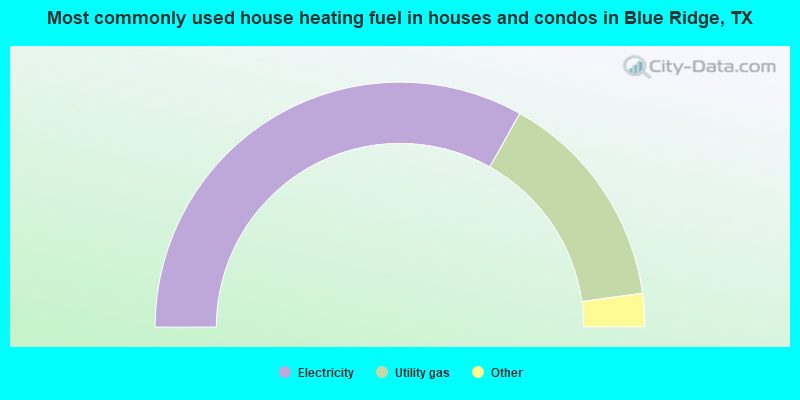
- 66.5%Electricity
- 29.4%Utility gas
- 3.6%Bottled, tank, or LP gas
- 0.4%No fuel used
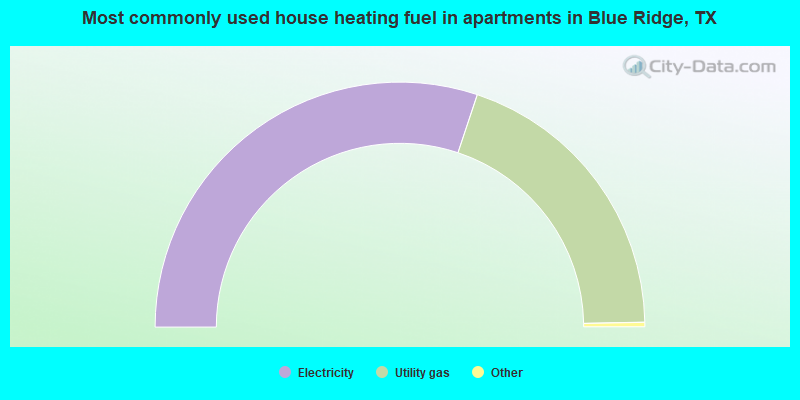
- 60.6%Electricity
- 39.4%Utility gas
Private vs. public school enrollment:
| Here: | 0.8% |
| Texas: | 8.8% |
| Here: | 0.0% |
| Texas: | 8.0% |
| Here: | 0.0% |
| Texas: | 16.2% |


