Bolton, CT (Connecticut) Houses and Residents
| Bolton: | $376,602 |
| Connecticut: | $347,200 |
Total population: 4,980 (Urban population: 4,069, Rural population: 948 (all nonfarm))
Houses: 1,969 (1,906 occupied: 1,627 owner occupied, 279 renter occupied)
| % of renters here: | 15% |
| State: | 34% |
Housing density: 137 houses/condos per square mile
Median price asked for vacant for-sale houses and condos in 2022 in this county: $251,692.
Median contract rent in 2022: $1,167 (lower quartile is $1,053, upper quartile is $1,533)
Median rent asked for vacant for-rent units in 2022: $1,230
Median gross rent in Bolton, CT in 2022: $1,346
Housing units in Bolton with a mortgage: 1,149 (95 second mortgage, 173 home equity loan, 0 both second mortgage and home equity loan)
Houses without a mortgage: 397
Compare current foreclosures near Bolton, CT:
| Photo | Address | Area | Beds / Baths | Price | Details |
|---|---|---|---|---|---|

|
#1
Llynwood Dr
Bolton, CT 06043
|
1,335 sq. feet
|
1 baths 4 beds |
show details | |

|
#2
School Rd
Bolton, CT 06043
|
2,024 sq. feet
|
2 baths 4 beds |
show details | |

|
#3
Kozley Rd
Tolland, CT 06084
|
1,132 sq. feet
|
2 baths 3 beds |
$264,900
|
show details |

|
#4
Tolland Ave
Stafford Springs, CT 06076
|
896 sq. feet
|
1 baths 3 beds |
$100,000
|
show details |

|
#5
Reservoir Rd
Vernon Rockville, CT 06066
|
1,288 sq. feet
|
2 baths 3 beds |
$379,900
|
show details |

|
#6
Newberry Rd
South Windsor, CT 06074
|
3,386 sq. feet
|
2 baths 4 beds |
$649,900
|
show details |

|
#7
Mountain Rd
Windsor, CT 06095
|
1,144 sq. feet
|
2 baths 3 beds |
$230,000
|
show details |

|
#8
Winthrop Blvd
Cromwell, CT 06416
|
1,092 sq. feet
|
1 baths 3 beds |
$220,000
|
show details |

|
#9
Irving St
Manchester, CT 06042
|
1,335 sq. feet
|
2 baths 3 beds |
$251,750
|
show details |

|
#10
Shares Ln
South Windsor, CT 06074
|
1,850 sq. feet
|
2 baths 4 beds |
$365,000
|
show details |
| Photo | Address | Area | Beds / Baths | Price | Details |
|---|---|---|---|---|---|

|
#11
High St
South Windsor, CT 06074
|
1,338 sq. feet
|
2 baths 3 beds |
show details | |

|
#12
Park Rd
Marlborough, CT 06447
|
1,134 sq. feet
|
1 baths 3 beds |
show details | |

|
#13
Bell Ct Apt C1
East Hartford, CT 06108
|
890 sq. feet
|
1 baths 2 beds |
show details | |

|
#14
Cheshire St
Hartford, CT 06114
|
3,279 sq. feet
|
2 baths 4 beds |
show details | |

|
#15
Hope Valley Rd
Amston, CT 06231
|
2,128 sq. feet
|
2 baths 3 beds |
show details | |

|
#16
Holbrook Ave
Willimantic, CT 06226
|
1,536 sq. feet
|
2 baths 4 beds |
show details | |

|
#17
Mansfield Ave
Willimantic, CT 06226
|
920 sq. feet
|
1 baths 3 beds |
show details | |

|
#18
Saville St
Windsor, CT 06095
|
1,181 sq. feet
|
2 baths 3 beds |
show details | |

|
#19
Circle Dr
Mansfield Center, CT 06250
|
1,152 sq. feet
|
1 baths 3 beds |
show details | |

|
#20
Mountain Rd
Colchester, CT 06415
|
3,158 sq. feet
|
3 baths 3 beds |
show details |
| Photo | Address | Area | Beds / Baths | Price | Details |
|---|---|---|---|---|---|

|
#21
Jones Hollow Rd
Marlborough, CT 06447
|
1,984 sq. feet
|
2 baths 3 beds |
show details | |

|
#22
Hollister Dr
East Hartford, CT 06118
|
1,300 sq. feet
|
1 baths 3 beds |
show details | |

|
#23
Cornwall St
Hartford, CT 06112
|
1,248 sq. feet
|
1 baths 3 beds |
show details | |

|
#24
Park Ave
Windsor, CT 06095
|
969 sq. feet
|
2 baths 3 beds |
show details | |

|
#25
Columbia Rd
Enfield, CT 06082
|
996 sq. feet
|
1 baths 3 beds |
show details | |

|
#26
Richard St Apt 2
Newington, CT 06111
|
710 sq. feet
|
1 baths 1 beds |
show details | |

|
#27
New London Rd
Colchester, CT 06415
|
1,938 sq. feet
|
3 baths 3 beds |
show details | |

|
#28
Dillenback Rd
Somers, CT 06071
|
3,358 sq. feet
|
3 baths 4 beds |
show details | |

|
#29
Robbins Ave
Newington, CT 06111
|
1,346 sq. feet
|
2 baths 3 beds |
show details | |

|
#30
Harvest Ln
Windsor, CT 06095
|
1,322 sq. feet
|
2 baths 3 beds |
show details |
| Photo | Address | Area | Beds / Baths | Price | Details |
|---|---|---|---|---|---|

|
#31
Glendale Cir
Windsor Locks, CT 06096
|
1,277 sq. feet
|
1 baths 2 beds |
show details | |

|
#32
Main St
Newington, CT 06111
|
1,880 sq. feet
|
1 baths 3 beds |
show details | |

|
#33
Cedarwood Ln
Newington, CT 06111
|
2,111 sq. feet
|
1 baths 2 beds |
show details | |

|
#34
Donahue Ln # 1
Manchester, CT 06042
|
1,240 sq. feet
|
1 baths 2 beds |
show details | |

|
#35
Willimantic Rd
Chaplin, CT 06235
|
2,332 sq. feet
|
3 baths 5 beds |
show details | |

|
#36
Main St
Somers, CT 06071
|
3,092 sq. feet
|
2 baths 3 beds |
show details | |

|
#37
Litchfield Dr
Enfield, CT 06082
|
1,404 sq. feet
|
1 baths 4 beds |
show details | |

|
#38
Dennis Ln
Stafford Springs, CT 06076
|
1,171 sq. feet
|
2 baths 3 beds |
show details | |

|
#39
Butternut Ln
Rocky Hill, CT 06067
|
1,176 sq. feet
|
1 baths 2 beds |
show details | |

|
#40
Broadview Ter
Hartford, CT 06106
|
1,821 sq. feet
|
2 baths 7 beds |
show details |
| Photo | Address | Area | Beds / Baths | Price | Details |
|---|---|---|---|---|---|

|
#41
Parents Way
Bloomfield, CT 06002
|
1,230 sq. feet
|
3 baths 4 beds |
show details | |

|
#42
Thompson Rd # 2g
Manchester, CT 06040
|
734 sq. feet
|
1 baths 1 beds |
show details | |

|
#43
Mathewson Ave
Enfield, CT 06082
|
1,666 sq. feet
|
2 baths 4 beds |
show details | |

|
#44
Greenwood Dr
Manchester, CT 06042
|
750 sq. feet
|
1 baths 2 beds |
show details | |

|
#45
Summer St
Manchester, CT 06040
|
2,418 sq. feet
|
2 baths 6 beds |
show details | |

|
#46
Lacava Ln
Wethersfield, CT 06109
|
2,306 sq. feet
|
2 baths 4 beds |
show details | |

|
#47
Westbrook Rd
Rocky Hill, CT 06067
|
1,239 sq. feet
|
1 baths 2 beds |
show details | |

|
#48
Ridge Rd
Wethersfield, CT 06109
|
2,062 sq. feet
|
1 baths 3 beds |
show details | |

|
#49
Branford St
Hartford, CT 06112
|
1,764 sq. feet
|
1 baths 3 beds |
show details | |

|
Check over 1 million property listings on Foreclosure.com!
|
browse all offers | |||
Latest news about housing in Bolton, CT collected exclusively by city-data.com from local newspapers, TV, and radio stations

 | Current Real estate markets (3987 replies) |
| Old Colonial Homes/Country Living/Schools in CT (58 replies) |
| Why are Manchester Housing Prices so low? (94 replies) |
| 2024 Connecticut Town Tournament VI (Celebrating the 10-Year Anniversary & Dazzleman's Memorial) (1007 replies) |
| Returning to Hartford Area, any suggestions for a home? (19 replies) |
| Lakefront home near Plainfield (17 replies) |

Household type by relationship:
Households: 136,574- In family households: 112,649 (26,574 male householders, 10,133 female householders)
29,922 spouses, 38,844 children (36,460 natural, 1,015 adopted, 1,369 stepchildren), 1,606 grandchildren, 688 brothers or sisters, 931 parents, foster children, 693 other relatives, 2,519 non-relatives
- In nonfamily households: 23,925 (8,485 male householders (5,980 living alone)), 9,285 female householders (7,198 living alone)), 6,155 nonrelatives
- In group quarters: 16,117 (4,028 institutionalized population)
24,754 married couples with children.
5,247 single-parent households (1,309 men, 3,938 women).
89.1% of residents of Bolton speak English at home.
1.4% of residents speak Spanish at home (83% speak English very well, 9% speak English well, 8% speak English not well).
8.8% of residents speak other Indo-European language at home (62% speak English very well, 32% speak English well, 5% speak English not well).
0.6% of residents speak Asian or Pacific Island language at home (57% speak English very well, 43% speak English not well).
0.1% of residents speak other language at home (100% speak English very well).
Foreign born population: 481 (8.9%)
(80.2% of them are naturalized citizens)
| Here: | 6.5 |
| State: | 6.5 |
| Here: | 3.1 |
| State: | 4.0 |

- Bedrooms in owner-occupied houses and condos in Bolton, Connecticut
- 0no bedroom
- 421 bedroom
- 2072 bedrooms
- 9163 bedrooms
- 4164 bedrooms
- 465+ bedrooms

- Bedrooms in renter-occupied apartments in Bolton, Connecticut
- 0no bedroom
- 1421 bedroom
- 832 bedrooms
- 343 bedrooms
- 154 bedrooms
- 55+ bedrooms

- Cars and other vehicles available in Bolton in owner-occupied houses/condos
- 33no vehicle
- 2621 vehicle
- 8042 vehicles
- 3723 vehicles
- 1244 vehicles
- 325+ vehicles

- Cars and other vehicles available in Bolton in renter-occupied apartments
- 0no vehicle
- 1791 vehicle
- 752 vehicles
- 253 vehicles
- 04 vehicles
- 05+ vehicles

- Rooms in owner-occupied houses in Bolton, Connecticut
- 01 room
- 02 rooms
- 133 rooms
- 624 rooms
- 2365 rooms
- 3936 rooms
- 4767 rooms
- 2658 rooms
- 1829+ rooms

- Rooms in renter-occupied apartments in Bolton, Connecticut
- 01 room
- 52 rooms
- 973 rooms
- 914 rooms
- 265 rooms
- 386 rooms
- 127 rooms
- 08 rooms
- 109+ rooms


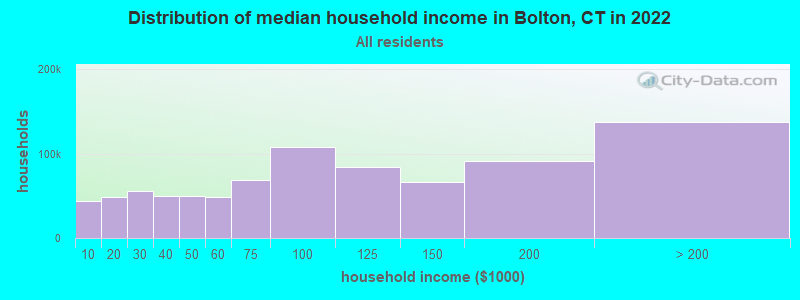
Bolton, CT household income distribution

- 73,816Less than $10,000
- 84,305$10,000 to $19,999
- 94,242$20,000 to $29,999
- 82,897$30,000 to $39,999
- 83,381$40,000 to $49,999
- 80,728$50,000 to $59,999
- 110,216$60,000 to $74,999
- 173,360$75,000 to $99,999
- 132,305$100,000 to $124,999
- 105,550$125,000 to $149,999
- 143,550$150,000 to $199,999
- 208,673$200,000 or more
Percentage of workers working in this county: 25.1%
Number of people working at home: 502 (16.0% of all workers)
Travel time to work (commute)
- Less than 5 minutes: 81
- 5 to 9 minutes: 191
- 10 to 14 minutes: 298
- 15 to 19 minutes: 381
- 20 to 24 minutes: 692
- 25 to 29 minutes: 259
- 30 to 34 minutes: 400
- 35 to 39 minutes: 125
- 40 to 44 minutes: 97
- 45 to 59 minutes: 73
- 60 to 89 minutes: 52
- 90 or more minutes: 41
Means of transportation to work:
- Drove a car alone: 2,479 (88.2%)
- Carpooled: 149 (5.3%)
- Bus or trolley bus: 15 (0.5%)
- Walked: 47 (1.7%)
- Worked at home: 120 (4.3%)


- Year of entry for the foreign-born population in Bolton, Connecticut
- 211995 to March 2000
- 331990 to 1994
- 681985 to 1989
- 191980 to 1984
- 441975 to 1979
- 191970 to 1974
- 311965 to 1969
- 75Before 1965

First ancestries reported:
- Italian: 1,124 (16.7%)
- Irish: 1,083 (16.1%)
- English: 922 (13.7%)
- Other: 562 (8.4%)
- German: 559 (8.3%)
- Polish: 517 (7.7%)
- French: 450 (6.7%)
- United States: 232 (3.5%)
- French Canadian: 212 (3.2%)
- Swedish: 193 (2.9%)
- Scottish: 123 (1.8%)
- Portuguese: 110 (1.6%)
- Scotch-Irish: 103 (1.5%)
- Lithuanian: 80 (1.2%)
- Greek: 59 (0.9%)
- Norwegian: 58 (0.9%)
- Welsh: 55 (0.8%)
- Danish: 52 (0.8%)
- Arab: 51 (0.8%)
- Ukrainian: 51 (0.8%)
- Dutch: 45 (0.7%)
- Czech: 22 (0.3%)
- Hungarian: 20 (0.3%)
- Russian: 18 (0.3%)
- West Indian: 7 (0.1%)
- Slovak: 5 (0.07%)
Most common places of birth for foreign-born residents (%):
| Bolton: | 12.9% (40) |
| Connecticut: | 7.0% (26,023) |
| Bolton: | 12.3% (38) |
| Connecticut: | 5.2% (19,083) |
| Bolton: | 10.3% (32) |
| Connecticut: | 3.6% (13,234) |
| Bolton: | 9.7% (30) |
| Connecticut: | 6.9% (25,507) |
| Bolton: | 9.7% (30) |
| Connecticut: | 1.5% (5,508) |
| Bolton: | 8.7% (27) |
| Connecticut: | 2.1% (7,596) |
| Bolton: | 8.1% (25) |
| Connecticut: | 4.4% (16,395) |
| Bolton: | 4.8% (15) |
| Connecticut: | 1.0% (3,822) |
| Bolton: | 4.5% (14) |
| Connecticut: | 0.9% (3,317) |
| Bolton: | 2.6% (8) |
| Connecticut: | 1.7% (6,247) |
| Bolton: | 2.6% (8) |
| Connecticut: | 1.1% (3,919) |
| Bolton: | 2.3% (7) |
| Connecticut: | 2.5% (9,358) |
| Bolton: | 2.3% (7) |
| Connecticut: | 0.3% (1,110) |
| Bolton: | 2.3% (7) |
| Connecticut: | 0.5% (2,025) |
| Bolton: | 1.9% (6) |
| Connecticut: | 1.4% (5,021) |
| Bolton: | 1.9% (6) |
| Connecticut: | 0.3% (1,286) |
| Bolton: | 1.6% (5) |
| Connecticut: | 1.2% (4,344) |
| Bolton: | 1.6% (5) |
| Connecticut: | 0.4% (1,303) |
Place of birth for U.S.-born residents:
- This state: 3,348
- Other state: 1,293
- Northeast: 943
- Midwest: 120
- South: 104
- West: 126
65% of Bolton residents lived in the same house 5 years ago.
Out of people who lived in different houses, 34% lived in this county.
Out of people who lived in different counties, 83% lived in Connecticut.
Education attainment for males 25 years and older:
- No schooling: 0
- Nursery to 4th grade: 0
- 5th and 6th grade: 6
- 7th and 8th grade: 22
- 9th grade: 29
- 10th grade: 26
- 11th grade: 5
- 12th grade, no diploma: 25
- High school graduate (or equivalency): 474
- Less than 1 year of college: 70
- Some college more than 1 year, no degree: 228
- Associate degree: 121
- Bachelor's degree: 313
- Master's degree: 259
- Professional school degree: 69
- Doctorate degree: 21

Education attainment for females 25 years and older:
- No schooling: 11
- Nursery to 4th grade: 0
- 5th and 6th grade: 4
- 7th and 8th grade: 19
- 9th grade: 10
- 10th grade: 25
- 11th grade: 0
- 12th grade, no diploma: 24
- High school graduate (or equivalency): 487
- Less than 1 year of college: 130
- Some college more than 1 year, no degree: 251
- Associate degree: 202
- Bachelor's degree: 392
- Master's degree: 142
- Professional school degree: 41
- Doctorate degree: 22


Housing units in structures:
- One, detached: 1,763
- One, attached: 16
- Two: 27
- 3 or 4: 44
- 5 to 9: 65
- 10 to 19: 23
- 20 to 49: 18
- Mobile homes: 13

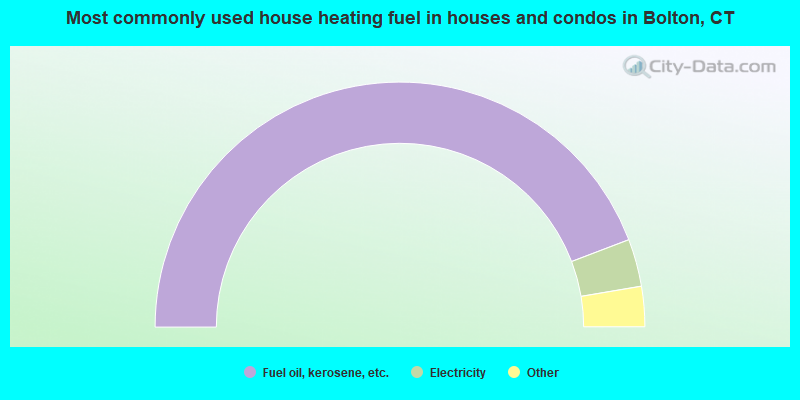
- 88.4%Fuel oil, kerosene, etc.
- 6.3%Electricity
- 2.9%Wood
- 1.6%Bottled, tank, or LP gas
- 0.4%Utility gas
- 0.4%Coal or coke
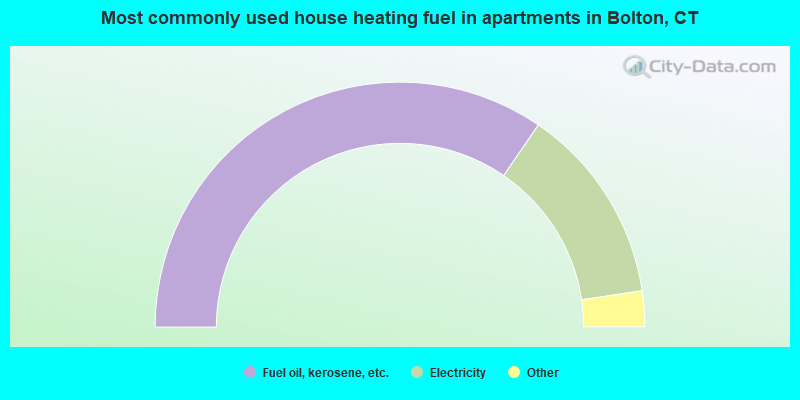
- 69.2%Fuel oil, kerosene, etc.
- 26.2%Electricity
- 2.5%Bottled, tank, or LP gas
- 2.2%Utility gas
Private vs. public school enrollment:
| Here: | 4.3% |
| Connecticut: | 9.9% |
| Here: | 15.7% |
| Connecticut: | 11.0% |
| Here: | 27.9% |
| Connecticut: | 33.4% |


