Bonham, TX (Texas) Houses and Residents
| Bonham: | $156,099 |
| Texas: | $275,400 |
Mean price in 2022:
Detached houses: $171,439
Here: $171,439 State: $369,058 Mobile homes: $61,766
Here: $61,766 State: $124,413
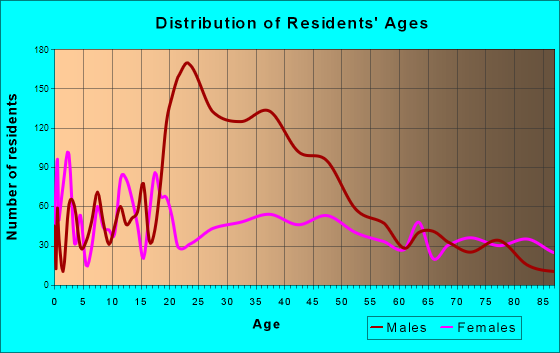
Total population: 10,058 (Urban population: 9,578 (all inside urban clusters), Rural population: 368 (15 farm, 353 nonfarm))
Houses: 3,672 (3,199 occupied: 1,958 owner occupied, 1,289 renter occupied)
| % of renters here: | 40% |
| State: | 38% |
Housing density: 392 houses/condos per square mile
Median price asked for vacant for-sale houses and condos in 2022: $180,232.
Median contract rent in 2022: $833 (lower quartile is $583, upper quartile is $1,023)
Median rent asked for vacant for-rent units in 2022: $1,066
Median gross rent in Bonham, TX in 2022: $1,059
Housing units in Bonham with a mortgage: 899 (0 second mortgage, 0 home equity loan, 0 both second mortgage and home equity loan)
Houses without a mortgage: 0
Median household income for houses/condos with a mortgage: $58,336
Median household income for apartments without a mortgage: $62,033
Median monthly housing costs: $905
Compare current foreclosures near Bonham, TX:
| Photo | Address | Area | Beds / Baths | Price | Details |
|---|---|---|---|---|---|

|
#1
W Boyd St
Bonham, TX 75418
|
1,680 sq. feet
|
2 baths 3 beds |
show details | |

|
#2
Arbor Bend St
Bonham, TX 75418
|
1,938 sq. feet
|
2 baths - beds |
show details | |

|
#3
Cedar St
Bonham, TX 75418
|
1,929 sq. feet
|
1 baths - beds |
show details | |

|
#4
Thomas Lee Rd
Bonham, TX 75418
|
3,702 sq. feet
|
2 baths - beds |
show details | |

|
#5
Martin St
Bonham, TX 75418
|
1,702 sq. feet
|
2 baths - beds |
show details | |

|
#6
E 9th St
Bonham, TX 75418
|
1,846 sq. feet
|
2 baths - beds |
show details | |

|
#7
Park Ave
Bonham, TX 75418
|
1,432 sq. feet
|
1 baths - beds |
show details | |

|
#8
S Fm 271
Bonham, TX 75418
|
- sq. feet
|
- baths - beds |
show details | |

|
#9
Lynn St
Bonham, TX 75418
|
- sq. feet
|
- baths - beds |
show details | |

|
#10
Evans St
Bonham, TX 75418
|
- sq. feet
|
- baths - beds |
show details |
| Photo | Address | Area | Beds / Baths | Price | Details |
|---|---|---|---|---|---|

|
#11
County Road 4705
Bonham, TX 75418
|
1,232 sq. feet
|
- baths - beds |
show details | |

|
#12
Fm 1563
Wolfe City, TX 75496
|
2,544 sq. feet
|
3 baths 4 beds |
show details | |

|
#13
County Road 1525
Ector, TX 75439
|
1,935 sq. feet
|
1 baths - beds |
show details | |

|
#14
W Hayes St
Savoy, TX 75479
|
1,280 sq. feet
|
1 baths - beds |
show details | |

|
#15
W Maple St
Whitewright, TX 75491
|
4,128 sq. feet
|
1 baths - beds |
show details | |

|
#16
Pecan Cir
Trenton, TX 75490
|
2,858 sq. feet
|
2 baths - beds |
show details | |

|
#17
Reece Ln
Trenton, TX 75490
|
1,682 sq. feet
|
2 baths - beds |
show details | |

|
#18
Mockingbird St
Ector, TX 75439
|
- sq. feet
|
- baths - beds |
show details | |

|
#19
E Bells Blvd
Bells, TX 75414
|
2,632 sq. feet
|
- baths - beds |
show details | |

|
#20
E Grand St
Whitewright, TX 75491
|
- sq. feet
|
- baths - beds |
show details |
| Photo | Address | Area | Beds / Baths | Price | Details |
|---|---|---|---|---|---|

|
#21
W Locust St
Whitewright, TX 75491
|
- sq. feet
|
- baths - beds |
show details | |

|
#22
Blackmon Trl
Bells, TX 75414
|
1,741 sq. feet
|
- baths - beds |
show details | |

|
#23
Sunset Ln
Whitewright, TX 75491
|
- sq. feet
|
- baths - beds |
show details | |

|
#24
County Road 4927
Trenton, TX 75490
|
- sq. feet
|
- baths - beds |
show details | |

|
#25
County Road 5060
Leonard, TX 75452
|
- sq. feet
|
- baths - beds |
show details | |

|
#26
County Road 2116
Ivanhoe, TX 75447
|
- sq. feet
|
- baths - beds |
show details | |

|
#27
NW State Highway 11
Leonard, TX 75452
|
- sq. feet
|
- baths - beds |
show details | |

|
Check over 1 million property listings on Foreclosure.com!
|
browse all offers | |||

Latest news about housing in Bonham, TX collected exclusively by city-data.com from local newspapers, TV, and radio stations

 | Texas; is it part of the South or the Southwest? (391 replies) |
| Prefer historic homes (42 replies) |
| Cottage Grove? (93 replies) |
| Bonham / Leonard Area Info (2 replies) |
| Older homes, not run-down neighborhoods? (28 replies) |
| Alamo Heights Apartment Development Abandoned (76 replies) |
Median year apartment built: 1983
Household type by relationship:
Households: 10,766- Male householders: 1,567 (562 living alone), Female householders: 1,588 (593 living alone)
1,419 spouses (1,398 opposite-sex spouses), 137 unmarried partners, (137 opposite-sex unmarried partners), 2,359 children (2,159 natural, 26 adopted, 173 stepchildren), 184 grandchildren, 186 brothers or sisters, 134 parents, 0 foster children, 105 other relatives, 77 non-relatives
- In group quarters: 3,005
Size of family households: 643 2-persons, 328 3-persons, 770 4-persons, 84 5-persons, 141 6-persons, 7 7-or-more-persons.
Size of nonfamily households: 1,218 1-person, 43 2-persons.
1,359 married couples with children.
372 single-parent households (106 men, 266 women).
80.8% of residents of Bonham speak English at home.
17.7% of residents speak Spanish at home (56% speak English very well, 26% speak English well, 11% speak English not well, 7% don't speak English at all).
0.8% of residents speak other Indo-European language at home (42% speak English very well, 33% speak English well, 25% speak English not well).
0.3% of residents speak Asian or Pacific Island language at home (100% speak English not well).
Foreign born population: 939 (8.7%)
(26.1% of them are naturalized citizens)
| Here: | 5.3 |
| State: | 6.3 |
| Here: | 4.2 |
| State: | 4.0 |
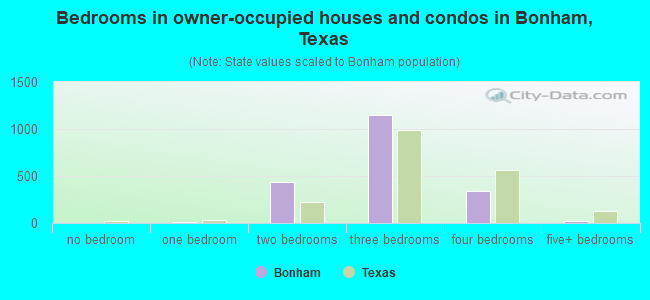
- Bedrooms in owner-occupied houses and condos in Bonham, Texas
- 0no bedroom
- 131 bedroom
- 4402 bedrooms
- 1,1493 bedrooms
- 3404 bedrooms
- 175+ bedrooms
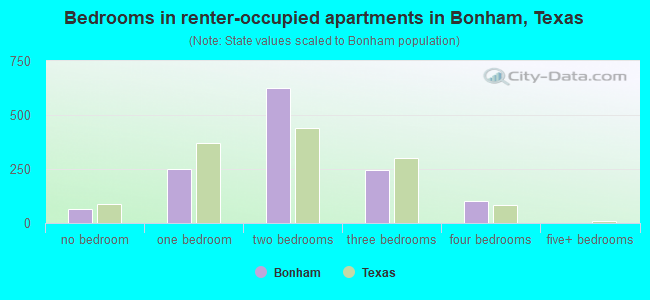
- Bedrooms in renter-occupied apartments in Bonham, Texas
- 64no bedroom
- 2481 bedroom
- 6272 bedrooms
- 2463 bedrooms
- 1044 bedrooms
- 05+ bedrooms
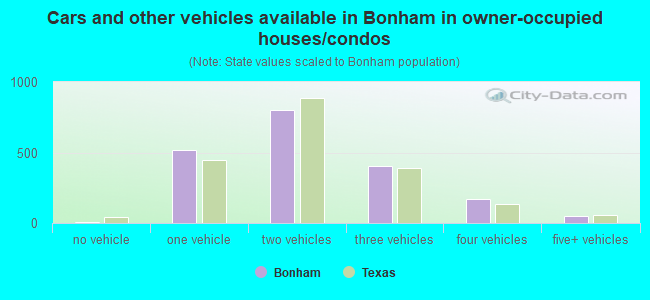
- Cars and other vehicles available in Bonham in owner-occupied houses/condos
- 10no vehicle
- 5211 vehicle
- 8032 vehicles
- 4043 vehicles
- 1714 vehicles
- 505+ vehicles
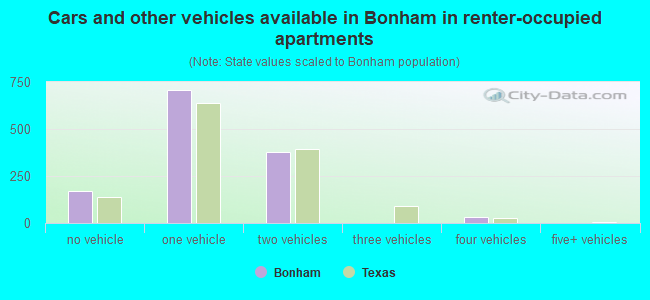
- Cars and other vehicles available in Bonham in renter-occupied apartments
- 172no vehicle
- 7071 vehicle
- 3762 vehicles
- 03 vehicles
- 344 vehicles
- 05+ vehicles
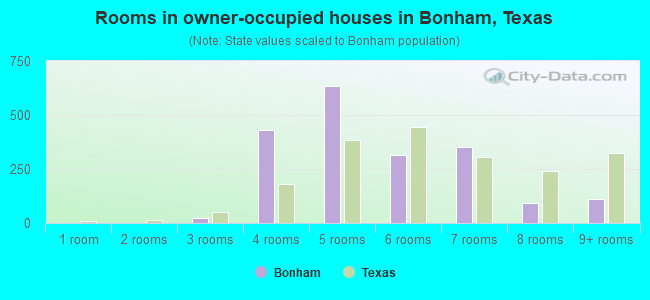
- Rooms in owner-occupied houses in Bonham, Texas
- 01 room
- 02 rooms
- 253 rooms
- 4304 rooms
- 6325 rooms
- 3166 rooms
- 3517 rooms
- 928 rooms
- 1129+ rooms
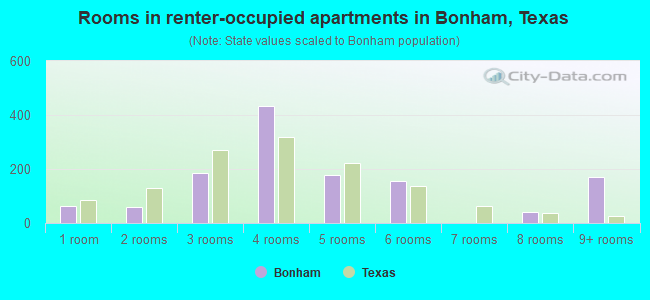
- Rooms in renter-occupied apartments in Bonham, Texas
- 641 room
- 612 rooms
- 1843 rooms
- 4344 rooms
- 1795 rooms
- 1576 rooms
- 07 rooms
- 398 rooms
- 1709+ rooms
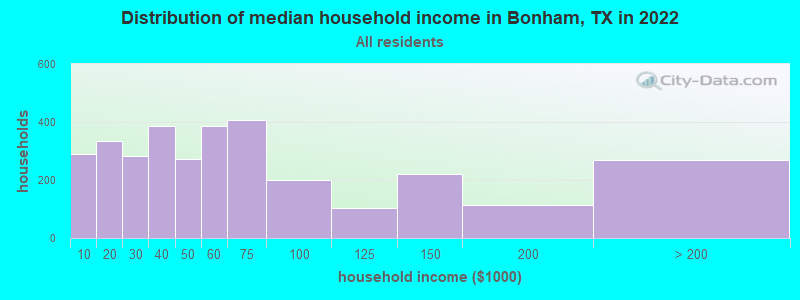
Bonham, TX household income distribution

- 291Less than $10,000
- 336$10,000 to $19,999
- 283$20,000 to $29,999
- 386$30,000 to $39,999
- 271$40,000 to $49,999
- 387$50,000 to $59,999
- 406$60,000 to $74,999
- 199$75,000 to $99,999
- 103$100,000 to $124,999
- 221$125,000 to $149,999
- 115$150,000 to $199,999
- 269$200,000 or more
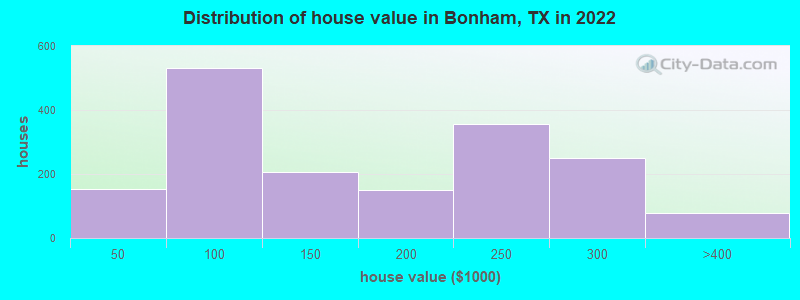
Home value of owner - occupied houses in 2022 in Bonham, TX
-
- 21Less than $10,000
- 5$10,000 to $14,999
- 11$15,000 to $19,999
- 61$25,000 to $29,999
- 6$30,000 to $34,999
- 8$35,000 to $39,999
- 38$40,000 to $49,999
- 85$50,000 to $59,999
- 75$60,000 to $69,999
- 86$70,000 to $79,999
- 157$80,000 to $89,999
- 86$90,000 to $99,999
- 112$100,000 to $124,999
- 94$125,000 to $149,999
- 99$150,000 to $174,999
- 50$175,000 to $199,999
- 357$200,000 to $249,999
- 251$250,000 to $299,999
- 76$300,000 to $399,999
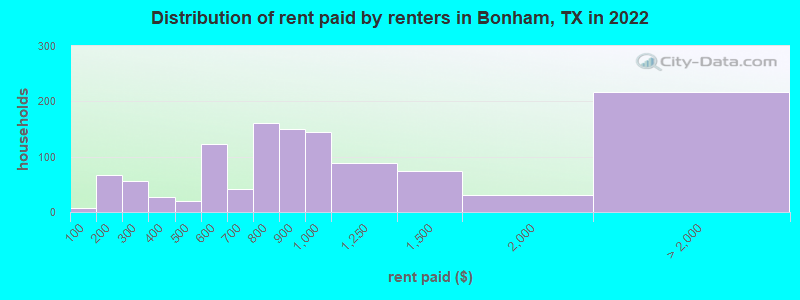
Rent paid by renters in 2022 in Bonham, TX
-
- 8Less than $100
- 66$150 to $199
- 56$250 to $299
- 28$300 to $349
- 18$400 to $449
- 41$500 to $549
- 80$550 to $599
- 7$600 to $649
- 34$650 to $699
- 55$700 to $749
- 106$750 to $799
- 150$800 to $899
- 145$900 to $999
- 88$1,000 to $1,249
- 75$1,250 to $1,499
- 29$1,500 to $1,999
- 70$3,000 to $3,499
- 146No cash rent
Percentage of workers working in this county: 65.9%
Number of people working at home: 302 (8.8% of all workers)
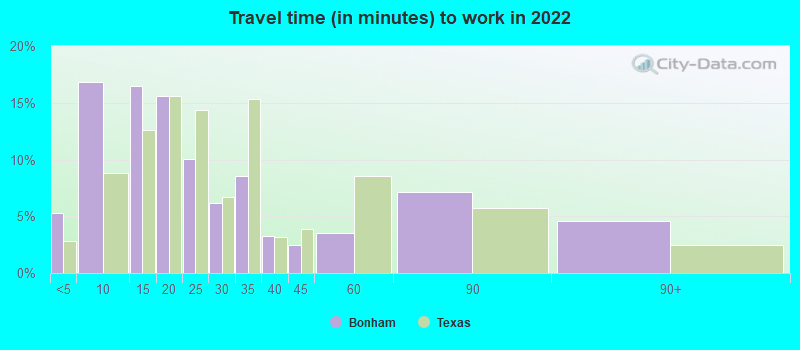
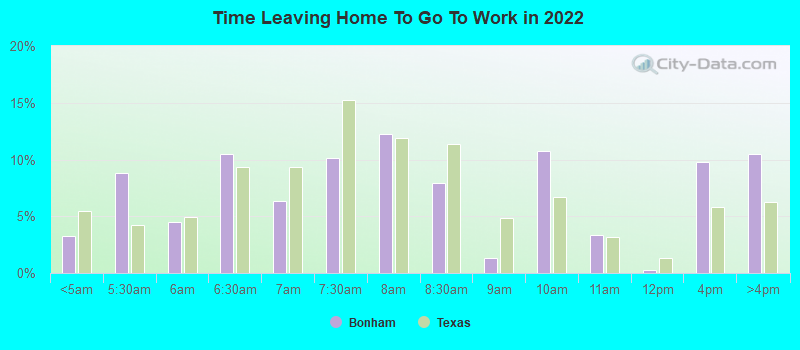
Travel time to work (commute)
- Less than 5 minutes: 281
- 5 to 9 minutes: 782
- 10 to 14 minutes: 540
- 15 to 19 minutes: 118
- 20 to 24 minutes: 76
- 25 to 29 minutes: 57
- 30 to 34 minutes: 595
- 35 to 39 minutes: 118
- 40 to 44 minutes: 169
- 45 to 59 minutes: 92
- 60 to 89 minutes: 55
- 90 or more minutes: 202
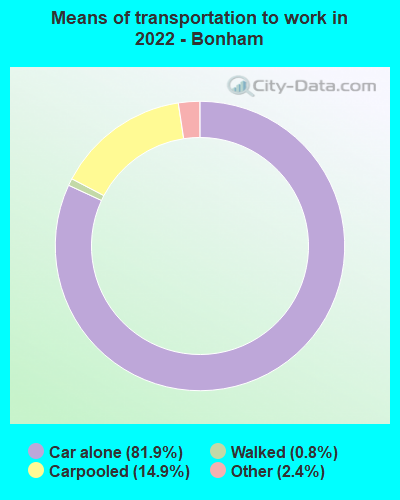
Means of transportation to work:
- Drove a car alone: 3,772 (74.2%)
- Carpooled: 744 (14.6%)
- Bus: 1 (0.0%)
- Taxi: 134 (2.6%)
- Walked: 38 (0.7%)
- Worked at home: 302 (5.9%)
- Unemployment by race in 2022
- Unemployment rate for White non-Hispanic residents
- 3.8%Males
- 8.1%Females
- Unemployment rate for Black residents
- 100.0%Males
- Unemployment rate for two or more race residents
- 22.4%Females
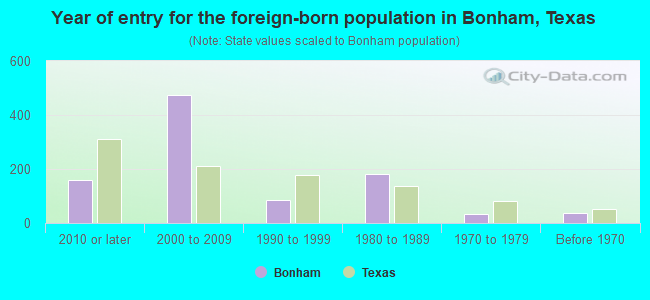
- Year of entry for the foreign-born population in Bonham, Texas
- 1602010 or later
- 4742000 to 2009
- 841990 to 1999
- 1821980 to 1989
- 341970 to 1979
- 38Before 1970
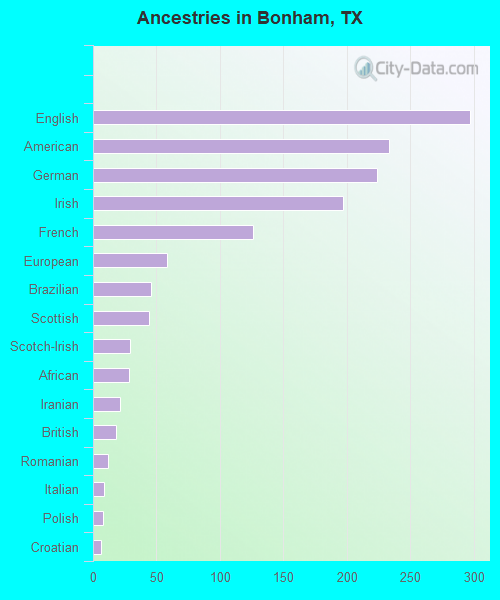
First ancestries reported:
- English: 297 (5.7%)
- American: 233 (4.5%)
- German: 224 (4.3%)
- Irish: 197 (3.8%)
- French: 126 (2.4%)
- European: 58 (1.1%)
- Brazilian: 46 (0.9%)
- Scottish: 44 (0.8%)
- Scotch-Irish: 29 (0.6%)
- African: 28 (0.5%)
- Iranian: 21 (0.4%)
- British: 18 (0.3%)
- Romanian: 12 (0.2%)
- Italian: 9 (0.2%)
- Polish: 8 (0.2%)
- Croatian: 6 (0.1%)
- French Canadian: 1 (0.02%)
Most common places of birth for foreign-born residents (%):
| Bonham: | 74.7% (701) |
| Texas: | 48.4% (2,411,723) |
| Bonham: | 4.0% (38) |
| Texas: | 0.5% (24,723) |
| Bonham: | 3.4% (32) |
| Texas: | 3.0% (147,182) |
| Bonham: | 3.3% (31) |
| Texas: | 0.2% (12,200) |
| Bonham: | 2.0% (19) |
| Texas: | 0.6% (28,963) |
| Bonham: | 1.7% (16) |
| Texas: | 0.1% (7,179) |
Place of birth for U.S.-born residents:
- This state: 6,670
- Other state: 3,140
- Northeast: 375
- Midwest: 628
- South: 1,046
- West: 1,102
73.6% of Bonham residents lived in the same house 1 years ago.
Out of people who lived in different houses, 19.6% lived in this county.
Out of people who lived in different counties, 81.8% lived in Texas.
| Bonham: | 73.6% |
| State average: | 85.7% |
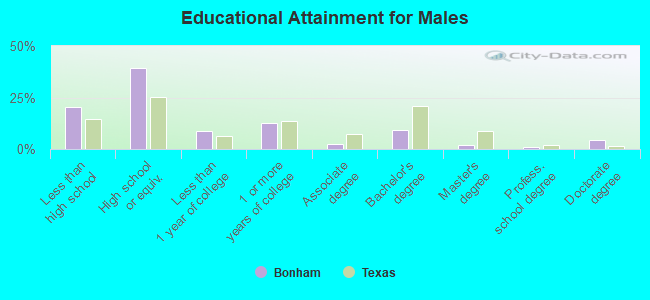
Education attainment for males 25 years and older:
- No schooling: 135
- Nursery to 4th grade: 0
- 5th and 6th grade: 110
- 7th and 8th grade: 159
- 9th grade: 220
- 10th grade: 132
- 11th grade: 229
- 12th grade, no diploma: 27
- High school graduate (or equivalency): 1,948
- Less than 1 year of college: 443
- Some college more than 1 year, no degree: 633
- Associate degree: 111
- Bachelor's degree: 457
- Master's degree: 97
- Professional school degree: 42
- Doctorate degree: 208
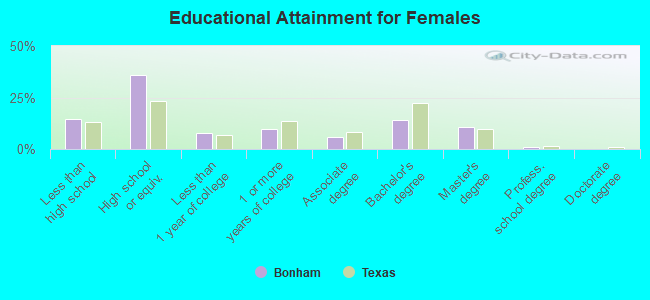
Education attainment for females 25 years and older:
- No schooling: 38
- Nursery to 4th grade: 0
- 5th and 6th grade: 62
- 7th and 8th grade: 131
- 9th grade: 71
- 10th grade: 51
- 11th grade: 25
- 12th grade, no diploma: 25
- High school graduate (or equivalency): 990
- Less than 1 year of college: 219
- Some college more than 1 year, no degree: 272
- Associate degree: 155
- Bachelor's degree: 388
- Master's degree: 293
- Professional school degree: 25
- Doctorate degree: 0
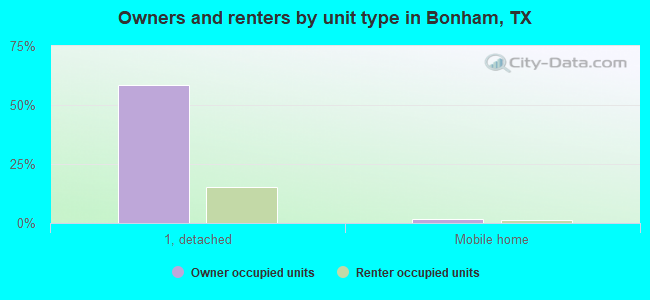
Housing units in structures:
- One, detached: 2,769
- One, attached: 66
- Two: 134
- 3 or 4: 284
- 5 to 9: 63
- 10 to 19: 120
- 20 to 49: 79
- 50 or more: 56
- Mobile homes: 97
Median worth of mobile homes: $60,595
Housing units lacking complete kitchen facilities in 2022: 7.6%
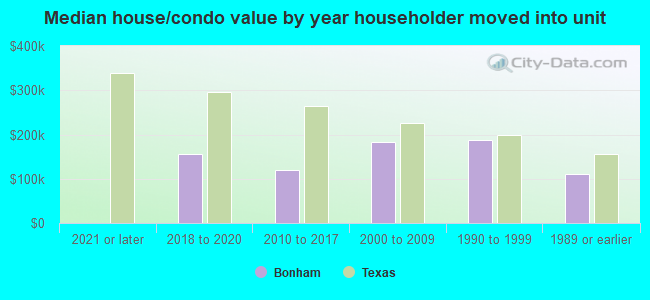
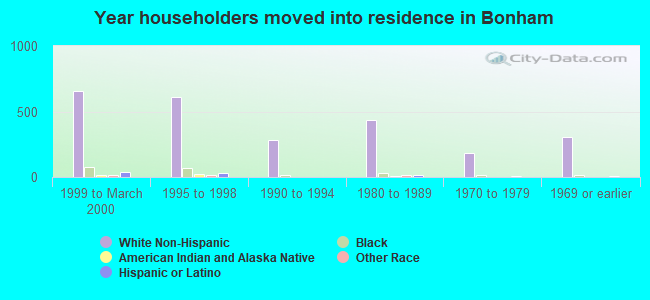
House/condo owner moved in on average 7 years ago
Renter moved in on average 1 years ago
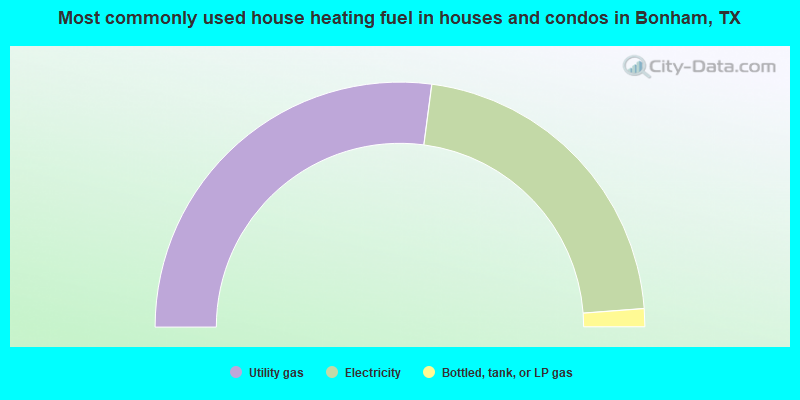
- 54.1%Utility gas
- 43.4%Electricity
- 2.4%Bottled, tank, or LP gas
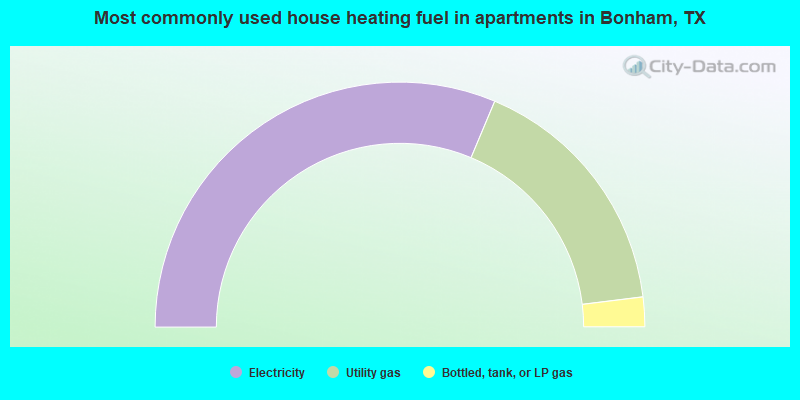
- 62.6%Electricity
- 33.4%Utility gas
- 3.9%Bottled, tank, or LP gas
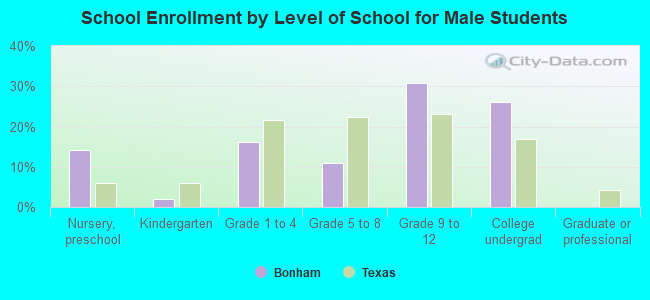
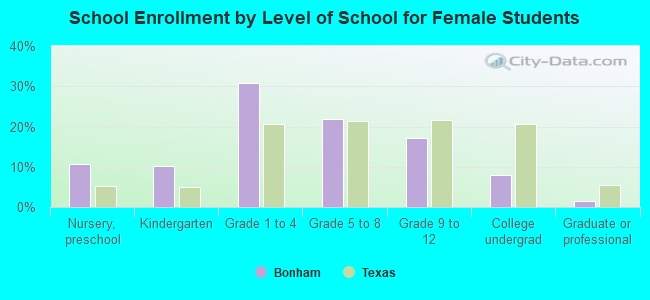
Private vs. public school enrollment:
| Here: | 4.4% |
| Texas: | 8.8% |
| Here: | 10.9% |
| Texas: | 8.0% |
| Here: | 29.8% |
| Texas: | 16.2% |