Boone, NC (North Carolina) Houses and Residents
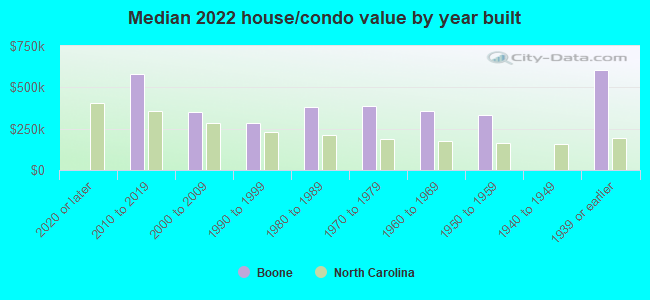
| Boone: | $384,884 |
| North Carolina: | $280,600 |
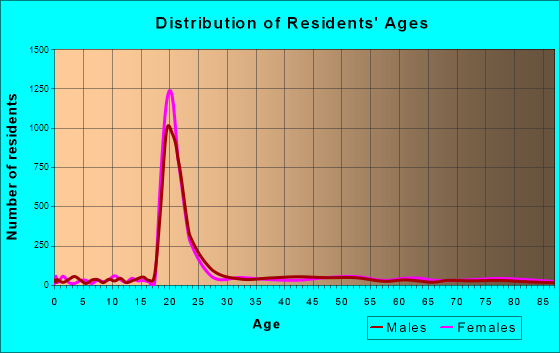
Total population: 18,130 (Urban population: 13,351 (all inside urban clusters), Rural population: 96 (all nonfarm))
Houses: 6,929 (6,027 occupied: 1,400 owner occupied, 4,714 renter occupied)
| % of renters here: | 77% |
| State: | 33% |
Housing density: 1,187 houses/condos per square mile
Median price asked for vacant for-sale houses and condos in 2022: $213,331.
Median contract rent in 2022: $1,049 (lower quartile is $748, upper quartile is $1,494)
Median rent asked for vacant for-rent units in 2022: $1,112
Median gross rent in Boone, NC in 2022: $1,108
Housing units in Boone with a mortgage: 792 (121 second mortgage, 1 home equity loan, 101 both second mortgage and home equity loan)
Houses without a mortgage: 51
Median household income for houses/condos with a mortgage: $90,639
Median household income for apartments without a mortgage: $64,917
Median monthly housing costs: $1,060
Compare current foreclosures near Boone, NC:
| Photo | Address | Area | Beds / Baths | Price | Details |
|---|---|---|---|---|---|

|
#1
Green Knob Mountain Rd
Boone, NC 28607
|
720 sq. feet
|
2 baths 3 beds |
show details | |

|
#2
Junaluska Rd
Boone, NC 28607
|
1,404 sq. feet
|
1 baths 3 beds |
show details | |

|
#3
Browns Chapel Rd
Boone, NC 28607
|
1,456 sq. feet
|
2 baths 3 beds |
show details | |

|
#4
Blowing Rock Rd Unit 2893
Boone, NC 28607
|
- sq. feet
|
- baths - beds |
show details | |

|
#5
Tanner Rd # A
Boone, NC 28607
|
- sq. feet
|
- baths - beds |
show details | |

|
#6
Zeb St # 101
Boone, NC 28607
|
- sq. feet
|
- baths - beds |
show details | |

|
#7
Shady St
Newland, NC 28657
|
1,190 sq. feet
|
1 baths 2 beds |
$245,000
|
show details |

|
#8
Miller Ln
Trade, TN 37691
|
1,812 sq. feet
|
2 baths 3 beds |
show details | |

|
#9
Will Perry Rd
Vilas, NC 28692
|
1,440 sq. feet
|
2 baths 3 beds |
show details | |

|
#10
Nc Highway 105 S # B
Banner Elk, NC 28604
|
1,392 sq. feet
|
4 baths 4 beds |
show details |
| Photo | Address | Area | Beds / Baths | Price | Details |
|---|---|---|---|---|---|

|
#11
Powder Horn Mountain Rd
Deep Gap, NC 28618
|
1,096 sq. feet
|
2 baths 3 beds |
show details | |

|
#12
Cinnamon Fern Ln
Banner Elk, NC 28604
|
5,380 sq. feet
|
3 baths 4 beds |
show details | |

|
#13
Big Hill Rd
Todd, NC 28684
|
- sq. feet
|
- baths - beds |
show details | |

|
#14
Nc Highway 268
Lenoir, NC 28645
|
- sq. feet
|
- baths - beds |
show details | |

|
#15
Ivy Branch Mountain Rd
Creston, NC 28615
|
- sq. feet
|
- baths - beds |
show details | |

|
#16
Deerwood Trl
Mountain City, TN 37683
|
- sq. feet
|
- baths - beds |
show details | |

|
#17
Tom Bunton Ln
Butler, TN 37640
|
644 sq. feet
|
- baths - beds |
show details | |

|
#18
Off Three Top Rd
Todd, NC 28684
|
- sq. feet
|
- baths - beds |
show details | |

|
#19
Valley Estate
Creston, NC 28615
|
- sq. feet
|
- baths - beds |
show details | |

|
#20
Three Top Rd
Todd, NC 28684
|
- sq. feet
|
- baths - beds |
show details |
| Photo | Address | Area | Beds / Baths | Price | Details |
|---|---|---|---|---|---|

|
#21
Nc 194 S
Todd, NC 28684
|
- sq. feet
|
- baths - beds |
show details | |

|
#22
Frank Edwards Rd
West Jefferson, NC 28694
|
- sq. feet
|
- baths - beds |
show details | |

|
#23
Waltons Mountain Rd
West Jefferson, NC 28694
|
- sq. feet
|
- baths - beds |
show details | |

|
#24
Cabbage Creek Rd
Creston, NC 28615
|
- sq. feet
|
- baths - beds |
show details | |

|
#25
E Buffalo Meadows Rd
West Jefferson, NC 28694
|
- sq. feet
|
- baths - beds |
show details | |

|
#26
Hillcrest Ave
West Jefferson, NC 28694
|
- sq. feet
|
- baths - beds |
show details | |

|
#27
Hidden Valley Rdg
Fleetwood, NC 28626
|
- sq. feet
|
- baths - beds |
show details | |

|
#28
Roundabout Rd
Creston, NC 28615
|
- sq. feet
|
- baths - beds |
show details | |

|
#29
Beaver Dr
West Jefferson, NC 28694
|
- sq. feet
|
- baths - beds |
show details | |

|
Check over 1 million property listings on Foreclosure.com!
|
browse all offers | |||

Latest news about housing in Boone, NC collected exclusively by city-data.com from local newspapers, TV, and radio stations

 | Boone - Townhomes at Brookshire Info Needed (6 replies) |
| Hendersonville, Boone, Blowing Rock.... Homeschooling (5 replies) |
| Best long-range view homes in NW NC? (25 replies) |
| Rentals around N. Wilkesboro and Boone (6 replies) |
| Real estate agents - Boone/Banner Elk/etc. (5 replies) |
| LONG-TERM 12 month CABIN RENTALS OR APARTMENTS IN BOONE ? (2 replies) |
Median year apartment built: 1991
Household type by relationship:
Households: 19,791- Male householders: 2,706 (742 living alone), Female householders: 3,259 (1,012 living alone)
1,131 spouses (1,072 opposite-sex spouses), 520 unmarried partners, (503 opposite-sex unmarried partners), 1,359 children (1,250 natural, 0 adopted, 108 stepchildren), 54 grandchildren, 102 brothers or sisters, 103 parents, 0 foster children, 28 other relatives, 4,927 non-relatives
- In group quarters: 5,598
Size of family households: 745 2-persons, 465 3-persons, 179 4-persons, 127 5-persons, 58 7-or-more-persons.
Size of nonfamily households: 1,785 1-person, 1,861 2-persons, 416 3-persons, 431 4-persons.
653 married couples with children.
222 single-parent households (9 men, 213 women).
94.0% of residents of Boone speak English at home.
2.2% of residents speak Spanish at home (69% speak English very well, 29% speak English well, 1% speak English not well).
1.5% of residents speak other Indo-European language at home (66% speak English very well, 34% speak English well).
1.1% of residents speak Asian or Pacific Island language at home (74% speak English very well, 26% speak English not well).
0.2% of residents speak other language at home (100% speak English very well).
Foreign born population: 676 (3.4%)
(36.5% of them are naturalized citizens)
| Here: | 7.0 |
| State: | 6.4 |
| Here: | 4.0 |
| State: | 4.4 |
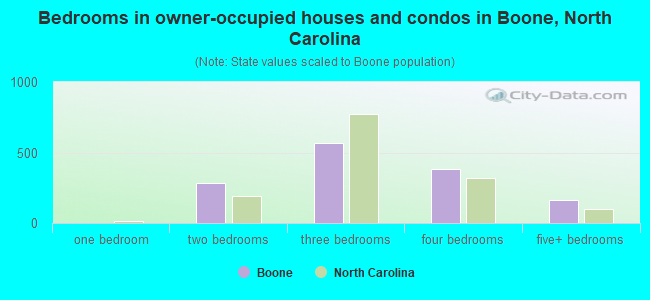
- Bedrooms in owner-occupied houses and condos in Boone, North Carolina
- 0no bedroom
- 01 bedroom
- 2842 bedrooms
- 5683 bedrooms
- 3854 bedrooms
- 1635+ bedrooms
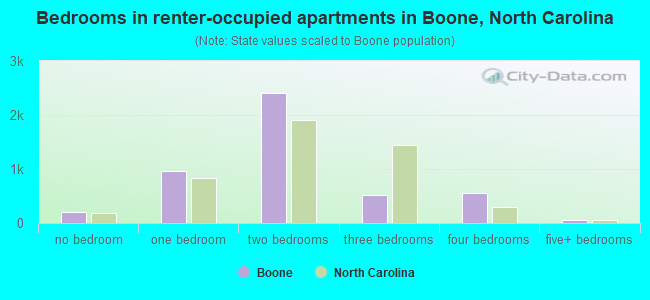
- Bedrooms in renter-occupied apartments in Boone, North Carolina
- 203no bedroom
- 9671 bedroom
- 2,4152 bedrooms
- 5273 bedrooms
- 5494 bedrooms
- 545+ bedrooms
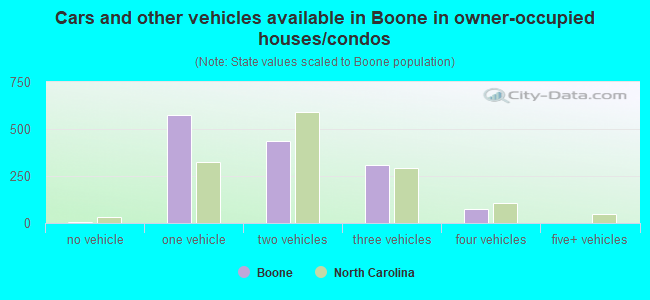
- Cars and other vehicles available in Boone in owner-occupied houses/condos
- 7no vehicle
- 5721 vehicle
- 4382 vehicles
- 3103 vehicles
- 734 vehicles
- 05+ vehicles
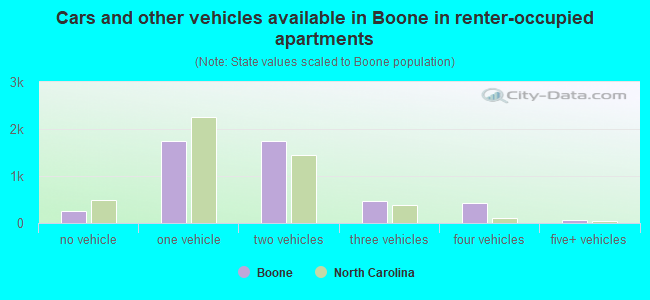
- Cars and other vehicles available in Boone in renter-occupied apartments
- 264no vehicle
- 1,7401 vehicle
- 1,7532 vehicles
- 4683 vehicles
- 4364 vehicles
- 545+ vehicles
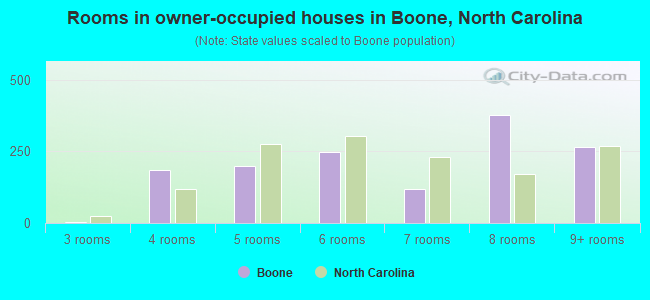
- Rooms in owner-occupied houses in Boone, North Carolina
- 01 room
- 02 rooms
- 43 rooms
- 1864 rooms
- 2005 rooms
- 2486 rooms
- 1177 rooms
- 3778 rooms
- 2679+ rooms
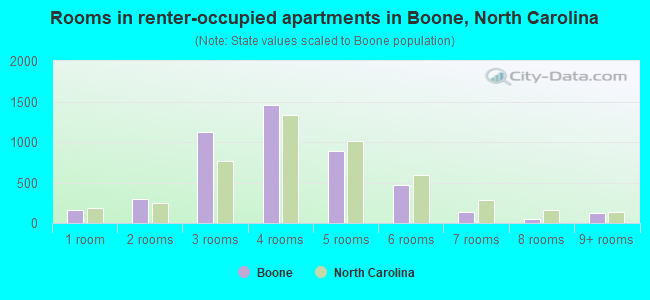
- Rooms in renter-occupied apartments in Boone, North Carolina
- 1631 room
- 3002 rooms
- 1,1183 rooms
- 1,4624 rooms
- 8885 rooms
- 4706 rooms
- 1337 rooms
- 528 rooms
- 1289+ rooms
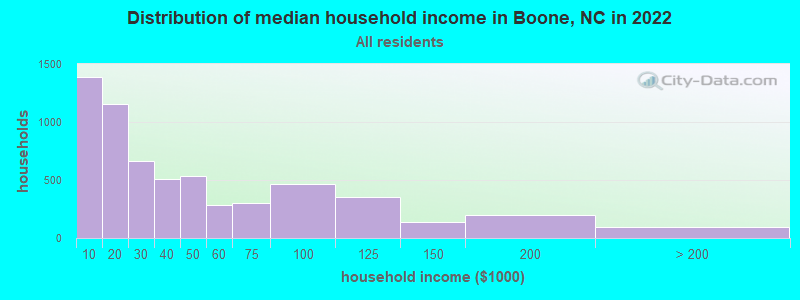
Boone, NC household income distribution

- 1,387Less than $10,000
- 1,153$10,000 to $19,999
- 665$20,000 to $29,999
- 509$30,000 to $39,999
- 533$40,000 to $49,999
- 281$50,000 to $59,999
- 298$60,000 to $74,999
- 467$75,000 to $99,999
- 350$100,000 to $124,999
- 136$125,000 to $149,999
- 194$150,000 to $199,999
- 96$200,000 or more
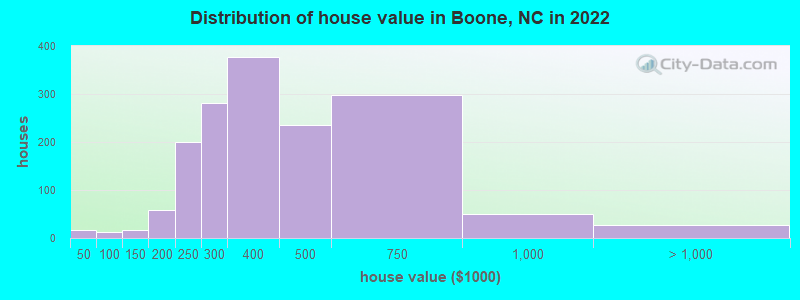
Home value of owner - occupied houses in 2022 in Boone, NC
-
- 10Less than $10,000
- 6$10,000 to $14,999
- 12$70,000 to $79,999
- 17$125,000 to $149,999
- 34$150,000 to $174,999
- 23$175,000 to $199,999
- 199$200,000 to $249,999
- 281$250,000 to $299,999
- 377$300,000 to $399,999
- 235$400,000 to $499,999
- 297$500,000 to $749,999
- 49$750,000 to $999,999
- 26$2,000,000 or more
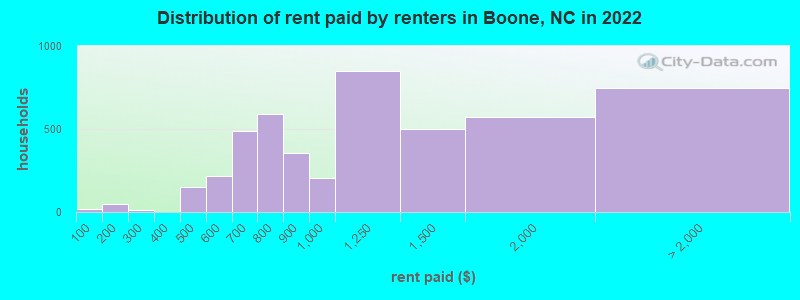
Rent paid by renters in 2022 in Boone, NC
-
- 18Less than $100
- 51$150 to $199
- 12$200 to $249
- 61$400 to $449
- 91$450 to $499
- 114$500 to $549
- 100$550 to $599
- 161$600 to $649
- 328$650 to $699
- 382$700 to $749
- 206$750 to $799
- 353$800 to $899
- 206$900 to $999
- 851$1,000 to $1,249
- 500$1,250 to $1,499
- 571$1,500 to $1,999
- 591$2,000 to $2,499
- 56$2,500 to $2,999
- 96No cash rent
Percentage of workers working in this county: 91.5%
Number of people working at home: 967 (12.1% of all workers)
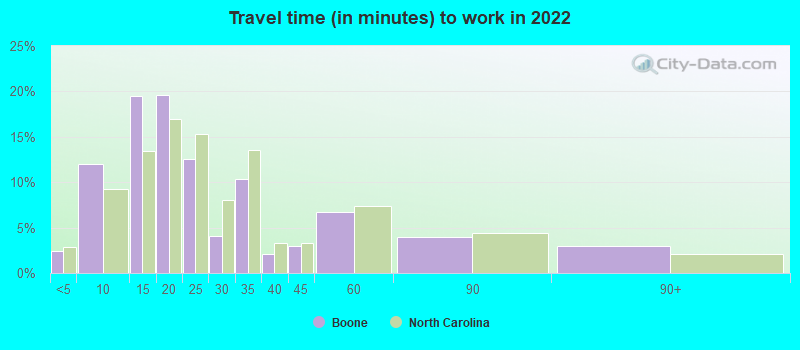
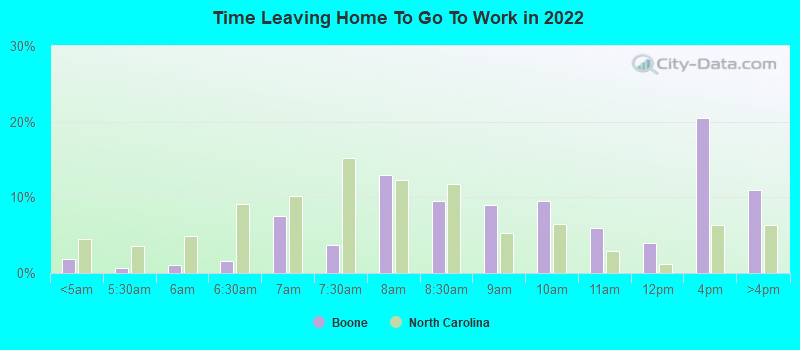
Travel time to work (commute)
- Less than 5 minutes: 448
- 5 to 9 minutes: 1,622
- 10 to 14 minutes: 1,996
- 15 to 19 minutes: 1,243
- 20 to 24 minutes: 734
- 25 to 29 minutes: 56
- 30 to 34 minutes: 388
- 35 to 39 minutes: 21
- 40 to 44 minutes: 123
- 45 to 59 minutes: 123
- 60 to 89 minutes: 53
- 90 or more minutes: 26
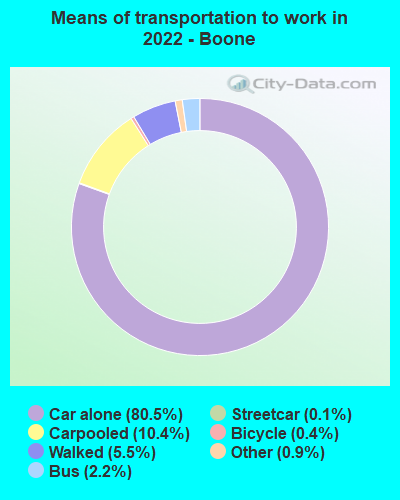
Means of transportation to work:
- Drove a car alone: 13,704 (73.3%)
- Carpooled: 1,845 (9.9%)
- Bus: 252 (1.3%)
- Subway or elevated rail: 22 (0.1%)
- Taxi: 166 (0.9%)
- Bicycle: 76 (0.4%)
- Walked: 1,006 (5.4%)
- Worked at home: 967 (5.2%)
- Unemployment by race in 2022
- Unemployment rate for White non-Hispanic residents
- 14.1%Males
- 10.7%Females
- Unemployment rate for Black residents
- 34.9%Males
- 24.4%Females
- Unemployment rate for Asian residents
- 4.7%Females
- Unemployment rate for other race residents
- 8.8%Females
- Unemployment rate for two or more race residents
- 7.1%Males
- 34.6%Females
- Unemployment rate for Hispanic or Latino residents
- 1.4%Males
- 9.5%Females
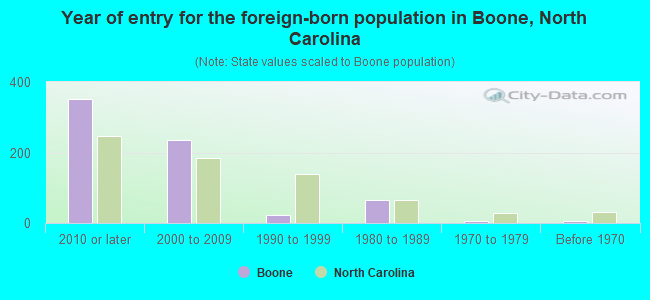
- Year of entry for the foreign-born population in Boone, North Carolina
- 3532010 or later
- 2362000 to 2009
- 241990 to 1999
- 661980 to 1989
- 61970 to 1979
- 6Before 1970
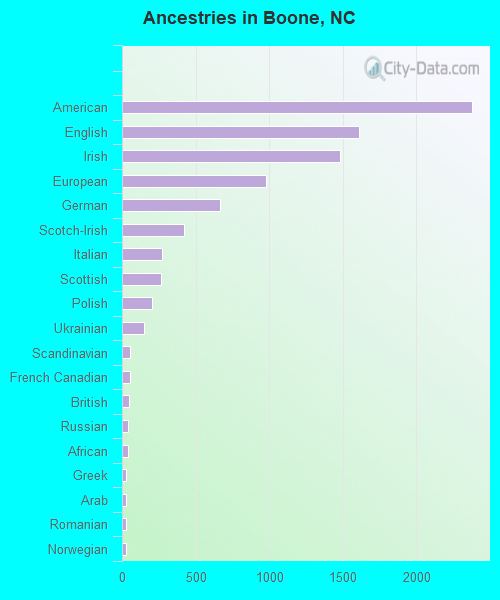
First ancestries reported:
- American: 2,376 (21.5%)
- English: 1,611 (14.6%)
- Irish: 1,482 (13.4%)
- European: 976 (8.8%)
- German: 664 (6.0%)
- Scotch-Irish: 424 (3.8%)
- Italian: 275 (2.5%)
- Scottish: 268 (2.4%)
- Polish: 203 (1.8%)
- Ukrainian: 150 (1.4%)
- Scandinavian: 56 (0.5%)
- French Canadian: 51 (0.5%)
- British: 48 (0.4%)
- Russian: 42 (0.4%)
- African: 38 (0.3%)
- Greek: 30 (0.3%)
- Arab: 29 (0.3%)
- Romanian: 28 (0.3%)
- Norwegian: 27 (0.2%)
- Northern European: 16 (0.1%)
- French: 14 (0.1%)
- Lithuanian: 11 (0.10%)
- Latvian: 8 (0.07%)
- Welsh: 8 (0.07%)
- Danish: 5 (0.05%)
Most common places of birth for foreign-born residents (%):
| Boone: | 24.4% (165) |
| North Carolina: | 0.8% (6,645) |
| Boone: | 14.6% (99) |
| North Carolina: | 2.9% (24,965) |
| Boone: | 13.6% (92) |
| North Carolina: | 1.8% (15,988) |
| Boone: | 12.1% (82) |
| North Carolina: | 24.7% (214,776) |
| Boone: | 8.6% (58) |
| North Carolina: | 0.3% (2,183) |
| Boone: | 6.2% (42) |
| North Carolina: | 1.2% (10,140) |
| Boone: | 5.6% (38) |
| North Carolina: | 4.7% (40,707) |
| Boone: | 4.7% (32) |
| North Carolina: | 3.2% (27,477) |
| Boone: | 3.8% (26) |
| North Carolina: | 2.1% (18,105) |
| Boone: | 3.6% (24) |
| North Carolina: | 0.6% (5,372) |
| Boone: | 3.6% (24) |
| North Carolina: | 0.0% (181) |
| Boone: | 3.3% (22) |
| North Carolina: | 0.5% (4,378) |
| Boone: | 2.7% (18) |
| North Carolina: | 0.1% (701) |
| Boone: | 1.6% (11) |
| North Carolina: | 0.9% (8,067) |
Place of birth for U.S.-born residents:
- This state: 12,525
- Other state: 6,288
- Northeast: 1,221
- Midwest: 908
- South: 3,157
- West: 1,002
48.3% of Boone residents lived in the same house 1 years ago.
Out of people who lived in different houses, 25.7% lived in this county.
Out of people who lived in different counties, 85.5% lived in North Carolina.
| Boone: | 48.3% |
| State average: | 87.3% |
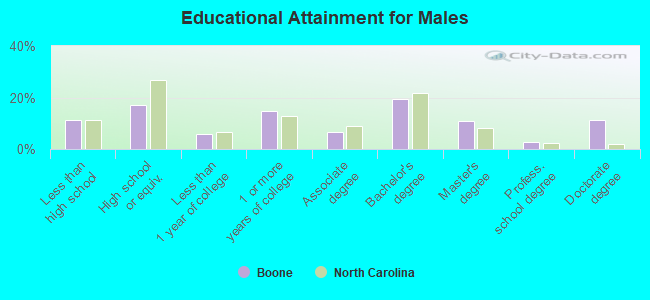
Education attainment for males 25 years and older:
- No schooling: 2
- Nursery to 4th grade: 1
- 5th and 6th grade: 0
- 7th and 8th grade: 116
- 9th grade: 18
- 10th grade: 166
- 11th grade: 0
- 12th grade, no diploma: 3
- High school graduate (or equivalency): 469
- Less than 1 year of college: 161
- Some college more than 1 year, no degree: 407
- Associate degree: 177
- Bachelor's degree: 528
- Master's degree: 292
- Professional school degree: 73
- Doctorate degree: 312
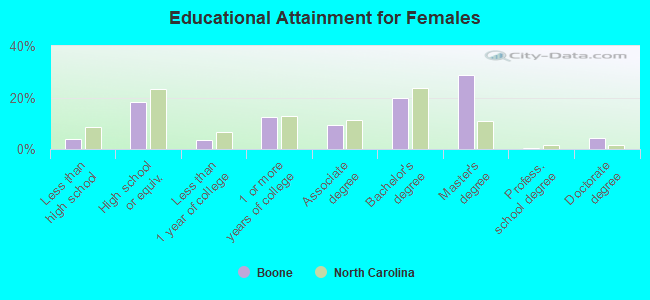
Education attainment for females 25 years and older:
- No schooling: 9
- Nursery to 4th grade: 0
- 5th and 6th grade: 12
- 7th and 8th grade: 0
- 9th grade: 0
- 10th grade: 43
- 11th grade: 50
- 12th grade, no diploma: 0
- High school graduate (or equivalency): 550
- Less than 1 year of college: 100
- Some college more than 1 year, no degree: 374
- Associate degree: 276
- Bachelor's degree: 596
- Master's degree: 861
- Professional school degree: 8
- Doctorate degree: 123
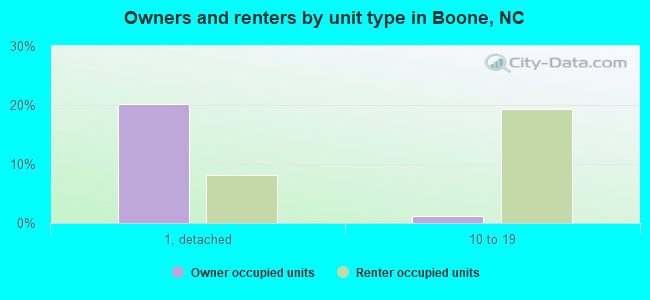
Housing units in structures:
- One, detached: 1,828
- One, attached: 113
- Two: 298
- 3 or 4: 446
- 5 to 9: 914
- 10 to 19: 1,625
- 20 to 49: 918
- 50 or more: 578
- Mobile homes: 205
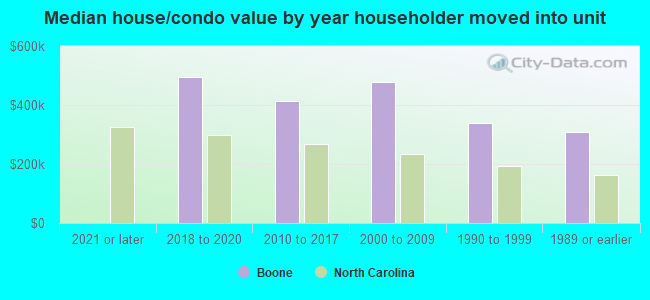
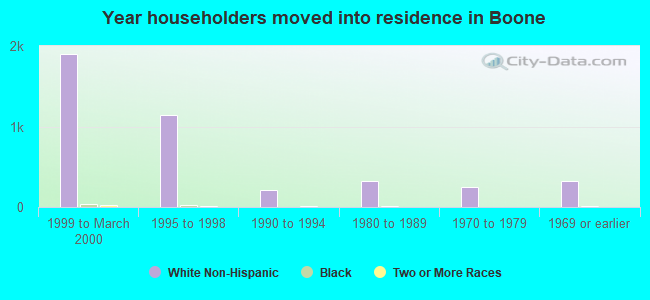
House/condo owner moved in on average 9 years ago
Renter moved in on average 0 years ago
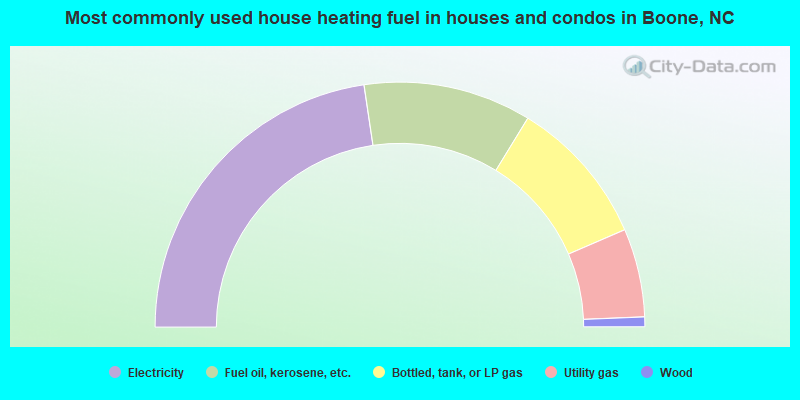
- 45.3%Electricity
- 22.2%Fuel oil, kerosene, etc.
- 19.5%Bottled, tank, or LP gas
- 11.7%Utility gas
- 1.3%Wood
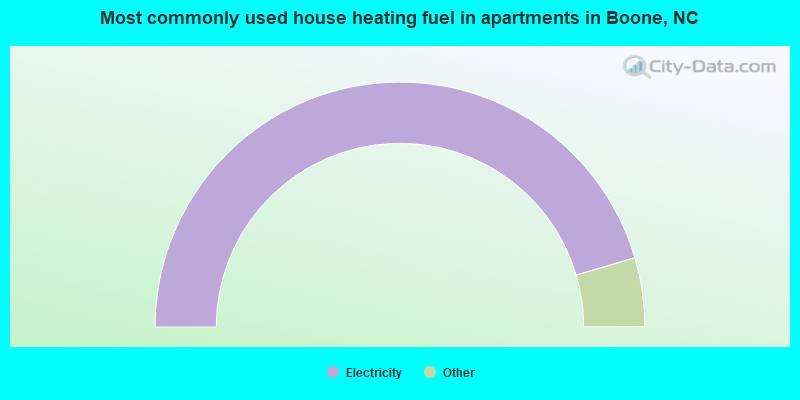
- 91.0%Electricity
- 3.9%Fuel oil, kerosene, etc.
- 3.4%Utility gas
- 1.7%Bottled, tank, or LP gas
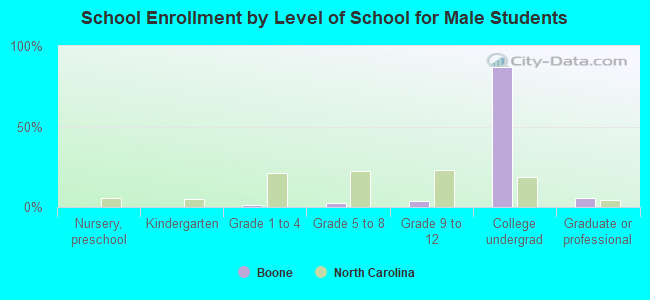
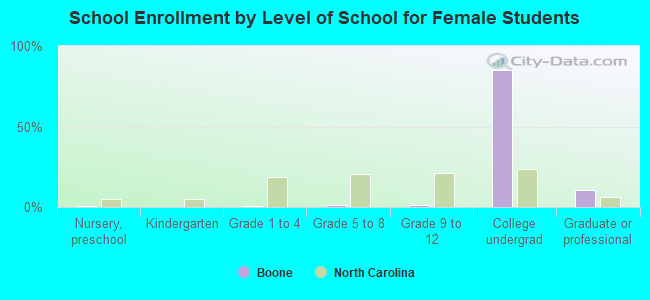
Private vs. public school enrollment:
| Here: | 8.0% |
| North Carolina: | 13.8% |
| Here: | 9.8% |
| North Carolina: | 11.9% |
| Here: | 1.6% |
| North Carolina: | 19.3% |