Borden, IN (Indiana) Houses and Residents
| Borden: | $185,998 |
| Indiana: | $208,700 |
Mean price in 2022:
Detached houses: $217,929
Here: $217,929 State: $257,916 Mobile homes: $69,756
Here: $69,756 State: $67,116
Total population: 876 (Urban population: 0, Rural population: 911 (5 farm, 906 nonfarm))
Houses: 454 (377 occupied: 299 owner occupied, 89 renter occupied)
| % of renters here: | 23% |
| State: | 29% |
Housing density: 409 houses/condos per square mile
Median price asked for vacant for-sale houses and condos in 2022: $214,774.
Median contract rent in 2022: $594 (lower quartile is $491, upper quartile is $899)
Median rent asked for vacant for-rent units in 2022: $396
Median gross rent in Borden, IN in 2022: $836
Housing units in Borden with a mortgage: 229 (14 second mortgage, 0 home equity loan, 14 both second mortgage and home equity loan)
Houses without a mortgage: 15
Median household income for houses/condos with a mortgage: $70,809
Median household income for apartments without a mortgage: $39,000
Median monthly housing costs: $877
Compare current foreclosures near Borden, IN:
| Photo | Address | Area | Beds / Baths | Price | Details |
|---|---|---|---|---|---|

|
#1
W Water St
Borden, IN 47106
|
- sq. feet
|
1 baths 3 beds |
show details | |

|
#2
Engle Rd
Borden, IN 47106
|
2,560 sq. feet
|
2 baths 3 beds |
show details | |

|
#3
Conway Rd
Borden, IN 47106
|
1,352 sq. feet
|
2 baths 3 beds |
show details | |

|
#4
W Water St
Borden, IN 47106
|
1,789 sq. feet
|
1 baths 4 beds |
show details | |

|
#5
E Main St
Borden, IN 47106
|
1,984 sq. feet
|
1 baths 5 beds |
show details | |

|
#6
State Road 60
Borden, IN 47106
|
1,237 sq. feet
|
1 baths 3 beds |
show details | |

|
#7
Forest Green Dr
Borden, IN 47106
|
1,513 sq. feet
|
2 baths - beds |
show details | |

|
#8
Water Street
Borden, IN 47106
|
- sq. feet
|
- baths - beds |
show details | |

|
#9
Chapel Hill Rd
Borden, IN 47106
|
- sq. feet
|
- baths - beds |
show details | |

|
#10
Engle Rd
Borden, IN 47106
|
- sq. feet
|
- baths - beds |
show details |
| Photo | Address | Area | Beds / Baths | Price | Details |
|---|---|---|---|---|---|

|
#11
Forest Green Dr
Borden, IN 47106
|
- sq. feet
|
- baths - beds |
show details | |

|
#12
Wooded View Dr
Borden, IN 47106
|
- sq. feet
|
- baths - beds |
show details | |

|
#13
Doe Run Way
New Albany, IN 47150
|
1,380 sq. feet
|
2 baths 3 beds |
$285,000
|
show details |

|
#14
Daisy Hill Rd
Borden, IN 47106
|
- sq. feet
|
- baths - beds |
show details | |

|
#15
Smith Dr
Borden, IN 47106
|
- sq. feet
|
- baths - beds |
show details | |

|
#16
Fieldstone Ct
New Albany, IN 47150
|
1,276 sq. feet
|
2 baths 3 beds |
show details | |

|
#17
S Clark Blvd
Clarksville, IN 47129
|
2,304 sq. feet
|
2 baths 3 beds |
show details | |

|
#18
Hillside Cir
Charlestown, IN 47111
|
1,322 sq. feet
|
2 baths 3 beds |
show details | |

|
#19
Eastside Ave
Sellersburg, IN 47172
|
1,266 sq. feet
|
1 baths 3 beds |
show details | |

|
#20
Marshall Dr
Charlestown, IN 47111
|
1,650 sq. feet
|
1 baths 4 beds |
show details |
| Photo | Address | Area | Beds / Baths | Price | Details |
|---|---|---|---|---|---|

|
#21
Jersey Park Rd
Floyds Knobs, IN 47119
|
720 sq. feet
|
1 baths 1 beds |
show details | |

|
#22
N 41st St
Louisville, KY 40212
|
1,100 sq. feet
|
1 baths 4 beds |
show details | |

|
#23
S 42nd St
Louisville, KY 40211
|
1,078 sq. feet
|
1 baths 1 beds |
show details | |

|
#24
E Blue River Rd
Pekin, IN 47165
|
2,000 sq. feet
|
1 baths 3 beds |
show details | |

|
#25
E 15th St
New Albany, IN 47150
|
1,070 sq. feet
|
1 baths 2 beds |
show details | |

|
#26
Saddle Dr
Charlestown, IN 47111
|
1,377 sq. feet
|
1 baths 3 beds |
show details | |

|
#27
Longfellow Dr
Clarksville, IN 47129
|
1,512 sq. feet
|
1 baths 3 beds |
show details | |

|
#28
E 7th St
New Albany, IN 47150
|
1,134 sq. feet
|
1 baths 2 beds |
show details | |

|
#29
W 6th St
New Albany, IN 47150
|
984 sq. feet
|
1 baths 2 beds |
show details | |

|
#30
Whittier Dr
Clarksville, IN 47129
|
1,073 sq. feet
|
1 baths 3 beds |
show details |
| Photo | Address | Area | Beds / Baths | Price | Details |
|---|---|---|---|---|---|

|
#31
Idlewood Dr
Clarksville, IN 47129
|
988 sq. feet
|
1 baths 3 beds |
show details | |

|
#32
Boiling Spring Rd
New Albany, IN 47150
|
960 sq. feet
|
1 baths 2 beds |
show details | |

|
#33
Beeler St
New Albany, IN 47150
|
1,058 sq. feet
|
1 baths 3 beds |
show details | |

|
#34
Beeler St
New Albany, IN 47150
|
834 sq. feet
|
1 baths 2 beds |
show details | |

|
#35
Locust St
New Albany, IN 47150
|
1,530 sq. feet
|
1 baths 2 beds |
show details | |

|
#36
Greenbrier Ct
Charlestown, IN 47111
|
1,872 sq. feet
|
2 baths 3 beds |
show details | |

|
#37
Mona Vista Ct
New Albany, IN 47150
|
1,704 sq. feet
|
1 baths 2 beds |
show details | |

|
#38
Slate Run Rd
New Albany, IN 47150
|
1,067 sq. feet
|
1 baths 2 beds |
show details | |

|
#39
Spring Meadow Cir
Salem, IN 47167
|
1,850 sq. feet
|
2 baths 3 beds |
show details | |

|
#40
Aberdeen Ln
Charlestown, IN 47111
|
1,842 sq. feet
|
2 baths 3 beds |
show details |
| Photo | Address | Area | Beds / Baths | Price | Details |
|---|---|---|---|---|---|

|
#41
Depauw Ave
New Albany, IN 47150
|
1,807 sq. feet
|
1 baths 3 beds |
show details | |

|
#42
Griffin St
New Albany, IN 47150
|
720 sq. feet
|
1 baths 3 beds |
show details | |

|
#43
Beagle Club Rd
Underwood, IN 47177
|
1,300 sq. feet
|
2 baths 3 beds |
show details | |

|
#44
Ealy St
New Albany, IN 47150
|
1,036 sq. feet
|
1 baths 4 beds |
show details | |

|
#45
Longfellow Dr
Clarksville, IN 47129
|
1,102 sq. feet
|
2 baths 4 beds |
show details | |

|
#46
Hebron Church Rd
Henryville, IN 47126
|
756 sq. feet
|
1 baths 2 beds |
show details | |

|
#47
Ekin Ave
New Albany, IN 47150
|
2,533 sq. feet
|
3 baths 4 beds |
show details | |

|
#48
S Anna Ln
Scottsburg, IN 47170
|
1,232 sq. feet
|
2 baths 3 beds |
show details | |

|
#49
E Spring St
New Albany, IN 47150
|
1,092 sq. feet
|
1 baths 1 beds |
show details | |

|
Check over 1 million property listings on Foreclosure.com!
|
browse all offers | |||

Latest news about housing in Borden, IN collected exclusively by city-data.com from local newspapers, TV, and radio stations

 | Special Education Programs in Southern Indiana (2 replies) |
| Looking For Haunted Places In Southern Indiana (124 replies) |
| Borden, IN info. (5 replies) |
| unsolved child murders in clark couny in the 70s (104 replies) |
| Thinking about moving to Indiana from California (18 replies) |

Median year apartment built: 1971
Household type by relationship:
Households: 978- Male householders: 162 (66 living alone), Female householders: 205 (79 living alone)
178 spouses (177 opposite-sex spouses), 31 unmarried partners, (31 opposite-sex unmarried partners), 359 children (343 natural, 0 adopted, 16 stepchildren), 14 grandchildren, 7 brothers or sisters, 17 parents, 0 foster children, 0 other relatives, 1 non-relatives
Size of family households: 65 2-persons, 40 3-persons, 61 4-persons, 32 5-persons, 5 6-persons.
Size of nonfamily households: 167 1-person, 21 2-persons.
237 married couples with children.
49 single-parent households (22 men, 27 women).
96.5% of residents of Borden speak English at home.
2.0% of residents speak Spanish at home (65% speak English very well, 35% speak English not well).
0.3% of residents speak other Indo-European language at home (100% speak English well).
Foreign born population: 20 (2.0%)
(30.0% of them are naturalized citizens)
| Here: | 6.2 |
| State: | 6.6 |
| Here: | 4.3 |
| State: | 4.3 |

- Bedrooms in owner-occupied houses and condos in Borden, Indiana
- 0no bedroom
- 31 bedroom
- 522 bedrooms
- 1873 bedrooms
- 414 bedrooms
- 165+ bedrooms

- Bedrooms in renter-occupied apartments in Borden, Indiana
- 0no bedroom
- 321 bedroom
- 172 bedrooms
- 263 bedrooms
- 144 bedrooms
- 05+ bedrooms

- Cars and other vehicles available in Borden in owner-occupied houses/condos
- 13no vehicle
- 451 vehicle
- 1722 vehicles
- 573 vehicles
- 104 vehicles
- 25+ vehicles

- Cars and other vehicles available in Borden in renter-occupied apartments
- 16no vehicle
- 461 vehicle
- 172 vehicles
- 103 vehicles
- 04 vehicles
- 05+ vehicles

- Rooms in owner-occupied houses in Borden, Indiana
- 01 room
- 02 rooms
- 33 rooms
- 284 rooms
- 705 rooms
- 936 rooms
- 547 rooms
- 138 rooms
- 389+ rooms

- Rooms in renter-occupied apartments in Borden, Indiana
- 01 room
- 102 rooms
- 233 rooms
- 114 rooms
- 315 rooms
- 06 rooms
- 147 rooms
- 08 rooms
- 19+ rooms


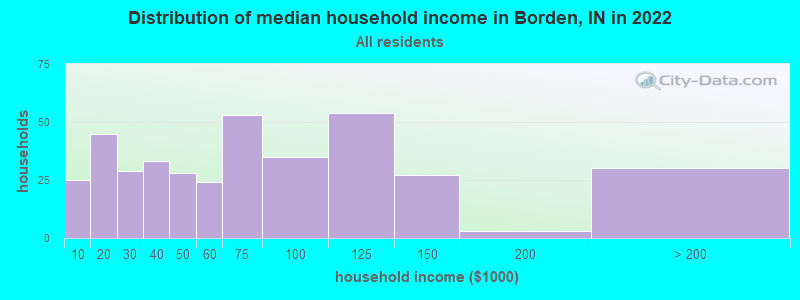
Borden, IN household income distribution

- 25Less than $10,000
- 45$10,000 to $19,999
- 29$20,000 to $29,999
- 33$30,000 to $39,999
- 28$40,000 to $49,999
- 24$50,000 to $59,999
- 53$60,000 to $74,999
- 35$75,000 to $99,999
- 54$100,000 to $124,999
- 27$125,000 to $149,999
- 3$150,000 to $199,999
- 30$200,000 or more
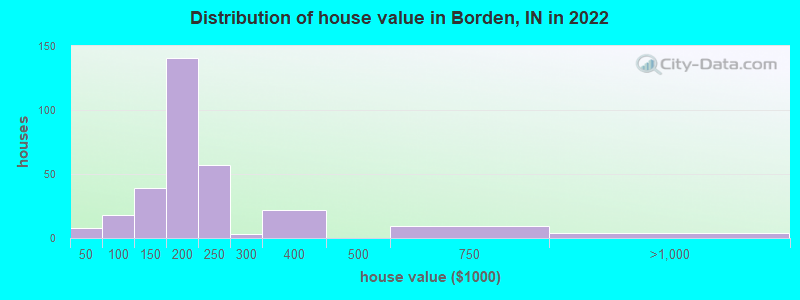
Home value of owner - occupied houses in 2022 in Borden, IN
-
- 6$15,000 to $19,999
- 1$20,000 to $24,999
- 1$50,000 to $59,999
- 9$60,000 to $69,999
- 1$70,000 to $79,999
- 2$80,000 to $89,999
- 3$90,000 to $99,999
- 18$100,000 to $124,999
- 20$125,000 to $149,999
- 113$150,000 to $174,999
- 27$175,000 to $199,999
- 57$200,000 to $249,999
- 3$250,000 to $299,999
- 21$300,000 to $399,999
- 8$500,000 to $749,999
- 3$750,000 to $999,999
Rent paid by renters in 2022 in Borden, IN
-
- 4$350 to $399
- 16$450 to $499
- 3$500 to $549
- 18$550 to $599
- 2$600 to $649
- 19$800 to $899
- 9No cash rent


Percentage of workers working in this county: 47.0%
Number of people working at home: 31 (7.2% of all workers)
Travel time to work (commute)
- Less than 5 minutes: 24
- 5 to 9 minutes: 11
- 10 to 14 minutes: 26
- 15 to 19 minutes: 18
- 20 to 24 minutes: 87
- 25 to 29 minutes: 56
- 30 to 34 minutes: 83
- 35 to 39 minutes: 18
- 40 to 44 minutes: 10
- 45 to 59 minutes: 34
- 60 to 89 minutes: 24
- 90 or more minutes: 1
Means of transportation to work:
- Drove a car alone: 374 (84.2%)
- Carpooled: 51 (11.5%)
- Subway or elevated: 2 (0.5%)
- Walked: 15 (3.4%)
- Other means: 2 (0.5%)

- Unemployment by race in 2022
- Unemployment rate for White non-Hispanic residents
- 0.3%Males
- 4.3%Females

- Year of entry for the foreign-born population in Borden, Indiana
- 02010 or later
- 122000 to 2009
- 01990 to 1999
- 21980 to 1989
- 01970 to 1979
- 0Before 1970

First ancestries reported:
- American: 82 (26.3%)
- German: 55 (17.6%)
- English: 41 (13.1%)
- Irish: 27 (8.7%)
- European: 7 (2.2%)
- Haitian: 5 (1.6%)
- French Canadian: 3 (1.0%)
- British: 2 (0.6%)
- Polish: 2 (0.6%)
- Scottish: 1 (0.3%)
Most common places of birth for foreign-born residents (%):
| Borden: | 63.2% (12) |
| Indiana: | 27.0% (101,996) |
| Borden: | 26.3% (5) |
| Indiana: | 1.2% (4,484) |
| Borden: | 10.5% (2) |
| Indiana: | 1.7% (6,439) |
Place of birth for U.S.-born residents:
- This state: 643
- Other state: 312
- Northeast: 2
- Midwest: 31
- South: 232
- West: 58
89.7% of Borden residents lived in the same house 1 years ago.
Out of people who lived in different houses, 38.8% lived in this county.
Out of people who lived in different counties, 57.6% lived in Indiana.
| Borden: | 89.7% |
| State average: | 87.1% |
Education attainment for males 25 years and older:
- No schooling: 3
- Nursery to 4th grade: 0
- 5th and 6th grade: 2
- 7th and 8th grade: 3
- 9th grade: 5
- 10th grade: 0
- 11th grade: 0
- 12th grade, no diploma: 34
- High school graduate (or equivalency): 80
- Less than 1 year of college: 43
- Some college more than 1 year, no degree: 23
- Associate degree: 49
- Bachelor's degree: 33
- Master's degree: 10
- Professional school degree: 9
- Doctorate degree: 0

Education attainment for females 25 years and older:
- No schooling: 3
- Nursery to 4th grade: 0
- 5th and 6th grade: 12
- 7th and 8th grade: 4
- 9th grade: 0
- 10th grade: 0
- 11th grade: 0
- 12th grade, no diploma: 0
- High school graduate (or equivalency): 89
- Less than 1 year of college: 32
- Some college more than 1 year, no degree: 44
- Associate degree: 37
- Bachelor's degree: 52
- Master's degree: 35
- Professional school degree: 0
- Doctorate degree: 0


Housing units in structures:
- One, detached: 376
- One, attached: 5
- Two: 5
- 3 or 4: 11
- 10 to 19: 12
- 50 or more: 7
- Mobile homes: 35
Median worth of mobile homes: $252,038
Housing units lacking complete kitchen facilities in 2022: 7.6%
House/condo owner moved in on average 11 years ago
Renter moved in on average 0 years ago

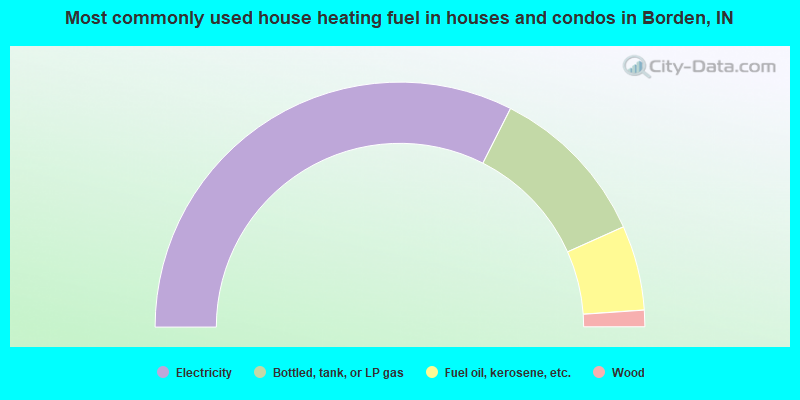
- 65.0%Electricity
- 21.7%Bottled, tank, or LP gas
- 11.2%Fuel oil, kerosene, etc.
- 2.2%Wood
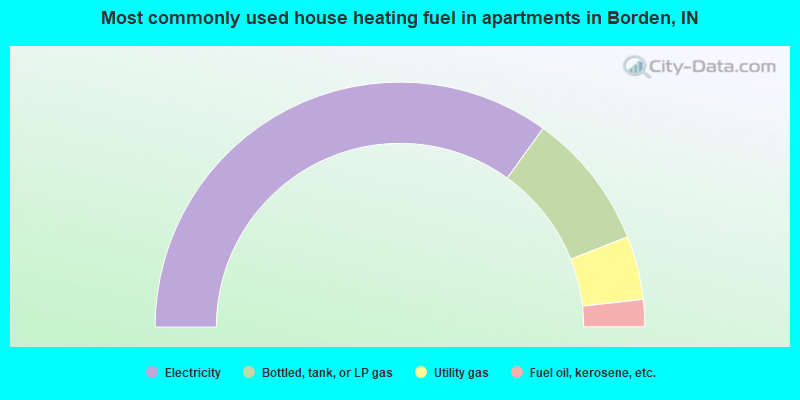
- 69.9%Electricity
- 18.1%Bottled, tank, or LP gas
- 8.4%Utility gas
- 3.6%Fuel oil, kerosene, etc.
Private vs. public school enrollment:
| Here: | 1.3% |
| Indiana: | 14.9% |
| Here: | 26.8% |
| Indiana: | 11.4% |
| Here: | 0.0% |
| Indiana: | 22.3% |


