Bordentown, NJ (New Jersey) Houses and Residents
| Bordentown: | $304,651 |
| New Jersey: | $428,900 |
Total population: 3,900 (All urban)
Houses: 2,091 (1,862 occupied: 969 owner occupied, 899 renter occupied)
| % of renters here: | 48% |
| State: | 35% |
Housing density: 2,267 houses/condos per square mile
Median price asked for vacant for-sale houses and condos in 2022 in this county: $249,452.
Median contract rent in 2022: $1,221 (lower quartile is $993, upper quartile is $1,684)
Median rent asked for vacant for-rent units in 2022: $1,202
Median gross rent in Bordentown, NJ in 2022: $1,351
Housing units in Bordentown with a mortgage: 631 (32 second mortgage, 0 home equity loan, 31 both second mortgage and home equity loan)
Houses without a mortgage: 13
Median household income for houses/condos with a mortgage: $125,187
Median household income for apartments without a mortgage: $91,468
Median monthly housing costs: $1,388
Compare current foreclosures in Bordentown, NJ:
| Photo | Address | Area | Beds / Baths | Price | Details |
|---|---|---|---|---|---|

|
#1
Springhouse Ct
Bordentown, NJ 08505
|
3,040 sq. feet
|
2 baths 5 beds |
show details | |

|
#2
Prince St
Bordentown, NJ 08505
|
1,712 sq. feet
|
1 baths 3 beds |
show details | |

|
#3
Hinkle Dr
Bordentown, NJ 08505
|
1,453 sq. feet
|
- baths - beds |
show details | |

|
#4
Grover Avenue
Bordentown, NJ 08505
|
- sq. feet
|
- baths - beds |
show details | |

|
#5
Plymouth Ct # 4
Bordentown, NJ 08505
|
1,356 sq. feet
|
- baths - beds |
show details | |

|
#6
Seneca Ln
Bordentown, NJ 08505
|
2,256 sq. feet
|
- baths - beds |
show details | |

|
#7
Lancaster Ct
Bordentown, NJ 08505
|
1,356 sq. feet
|
- baths - beds |
show details | |

|
#8
Gloucester Ct
Bordentown, NJ 08505
|
1,598 sq. feet
|
- baths - beds |
show details | |

|
#9
Route 130
Bordentown, NJ 08505
|
- sq. feet
|
- baths - beds |
show details | |

|
#10
K. Johnson Blvd # 210
Bordentown, NJ 08505
|
- sq. feet
|
- baths - beds |
show details |
| Photo | Address | Area | Beds / Baths | Price | Details |
|---|---|---|---|---|---|

|
#11
Seneca Ln
Bordentown, NJ 08505
|
2,292 sq. feet
|
- baths - beds |
show details | |

|
#12
Ardmore Dr
Bordentown, NJ 08505
|
2,176 sq. feet
|
- baths - beds |
show details | |

|
#13
Plymouth C 4
Bordentown, NJ 08505
|
1,356 sq. feet
|
- baths - beds |
show details | |

|
#14
Brook Ln
Bordentown, NJ 08505
|
1,669 sq. feet
|
- baths - beds |
show details | |

|
#15
Ward Ave Apt 13h
Bordentown, NJ 08505
|
- sq. feet
|
- baths - beds |
show details | |

|
#16
Ridgewood Dr
Bordentown, NJ 08505
|
3,304 sq. feet
|
- baths - beds |
show details | |

|
#17
Us Highway 130
Bordentown, NJ 08505
|
- sq. feet
|
- baths - beds |
show details | |

|
#18
Eaton Rd
Bordentown, NJ 08505
|
996 sq. feet
|
- baths - beds |
show details | |

|
#19
Prince St
Bordentown, NJ 08505
|
1,474 sq. feet
|
- baths - beds |
show details | |

|
#20
Willow Way
Bordentown, NJ 08505
|
2,129 sq. feet
|
- baths - beds |
show details |
| Photo | Address | Area | Beds / Baths | Price | Details |
|---|---|---|---|---|---|

|
#21
Kramer Ct
Bordentown, NJ 08505
|
- sq. feet
|
- baths - beds |
show details | |

|
#22
E Union St
Bordentown, NJ 08505
|
1,520 sq. feet
|
- baths - beds |
show details | |

|
#23
Brooks Ave
Bordentown, NJ 08505
|
884 sq. feet
|
- baths - beds |
show details | |

|
#24
Prince St
Bordentown, NJ 08505
|
1,172 sq. feet
|
- baths - beds |
show details | |

|
#25
Covington Ct
Bordentown, NJ 08505
|
1,228 sq. feet
|
- baths - beds |
show details | |

|
#26
Oliver St
Bordentown, NJ 08505
|
1,492 sq. feet
|
- baths - beds |
show details | |

|
#27
4th St
Bordentown, NJ 08505
|
- sq. feet
|
- baths - beds |
show details | |

|
#28
Charles Bossert Dr
Bordentown, NJ 08505
|
- sq. feet
|
- baths - beds |
show details | |

|
#29
Sagamore Ln
Bordentown, NJ 08505
|
3,182 sq. feet
|
- baths - beds |
show details | |

|
#30
Thompson St
Bordentown, NJ 08505
|
1,131 sq. feet
|
- baths - beds |
show details |
| Photo | Address | Area | Beds / Baths | Price | Details |
|---|---|---|---|---|---|

|
#31
Landon Dr
Bordentown, NJ 08505
|
1,596 sq. feet
|
- baths - beds |
show details | |

|
#32
Dorset Ct
Bordentown, NJ 08505
|
1,663 sq. feet
|
- baths - beds |
show details | |

|
#33
E Chestnut St
Bordentown, NJ 08505
|
2,120 sq. feet
|
- baths - beds |
show details | |

|
#34
Maud Booth Ct, Apt 123
Bordentown, NJ 08505
|
- sq. feet
|
- baths - beds |
show details | |

|
#35
2nd St
Bordentown, NJ 08505
|
1,840 sq. feet
|
- baths - beds |
show details | |

|
#36
Linden Rd
Bordentown, NJ 08505
|
1,464 sq. feet
|
- baths - beds |
show details | |

|
#37
Gloucester Ct
Bordentown, NJ 08505
|
1,296 sq. feet
|
- baths - beds |
show details | |

|
#38
Park St Apt 9i
Bordentown, NJ 08505
|
- sq. feet
|
- baths - beds |
show details | |

|
#39
Sagamore Ln
Bordentown, NJ 08505
|
2,900 sq. feet
|
- baths - beds |
show details | |

|
#40
Pine Ave
Bordentown, NJ 08505
|
1,471 sq. feet
|
- baths - beds |
show details |
| Photo | Address | Area | Beds / Baths | Price | Details |
|---|---|---|---|---|---|

|
#41
Dunns Mill Rd
Bordentown, NJ 08505
|
- sq. feet
|
- baths - beds |
show details | |

|
#42
Bordenshire Dr
Bordentown, NJ 08505
|
1,412 sq. feet
|
- baths - beds |
show details | |

|
#43
Winchester Ct
Bordentown, NJ 08505
|
1,228 sq. feet
|
- baths - beds |
show details | |

|
#44
Plymouth Ct
Bordentown, NJ 08505
|
- sq. feet
|
- baths - beds |
show details | |

|
#45
Lucas Dr
Bordentown, NJ 08505
|
1,510 sq. feet
|
- baths - beds |
show details | |

|
#46
Fairfax Ct
Bordentown, NJ 08505
|
1,296 sq. feet
|
- baths - beds |
show details | |

|
#47
Stanton Ave
Bordentown, NJ 08505
|
1,438 sq. feet
|
- baths - beds |
show details | |

|
#48
Gilbert Rd
Bordentown, NJ 08505
|
- sq. feet
|
- baths - beds |
show details | |

|
#49
Maple Ave
Bordentown, NJ 08505
|
- sq. feet
|
- baths - beds |
show details | |

|
Check over 1 million property listings on Foreclosure.com!
|
browse all offers | |||

Latest news about housing in Bordentown, NJ collected exclusively by city-data.com from local newspapers, TV, and radio stations


Median year apartment built: 1954
Household type by relationship:
Households: 4,025- Male householders: 927 (429 living alone), Female householders: 938 (301 living alone)
579 spouses (560 opposite-sex spouses), 264 unmarried partners, (264 opposite-sex unmarried partners), 866 children (761 natural, 48 adopted, 56 stepchildren), 67 grandchildren, 64 brothers or sisters, 44 parents, 0 foster children, 77 other relatives, 108 non-relatives
- In group quarters: 85
Size of family households: 497 2-persons, 210 3-persons, 172 4-persons, 41 5-persons, 3 6-persons, 8 7-or-more-persons.
Size of nonfamily households: 750 1-person, 191 2-persons, 16 3-persons.
356 married couples with children.
241 single-parent households (44 men, 197 women).
96.6% of residents of Bordentown speak English at home.
1.4% of residents speak Spanish at home (83% speak English very well, 17% speak English well).
0.8% of residents speak other Indo-European language at home (90% speak English very well, 10% speak English not well).
0.8% of residents speak Asian or Pacific Island language at home (61% speak English very well, 32% speak English well, 6% speak English not well).
0.2% of residents speak other language at home (100% speak English very well).
Foreign born population: 190 (4.7%)
(66.3% of them are naturalized citizens)
| Here: | 6.3 |
| State: | 6.8 |
| Here: | 3.6 |
| State: | 3.9 |

- Bedrooms in owner-occupied houses and condos in Bordentown, New Jersey
- 0no bedroom
- 71 bedroom
- 2702 bedrooms
- 4993 bedrooms
- 1114 bedrooms
- 825+ bedrooms

- Bedrooms in renter-occupied apartments in Bordentown, New Jersey
- 8no bedroom
- 4581 bedroom
- 3432 bedrooms
- 913 bedrooms
- 04 bedrooms
- 05+ bedrooms

- Cars and other vehicles available in Bordentown in owner-occupied houses/condos
- 11no vehicle
- 3851 vehicle
- 3322 vehicles
- 1853 vehicles
- 434 vehicles
- 135+ vehicles

- Cars and other vehicles available in Bordentown in renter-occupied apartments
- 28no vehicle
- 5271 vehicle
- 3032 vehicles
- 413 vehicles
- 04 vehicles
- 05+ vehicles

- Rooms in owner-occupied houses in Bordentown, New Jersey
- 01 room
- 02 rooms
- 03 rooms
- 234 rooms
- 1595 rooms
- 3196 rooms
- 2247 rooms
- 638 rooms
- 1819+ rooms

- Rooms in renter-occupied apartments in Bordentown, New Jersey
- 81 room
- 852 rooms
- 3233 rooms
- 1614 rooms
- 2145 rooms
- 676 rooms
- 127 rooms
- 208 rooms
- 99+ rooms


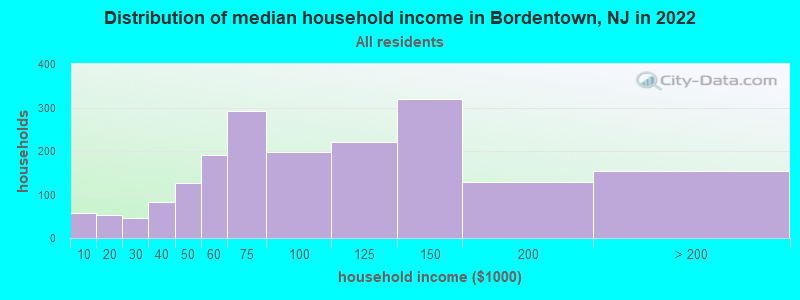
Bordentown, NJ household income distribution

- 57Less than $10,000
- 53$10,000 to $19,999
- 46$20,000 to $29,999
- 83$30,000 to $39,999
- 127$40,000 to $49,999
- 191$50,000 to $59,999
- 292$60,000 to $74,999
- 197$75,000 to $99,999
- 220$100,000 to $124,999
- 320$125,000 to $149,999
- 128$150,000 to $199,999
- 154$200,000 or more
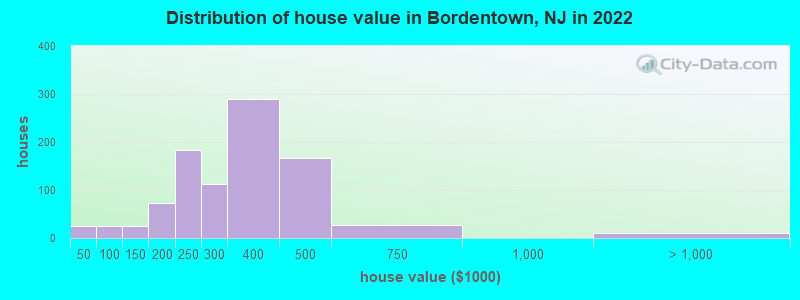
Home value of owner - occupied houses in 2022 in Bordentown, NJ
-
- 25$30,000 to $34,999
- 3$80,000 to $89,999
- 20$90,000 to $99,999
- 5$100,000 to $124,999
- 19$125,000 to $149,999
- 7$150,000 to $174,999
- 66$175,000 to $199,999
- 184$200,000 to $249,999
- 113$250,000 to $299,999
- 290$300,000 to $399,999
- 166$400,000 to $499,999
- 27$500,000 to $749,999
- 4$1,000,000 to $1,499,999
- 7$2,000,000 or more
Rent paid by renters in 2022 in Bordentown, NJ
-
- 8$450 to $499
- 23$550 to $599
- 9$600 to $649
- 49$750 to $799
- 21$800 to $899
- 76$900 to $999
- 253$1,000 to $1,249
- 82$1,250 to $1,499
- 296$1,500 to $1,999
- 32$2,000 to $2,499


Percentage of workers working in this county: 44.1%
Number of people working at home: 295 (13.0% of all workers)
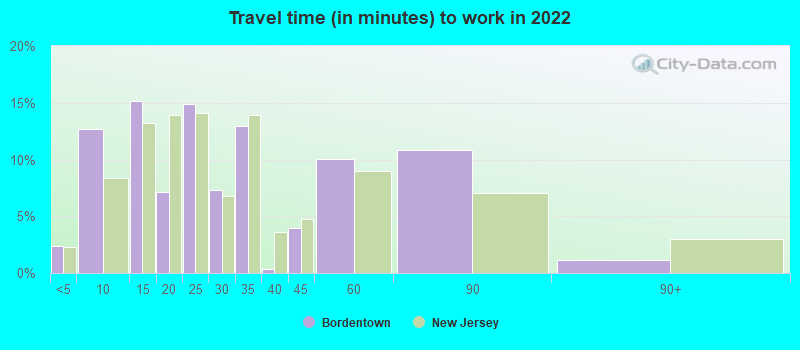
Travel time to work (commute)
- Less than 5 minutes: 116
- 5 to 9 minutes: 77
- 10 to 14 minutes: 218
- 15 to 19 minutes: 316
- 20 to 24 minutes: 480
- 25 to 29 minutes: 149
- 30 to 34 minutes: 299
- 35 to 39 minutes: 16
- 40 to 44 minutes: 67
- 45 to 59 minutes: 98
- 60 to 89 minutes: 78
- 90 or more minutes: 37
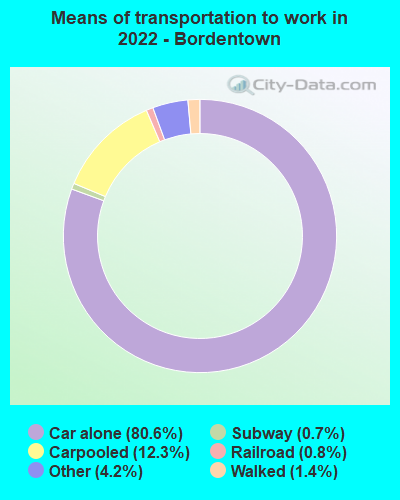
Means of transportation to work:
- Drove a car alone: 1,395 (67.1%)
- Carpooled: 272 (13.1%)
- Long-distance train or commuter rail: 9 (0.4%)
- Light rail, streetcar or trolley: 14 (0.7%)
- Taxi: 105 (5.1%)
- Walked: 22 (1.1%)
- Worked at home: 295 (14.2%)

- Unemployment by race in 2022
- Unemployment rate for White non-Hispanic residents
- 4.3%Males
- Unemployment rate for Black residents
- 7.0%Males
- Unemployment rate for two or more race residents
- 15.8%Males

- Year of entry for the foreign-born population in Bordentown, New Jersey
- 112010 or later
- 652000 to 2009
- 471990 to 1999
- 41980 to 1989
- 21970 to 1979
- 50Before 1970

First ancestries reported:
- Italian: 143 (10.9%)
- Irish: 130 (9.9%)
- American: 84 (6.4%)
- English: 75 (5.7%)
- European: 74 (5.6%)
- German: 63 (4.8%)
- Eastern European: 39 (3.0%)
- Slavic: 28 (2.1%)
- Polish: 27 (2.1%)
- Lithuanian: 24 (1.8%)
- Russian: 20 (1.5%)
- Swedish: 17 (1.3%)
- Greek: 16 (1.2%)
- Slovene: 16 (1.2%)
- French: 13 (1.0%)
- Slovak: 11 (0.8%)
- Albanian: 7 (0.5%)
- British: 7 (0.5%)
- Cypriot: 7 (0.5%)
- Scottish: 7 (0.5%)
Most common places of birth for foreign-born residents (%):
| Bordentown: | 29.8% (50) |
| New Jersey: | 3.7% (78,969) |
| Bordentown: | 15.5% (26) |
| New Jersey: | 2.2% (47,365) |
| Bordentown: | 11.9% (20) |
| New Jersey: | 4.2% (90,817) |
| Bordentown: | 8.9% (15) |
| New Jersey: | 0.3% (7,501) |
| Bordentown: | 7.1% (12) |
| New Jersey: | 0.9% (20,371) |
| Bordentown: | 7.1% (12) |
| New Jersey: | 0.6% (12,793) |
| Bordentown: | 6.0% (10) |
| New Jersey: | 2.2% (46,813) |
| Bordentown: | 4.8% (8) |
| New Jersey: | 9.7% (209,055) |
| Bordentown: | 2.4% (4) |
| New Jersey: | 2.3% (48,811) |
Place of birth for U.S.-born residents:
- This state: 2,656
- Other state: 1,106
- Northeast: 687
- Midwest: 189
- South: 197
- West: 36
78.9% of Bordentown residents lived in the same house 1 years ago.
Out of people who lived in different houses, 23.9% lived in this county.
Out of people who lived in different counties, 60.6% lived in New Jersey.
| Bordentown: | 78.9% |
| State average: | 90.4% |
Education attainment for males 25 years and older:
- No schooling: 15
- Nursery to 4th grade: 6
- 5th and 6th grade: 16
- 7th and 8th grade: 0
- 9th grade: 7
- 10th grade: 2
- 11th grade: 34
- 12th grade, no diploma: 11
- High school graduate (or equivalency): 450
- Less than 1 year of college: 113
- Some college more than 1 year, no degree: 183
- Associate degree: 45
- Bachelor's degree: 390
- Master's degree: 148
- Professional school degree: 46
- Doctorate degree: 27

Education attainment for females 25 years and older:
- No schooling: 0
- Nursery to 4th grade: 0
- 5th and 6th grade: 0
- 7th and 8th grade: 6
- 9th grade: 0
- 10th grade: 2
- 11th grade: 0
- 12th grade, no diploma: 103
- High school graduate (or equivalency): 344
- Less than 1 year of college: 64
- Some college more than 1 year, no degree: 194
- Associate degree: 127
- Bachelor's degree: 448
- Master's degree: 255
- Professional school degree: 27
- Doctorate degree: 22


Housing units in structures:
- One, detached: 628
- One, attached: 476
- Two: 237
- 3 or 4: 280
- 5 to 9: 92
- 10 to 19: 157
- 20 to 49: 65
- 50 or more: 153
Housing units lacking complete kitchen facilities in 2022: 0.3%
House/condo owner moved in on average 16 years ago
Renter moved in on average 3 years ago

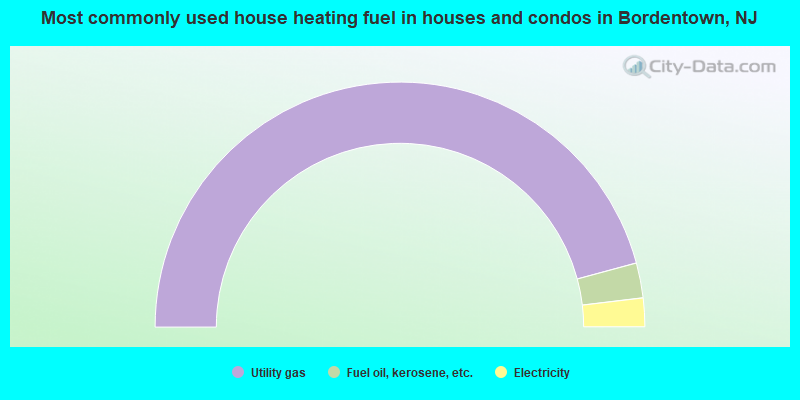
- 91.7%Utility gas
- 4.6%Fuel oil, kerosene, etc.
- 3.8%Electricity
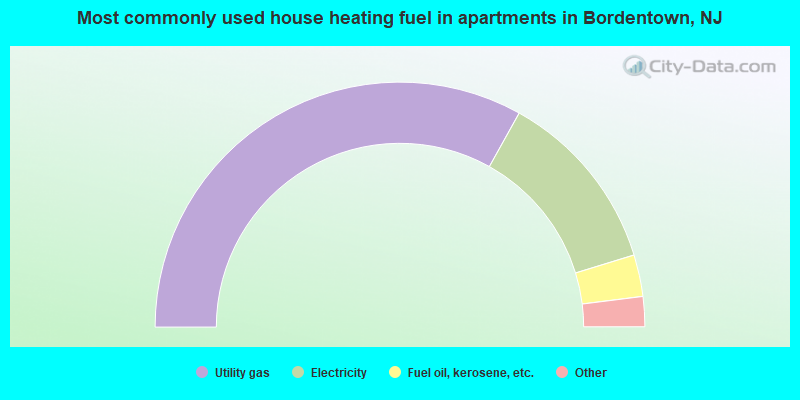
- 66.4%Utility gas
- 24.4%Electricity
- 5.5%Fuel oil, kerosene, etc.
- 1.8%No fuel used
- 1.0%Other fuel
- 0.9%Bottled, tank, or LP gas
Private vs. public school enrollment:
| Here: | 4.8% |
| New Jersey: | 12.3% |
| Here: | 9.1% |
| New Jersey: | 13.1% |
| Here: | 45.0% |
| New Jersey: | 33.2% |


