Boston, GA (Georgia) Houses and Residents
| Boston: | $111,873 |
| Georgia: | $297,400 |
Mean price in 2022:
Detached houses: $189,037
Here: $189,037 State: $376,364 Mobile homes: $61,389
Here: $61,389 State: $102,413
Total population: 1,322 (Urban population: 0, Rural population: 1,411 (17 farm, 1,394 nonfarm))
Houses: 584 (488 occupied: 248 owner occupied, 244 renter occupied)
| % of renters here: | 50% |
| State: | 34% |
Housing density: 262 houses/condos per square mile
Median price asked for vacant for-sale houses and condos in 2022 in this county: $283,101.
Median contract rent in 2022: $614 (lower quartile is $267, upper quartile is $779)
Median rent asked for vacant for-rent units in 2022: $427
Median gross rent in Boston, GA in 2022: $890
Housing units in Boston with a mortgage: 108 (11 second mortgage, 0 home equity loan, 0 both second mortgage and home equity loan)
Houses without a mortgage: 0
Median household income for houses/condos with a mortgage: $60,896
Median household income for apartments without a mortgage: $42,370
Median monthly housing costs: $674
Compare current foreclosures near Boston, GA:
| Photo | Address | Area | Beds / Baths | Price | Details |
|---|---|---|---|---|---|

|
#1
S Norton St
Boston, GA 31626
|
1,791 sq. feet
|
1 baths - beds |
show details | |

|
#2
E Jefferson St
Boston, GA 31626
|
900 sq. feet
|
1 baths - beds |
show details | |

|
#3
Salem Rd
Boston, GA 31626
|
3,400 sq. feet
|
2 baths - beds |
show details | |

|
#4
S Stephens St
Boston, GA 31626
|
1,060 sq. feet
|
1 baths - beds |
show details | |

|
#5
Coffee Rd
Boston, GA 31626
|
1,824 sq. feet
|
1 baths - beds |
show details | |

|
#6
N Main St
Boston, GA 31626
|
- sq. feet
|
- baths - beds |
show details | |

|
#7
Ga Highway 33
Boston, GA 31626
|
- sq. feet
|
- baths - beds |
show details | |

|
#8
Ozell Rd
Boston, GA 31626
|
- sq. feet
|
- baths - beds |
show details | |

|
#9
Paces Ln
Boston, GA 31626
|
- sq. feet
|
- baths - beds |
show details | |

|
#10
Horn St
Boston, GA 31626
|
- sq. feet
|
- baths - beds |
show details |
| Photo | Address | Area | Beds / Baths | Price | Details |
|---|---|---|---|---|---|

|
#11
Paces Ln
Boston, GA 31626
|
- sq. feet
|
- baths - beds |
show details | |

|
#12
Liberty Church Rd
Boston, GA 31626
|
- sq. feet
|
- baths - beds |
show details | |

|
#13
E Jackson St
Boston, GA 31626
|
- sq. feet
|
- baths - beds |
show details | |

|
#14
Madison Hwy
Quitman, GA 31643
|
1,800 sq. feet
|
2 baths 3 beds |
show details | |

|
#15
Ernest St
Thomasville, GA 31792
|
1,968 sq. feet
|
2 baths 3 beds |
show details | |

|
#16
E Buckhorn Trl
Greenville, FL 32331
|
1,568 sq. feet
|
2 baths 3 beds |
show details | |

|
#17
Greenleaf Ln
Thomasville, GA 31757
|
1,880 sq. feet
|
2 baths 3 beds |
show details | |

|
#18
Lansing St
Thomasville, GA 31792
|
1,040 sq. feet
|
1 baths 2 beds |
show details | |

|
#19
Willow Ridge Cir
Thomasville, GA 31757
|
2,670 sq. feet
|
3 baths 4 beds |
show details | |

|
#20
Lake Shore Dr
Thomasville, GA 31757
|
1,356 sq. feet
|
2 baths 3 beds |
show details |
| Photo | Address | Area | Beds / Baths | Price | Details |
|---|---|---|---|---|---|

|
#21
W Bay St
Quitman, GA 31643
|
1,040 sq. feet
|
1 baths 3 beds |
show details | |

|
#22
Ashville Hwy
Monticello, FL 32344
|
1,850 sq. feet
|
2 baths 3 beds |
show details | |

|
#23
Claire Dr
Thomasville, GA 31792
|
1,434 sq. feet
|
2 baths 3 beds |
show details | |

|
#24
N Lee St
Quitman, GA 31643
|
1,966 sq. feet
|
2 baths - beds |
show details | |

|
#25
Staff Sherrod Rd
Pavo, GA 31778
|
1,092 sq. feet
|
2 baths - beds |
show details | |

|
#26
Elizabeth St
Thomasville, GA 31792
|
936 sq. feet
|
2 baths - beds |
show details | |

|
#27
Webster Rd
Quitman, GA 31643
|
1,020 sq. feet
|
1 baths - beds |
show details | |

|
#28
E Calhoun St
Thomasville, GA 31792
|
1,156 sq. feet
|
1 baths - beds |
show details | |

|
#29
Lowery Ave
Thomasville, GA 31792
|
767 sq. feet
|
1 baths - beds |
show details | |

|
#30
Ayries Dr
Thomasville, GA 31792
|
1,384 sq. feet
|
2 baths - beds |
show details |
| Photo | Address | Area | Beds / Baths | Price | Details |
|---|---|---|---|---|---|

|
#31
N Court St
Quitman, GA 31643
|
2,774 sq. feet
|
4 baths - beds |
show details | |

|
#32
Fletcher St
Thomasville, GA 31792
|
1,040 sq. feet
|
1 baths - beds |
show details | |

|
#33
Maury St
Thomasville, GA 31792
|
1,676 sq. feet
|
1 baths - beds |
show details | |

|
#34
S Warren St
Quitman, GA 31643
|
1,014 sq. feet
|
2 baths - beds |
show details | |

|
#35
Airline Rd
Coolidge, GA 31738
|
2,038 sq. feet
|
1 baths - beds |
show details | |

|
#36
S Walker St
Quitman, GA 31643
|
1,192 sq. feet
|
1 baths - beds |
show details | |

|
#37
Jones St
Thomasville, GA 31792
|
1,104 sq. feet
|
1 baths - beds |
show details | |

|
#38
Moss Trl
Thomasville, GA 31792
|
3,179 sq. feet
|
3 baths - beds |
show details | |

|
#39
Magnolia St
Thomasville, GA 31792
|
1,403 sq. feet
|
1 baths - beds |
show details | |

|
#40
Centennial Rd
Coolidge, GA 31738
|
1,440 sq. feet
|
2 baths - beds |
show details |
| Photo | Address | Area | Beds / Baths | Price | Details |
|---|---|---|---|---|---|

|
#41
Allen St
Thomasville, GA 31792
|
1,544 sq. feet
|
1 baths - beds |
show details | |

|
#42
Jones St
Thomasville, GA 31792
|
1,152 sq. feet
|
1 baths - beds |
show details | |

|
#43
Dove Hill Cir
Thomasville, GA 31792
|
1,120 sq. feet
|
2 baths - beds |
show details | |

|
#44
Barnes St
Thomasville, GA 31792
|
852 sq. feet
|
1 baths - beds |
show details | |

|
#45
W Merrill St
Thomasville, GA 31792
|
1,219 sq. feet
|
1 baths - beds |
show details | |

|
#46
Raleigh Ave
Thomasville, GA 31792
|
1,200 sq. feet
|
1 baths - beds |
show details | |

|
#47
Festus St
Thomasville, GA 31792
|
1,170 sq. feet
|
1 baths - beds |
show details | |

|
#48
Alexander St
Thomasville, GA 31792
|
842 sq. feet
|
1 baths - beds |
show details | |

|
#49
Mckinley St
Thomasville, GA 31792
|
1,512 sq. feet
|
2 baths - beds |
show details | |

|
Check over 1 million property listings on Foreclosure.com!
|
browse all offers | |||

Latest news about housing in Boston, GA collected exclusively by city-data.com from local newspapers, TV, and radio stations


Median year apartment built: 1976
Household type by relationship:
Households: 1,127- Male householders: 152 (47 living alone), Female householders: 331 (112 living alone)
167 spouses (167 opposite-sex spouses), 16 unmarried partners, (16 opposite-sex unmarried partners), 362 children (354 natural, 8 adopted, 0 stepchildren), 42 grandchildren, 0 brothers or sisters, 39 parents, 0 foster children, 10 other relatives, 4 non-relatives
Size of family households: 111 2-persons, 132 3-persons, 67 4-persons, 11 5-persons, 2 6-persons.
Size of nonfamily households: 161 1-person, 5 2-persons.
69 married couples with children.
117 single-parent households (0 men, 117 women).
95.5% of residents of Boston speak English at home.
2.7% of residents speak Spanish at home (39% speak English very well, 29% speak English well, 32% speak English not well).
1.3% of residents speak other Indo-European language at home (79% speak English very well, 21% speak English not well).
Foreign born population: 16 (1.4%)
(25.0% of them are naturalized citizens)
| Here: | 6.2 |
| State: | 6.8 |
| Here: | 4.4 |
| State: | 4.6 |

- Bedrooms in owner-occupied houses and condos in Boston, Georgia
- 0no bedroom
- 31 bedroom
- 262 bedrooms
- 1803 bedrooms
- 364 bedrooms
- 35+ bedrooms

- Bedrooms in renter-occupied apartments in Boston, Georgia
- 0no bedroom
- 331 bedroom
- 1042 bedrooms
- 1043 bedrooms
- 44 bedrooms
- 05+ bedrooms

- Cars and other vehicles available in Boston in owner-occupied houses/condos
- 4no vehicle
- 481 vehicle
- 1012 vehicles
- 833 vehicles
- 114 vehicles
- 25+ vehicles

- Cars and other vehicles available in Boston in renter-occupied apartments
- 26no vehicle
- 1591 vehicle
- 492 vehicles
- 93 vehicles
- 24 vehicles
- 05+ vehicles

- Rooms in owner-occupied houses in Boston, Georgia
- 01 room
- 32 rooms
- 33 rooms
- 184 rooms
- 585 rooms
- 626 rooms
- 357 rooms
- 308 rooms
- 399+ rooms

- Rooms in renter-occupied apartments in Boston, Georgia
- 01 room
- 02 rooms
- 343 rooms
- 974 rooms
- 755 rooms
- 106 rooms
- 257 rooms
- 38 rooms
- 09+ rooms


Boston, GA household income distribution

- 34Less than $10,000
- 116$10,000 to $19,999
- 68$20,000 to $29,999
- 44$30,000 to $39,999
- 22$40,000 to $49,999
- 20$50,000 to $59,999
- 61$60,000 to $74,999
- 76$75,000 to $99,999
- 28$100,000 to $124,999
- 8$125,000 to $149,999
- 8$150,000 to $199,999

Home value of owner - occupied houses in 2022 in Boston, GA
-
- 4$10,000 to $14,999
- 10$15,000 to $19,999
- 20$20,000 to $24,999
- 3$25,000 to $29,999
- 17$30,000 to $34,999
- 4$35,000 to $39,999
- 10$40,000 to $49,999
- 19$50,000 to $59,999
- 12$70,000 to $79,999
- 2$80,000 to $89,999
- 7$90,000 to $99,999
- 7$100,000 to $124,999
- 4$125,000 to $149,999
- 21$150,000 to $174,999
- 3$175,000 to $199,999
- 28$200,000 to $249,999
- 17$250,000 to $299,999
- 3$300,000 to $399,999
- 3$400,000 to $499,999
- 7$1,000,000 to $1,499,999

Rent paid by renters in 2022 in Boston, GA
-
- 18Less than $100
- 7$100 to $149
- 19$150 to $199
- 6$200 to $249
- 9$250 to $299
- 6$300 to $349
- 11$400 to $449
- 5$450 to $499
- 6$500 to $549
- 22$550 to $599
- 19$600 to $649
- 22$650 to $699
- 8$700 to $749
- 45$750 to $799
- 4$900 to $999
- 6$1,500 to $1,999
- 6No cash rent


Percentage of workers working in this county: 81.9%
Number of people working at home: 20 (3.9% of all workers)
Travel time to work (commute)
- Less than 5 minutes: 5
- 5 to 9 minutes: 17
- 10 to 14 minutes: 28
- 15 to 19 minutes: 143
- 20 to 24 minutes: 147
- 25 to 29 minutes: 35
- 30 to 34 minutes: 13
- 35 to 39 minutes: 7
- 40 to 44 minutes: 0
- 45 to 59 minutes: 50
- 60 to 89 minutes: 11
- 90 or more minutes: 8
Means of transportation to work:
- Drove a car alone: 331 (74.5%)
- Carpooled: 79 (17.8%)
- Bus or trolley bus: 6 (1.4%)
- Walked: 5 (1.1%)
- Other means: 12 (2.7%)
- Worked at home: 11 (2.5%)

- Unemployment by race in 2022
- Unemployment rate for Black residents
- 16.1%Males
- 12.6%Females

- Year of entry for the foreign-born population in Boston, Georgia
- 52010 or later
- 02000 to 2009
- 01990 to 1999
- 01980 to 1989
- 51970 to 1979
- 4Before 1970
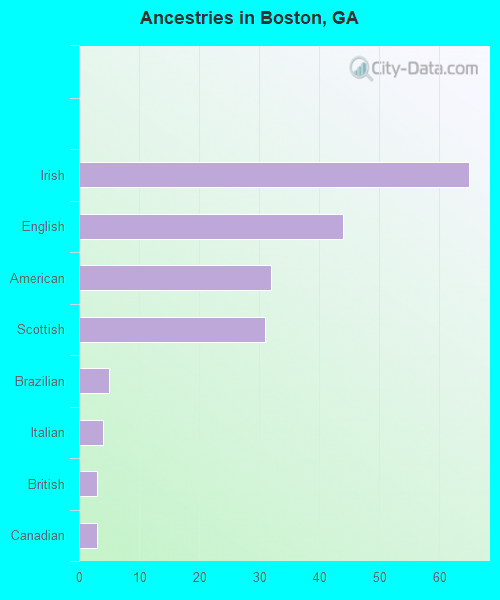
First ancestries reported:
- Irish: 65 (8.6%)
- English: 44 (5.8%)
- American: 32 (4.3%)
- Scottish: 31 (4.1%)
- Brazilian: 5 (0.7%)
- Italian: 4 (0.5%)
- British: 3 (0.4%)
- Canadian: 3 (0.4%)
Most common places of birth for foreign-born residents (%):
| Boston: | 43.8% (7) |
| Georgia: | 20.0% (223,400) |
| Boston: | 25.0% (4) |
| Georgia: | 0.3% (3,777) |
| Boston: | 18.8% (3) |
| Georgia: | 0.2% (2,552) |
Place of birth for U.S.-born residents:
- This state: 916
- Other state: 169
- Northeast: 1
- Midwest: 8
- South: 130
- West: 30
97.8% of Boston residents lived in the same house 1 years ago.
Out of people who lived in different houses, 48.1% lived in this county.
| Boston: | 97.8% |
| State average: | 86.6% |
Education attainment for males 25 years and older:
- No schooling: 0
- Nursery to 4th grade: 4
- 5th and 6th grade: 0
- 7th and 8th grade: 0
- 9th grade: 1
- 10th grade: 0
- 11th grade: 5
- 12th grade, no diploma: 4
- High school graduate (or equivalency): 125
- Less than 1 year of college: 6
- Some college more than 1 year, no degree: 52
- Associate degree: 37
- Bachelor's degree: 32
- Master's degree: 2
- Professional school degree: 4
- Doctorate degree: 0

Education attainment for females 25 years and older:
- No schooling: 0
- Nursery to 4th grade: 0
- 5th and 6th grade: 0
- 7th and 8th grade: 0
- 9th grade: 0
- 10th grade: 17
- 11th grade: 35
- 12th grade, no diploma: 17
- High school graduate (or equivalency): 238
- Less than 1 year of college: 39
- Some college more than 1 year, no degree: 45
- Associate degree: 49
- Bachelor's degree: 46
- Master's degree: 11
- Professional school degree: 0
- Doctorate degree: 0


Housing units in structures:
- One, detached: 286
- Two: 11
- 3 or 4: 60
- 5 to 9: 35
- 10 to 19: 4
- 20 to 49: 5
- Mobile homes: 178
- Boats, RVs, vans, etc.: 3
Median worth of mobile homes: $55,493
Housing units lacking complete kitchen facilities in 2022: 3.5%
House/condo owner moved in on average 18 years ago
Renter moved in on average 6 years ago


Private vs. public school enrollment:
| Here: | 10.3% |
| Georgia: | 12.1% |
| Here: | 0.0% |
| Georgia: | 10.8% |
| Here: | 13.1% |
| Georgia: | 17.1% |


