Bovill, ID (Idaho) Houses and Residents
| Bovill: | $118,038 |
| Idaho: | $432,500 |
Mean price in 2022:
Detached houses: $115,806
Here: $115,806 State: $527,539 Mobile homes: $79,201
Here: $79,201 State: $150,232
Total population: 255 (Urban population: 0, Rural population: 322 (all nonfarm))
Houses: 96 (76 occupied: 75 owner occupied, 2 renter occupied)
| % of renters here: | 3% |
| State: | 28% |
Housing density: 536 houses/condos per square mile
Median price asked for vacant for-sale houses and condos in 2022 in this county: $230,468.
Median gross rent in Bovill, ID in 2022: $-715,048,695
Housing units in Bovill with a mortgage: 18 (6 second mortgage, 0 home equity loan, 6 both second mortgage and home equity loan)
Houses without a mortgage: 0
Median household income for houses/condos with a mortgage: $86,438
Median household income for apartments without a mortgage: $40,636
Median monthly housing costs: $391
Compare current foreclosures near your location:
| Photo | Address | Area | Beds / Baths | Price | Details |
|---|---|---|---|---|---|

|
#1
Bayberry Cir
Columbus, OH 43207
|
1,564 sq. feet
|
1 baths 3 beds |
$127,500
|
show details |

|
#2
S High St
Columbus, OH 43207
|
1,678 sq. feet
|
2 baths 4 beds |
$31,900
|
show details |

|
#3
E 21st Ave
Columbus, OH 43211
|
1,061 sq. feet
|
1 baths 3 beds |
$179,900
|
show details |

|
#4
Roundelay Rd N
Reynoldsburg, OH 43068
|
1,712 sq. feet
|
2 baths 3 beds |
show details | |

|
#5
E Howard Rd
Columbus, OH 43207
|
1,056 sq. feet
|
1 baths 3 beds |
show details | |

|
#6
London Groveport Rd
Grove City, OH 43123
|
816 sq. feet
|
1 baths 2 beds |
show details | |

|
#7
Chidley St
Galloway, OH 43119
|
1,502 sq. feet
|
1 baths 3 beds |
show details | |

|
#8
Summertree Ln
Westerville, OH 43081
|
2,496 sq. feet
|
2 baths 3 beds |
show details | |

|
#9
E Lincoln Ave
Columbus, OH 43214
|
874 sq. feet
|
1 baths 3 beds |
show details | |

|
#10
Fergus Rd
Grove City, OH 43123
|
3,312 sq. feet
|
2 baths 4 beds |
show details |
| Photo | Address | Area | Beds / Baths | Price | Details |
|---|---|---|---|---|---|

|
#11
Rosewood Ct
Powell, OH 43065
|
2,801 sq. feet
|
3 baths 4 beds |
show details | |

|
#12
Armada Rd
Columbus, OH 43232
|
1,028 sq. feet
|
1 baths 4 beds |
show details | |

|
#13
N Roys Ave
Columbus, OH 43204
|
1,248 sq. feet
|
2 baths 3 beds |
show details | |

|
#14
N Roys Ave
Columbus, OH 43204
|
648 sq. feet
|
2 baths 3 beds |
show details | |

|
#15
S Richardson Ave
Columbus, OH 43204
|
1,520 sq. feet
|
2 baths 3 beds |
show details | |

|
#16
Meadowbrook Dr
Columbus, OH 43207
|
1,752 sq. feet
|
2 baths 4 beds |
show details | |

|
#17
Executive Ct
Westerville, OH 43081
|
1,811 sq. feet
|
2 baths 3 beds |
show details | |

|
#18
High Free Pike
West Jefferson, OH 43162
|
1,216 sq. feet
|
2 baths 4 beds |
show details | |

|
#19
Falls Peak Ln
Delaware, OH 43015
|
1,352 sq. feet
|
2 baths 2 beds |
show details | |

|
#20
Ashgrove Dr
Grove City, OH 43123
|
1,772 sq. feet
|
2 baths 4 beds |
show details |
| Photo | Address | Area | Beds / Baths | Price | Details |
|---|---|---|---|---|---|

|
#21
Lehner Rd
Columbus, OH 43224
|
1,628 sq. feet
|
2 baths 4 beds |
show details | |

|
#22
Grasmere Ave
Columbus, OH 43211
|
720 sq. feet
|
1 baths 2 beds |
show details | |

|
#23
E Welch Ave
Columbus, OH 43207
|
1,864 sq. feet
|
2 baths 4 beds |
show details | |

|
#24
Wrexham Ave
Columbus, OH 43223
|
1,235 sq. feet
|
1 baths 3 beds |
show details | |

|
#25
Kelton Ave
Columbus, OH 43206
|
1,080 sq. feet
|
1 baths 3 beds |
show details | |

|
#26
Hamilton Ave
Columbus, OH 43211
|
1,061 sq. feet
|
1 baths 3 beds |
show details | |

|
#27
Striebel Ct
Columbus, OH 43227
|
925 sq. feet
|
1 baths 3 beds |
show details | |

|
#28
S Champion Ave
Columbus, OH 43207
|
1,157 sq. feet
|
1 baths 2 beds |
show details | |

|
#29
Fairfield Ave
Columbus, OH 43203
|
984 sq. feet
|
1 baths 2 beds |
show details | |

|
#30
N 18th St
Columbus, OH 43203
|
1,690 sq. feet
|
1 baths 4 beds |
show details |
| Photo | Address | Area | Beds / Baths | Price | Details |
|---|---|---|---|---|---|

|
#31
Cannonade Ct
Columbus, OH 43230
|
2,023 sq. feet
|
2 baths 3 beds |
show details | |

|
#32
Glenmate Ct
Columbus, OH 43223
|
1,050 sq. feet
|
1 baths 3 beds |
show details | |

|
#33
Safford Ave
Columbus, OH 43223
|
784 sq. feet
|
1 baths 2 beds |
show details | |

|
#34
Chester Rd
Columbus, OH 43221
|
3,300 sq. feet
|
4 baths 5 beds |
show details | |

|
#35
Upton Rd E
Columbus, OH 43232
|
852 sq. feet
|
1 baths 3 beds |
show details | |

|
#36
Whittman Ct
Plain City, OH 43064
|
3,186 sq. feet
|
3 baths 4 beds |
show details | |

|
#37
Hildreth Ave
Columbus, OH 43203
|
1,798 sq. feet
|
2 baths 4 beds |
show details | |

|
#38
Gladys Rd
Columbus, OH 43228
|
832 sq. feet
|
1 baths 3 beds |
show details | |

|
#39
Mccutcheon Rd
Columbus, OH 43219
|
2,130 sq. feet
|
2 baths 3 beds |
show details | |

|
#40
Hedgerow Rd
Columbus, OH 43220
|
1,102 sq. feet
|
2 baths 2 beds |
show details |
| Photo | Address | Area | Beds / Baths | Price | Details |
|---|---|---|---|---|---|

|
#41
Stephen St
Grove City, OH 43123
|
1,027 sq. feet
|
1 baths 3 beds |
show details | |

|
#42
Messner Dr
Hilliard, OH 43026
|
832 sq. feet
|
1 baths 2 beds |
show details | |

|
#43
Falene Pl
Galloway, OH 43119
|
1,178 sq. feet
|
1 baths 3 beds |
show details | |

|
#44
Autumn Wind Dr
Grove City, OH 43123
|
1,697 sq. feet
|
2 baths 3 beds |
show details | |

|
#45
Wesson Dr
Columbus, OH 43232
|
1,200 sq. feet
|
1 baths 3 beds |
show details | |

|
#46
Stoneybrook B 21a
Hilliard, OH 43026
|
1,031 sq. feet
|
1 baths 3 beds |
show details | |

|
#47
Almont Dr
Columbus, OH 43229
|
1,563 sq. feet
|
2 baths 5 beds |
show details | |

|
#48
Windy Hill Ln
Galloway, OH 43119
|
1,350 sq. feet
|
2 baths 3 beds |
show details | |

|
#49
Conway Dr
Columbus, OH 43227
|
1,225 sq. feet
|
1 baths 3 beds |
show details | |

|
Check over 1 million property listings on Foreclosure.com!
|
browse all offers | |||

Latest news about housing in Bovill, ID collected exclusively by city-data.com from local newspapers, TV, and radio stations

 | This is what America used to be (10 replies) |

Household type by relationship:
Households: 204- Male householders: 29 (10 living alone), Female householders: 47 (3 living alone)
56 spouses (56 opposite-sex spouses), 4 unmarried partners, (4 opposite-sex unmarried partners), 51 children (50 natural, 0 adopted, 1 stepchildren), 13 grandchildren, 0 brothers or sisters, 0 parents, 0 foster children, 2 other relatives, 1 non-relatives
Size of family households: 30 2-persons, 14 3-persons, 5 4-persons, 6 5-persons, 5 7-or-more-persons.
Size of nonfamily households: 13 1-person, 1 2-persons.
38 married couples with children.
0 single-parent households (0 men, 0 women).
All residents speak only English at home
| Here: | 6.1 |
| State: | 6.5 |
| Here: | -666666666.0 |
| State: | 4.4 |

- Bedrooms in owner-occupied houses and condos in Bovill, Idaho
- 5no bedroom
- 41 bedroom
- 192 bedrooms
- 343 bedrooms
- 134 bedrooms
- 05+ bedrooms

- Bedrooms in renter-occupied apartments in Bovill, Idaho
- 0no bedroom
- 01 bedroom
- 22 bedrooms
- 03 bedrooms
- 04 bedrooms
- 05+ bedrooms

- Cars and other vehicles available in Bovill in owner-occupied houses/condos
- 3no vehicle
- 191 vehicle
- 282 vehicles
- 173 vehicles
- 84 vehicles
- 05+ vehicles

- Cars and other vehicles available in Bovill in renter-occupied apartments
- 0no vehicle
- 11 vehicle
- 12 vehicles
- 03 vehicles
- 04 vehicles
- 05+ vehicles

- Rooms in owner-occupied houses in Bovill, Idaho
- 01 room
- 02 rooms
- 63 rooms
- 144 rooms
- 75 rooms
- 146 rooms
- 227 rooms
- 118 rooms
- 19+ rooms

- Rooms in renter-occupied apartments in Bovill, Idaho
- 01 room
- 02 rooms
- 03 rooms
- 04 rooms
- 05 rooms
- 16 rooms
- 17 rooms
- 08 rooms
- 09+ rooms


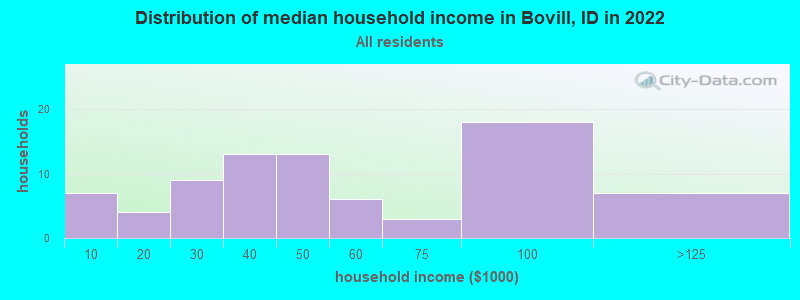
Bovill, ID household income distribution

- 7Less than $10,000
- 4$10,000 to $19,999
- 9$20,000 to $29,999
- 13$30,000 to $39,999
- 13$40,000 to $49,999
- 6$50,000 to $59,999
- 3$60,000 to $74,999
- 18$75,000 to $99,999
- 7$100,000 to $124,999
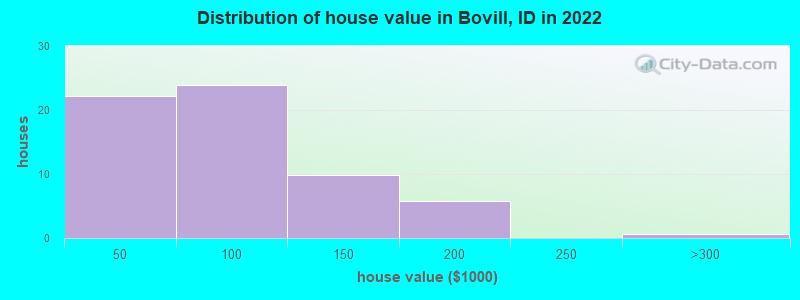
Home value of owner - occupied houses in 2022 in Bovill, ID
-
- 2$10,000 to $14,999
- 1$15,000 to $19,999
- 4$20,000 to $24,999
- 2$25,000 to $29,999
- 4$35,000 to $39,999
- 8$40,000 to $49,999
- 1$50,000 to $59,999
- 7$70,000 to $79,999
- 1$80,000 to $89,999
- 5$90,000 to $99,999
- 8$100,000 to $124,999
- 1$125,000 to $149,999
- 3$150,000 to $174,999
- 2$175,000 to $199,999
- 0$250,000 to $299,999

Percentage of workers working in this county: 68.9%
Number of people working at home: 0 (0.0% of all workers)
Travel time to work (commute)
- Less than 5 minutes: 4
- 5 to 9 minutes: 0
- 10 to 14 minutes: 0
- 15 to 19 minutes: 5
- 20 to 24 minutes: 10
- 25 to 29 minutes: 7
- 30 to 34 minutes: 8
- 35 to 39 minutes: 0
- 40 to 44 minutes: 0
- 45 to 59 minutes: 1
- 60 to 89 minutes: 23
- 90 or more minutes: 0
Means of transportation to work:
- Drove a car alone: 85 (72.6%)
- Carpooled: 21 (17.9%)
- Walked: 7 (6.0%)
- Worked at home: 4 (3.4%)

- Unemployment by race in 2022
- Unemployment rate for White non-Hispanic residents
- 3.3%Males
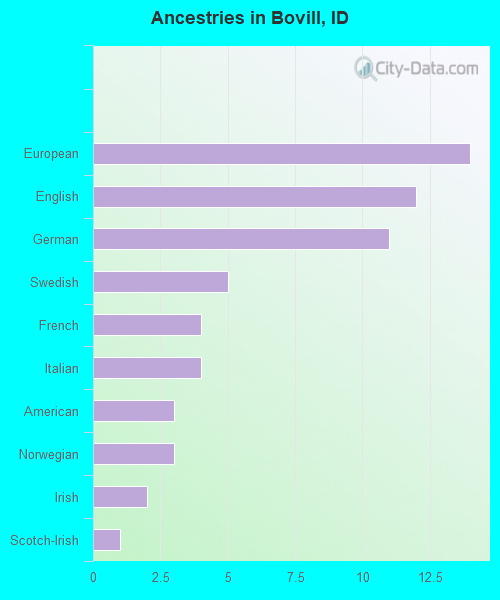
First ancestries reported:
- European: 14 (15.8%)
- English: 12 (13.5%)
- German: 11 (12.4%)
- Swedish: 5 (5.6%)
- French: 4 (4.5%)
- Italian: 4 (4.5%)
- American: 3 (3.4%)
- Norwegian: 3 (3.4%)
- Irish: 2 (2.3%)
- Scotch-Irish: 1 (1.1%)
Place of birth for U.S.-born residents:
- This state: 86
- Other state: 119
- Northeast: 2
- Midwest: 7
- South: 8
- West: 101
86.3% of Bovill residents lived in the same house 1 years ago.
Out of people who lived in different houses, 3.6% lived in this county.
Out of people who lived in different counties, 84.6% lived in Idaho.
| Bovill: | 86.3% |
| State average: | 85.1% |
Education attainment for males 25 years and older:
- No schooling: 0
- Nursery to 4th grade: 0
- 5th and 6th grade: 0
- 7th and 8th grade: 0
- 9th grade: 0
- 10th grade: 0
- 11th grade: 3
- 12th grade, no diploma: 3
- High school graduate (or equivalency): 38
- Less than 1 year of college: 0
- Some college more than 1 year, no degree: 21
- Associate degree: 5
- Bachelor's degree: 0
- Master's degree: 0
- Professional school degree: 0
- Doctorate degree: 0

Education attainment for females 25 years and older:
- No schooling: 0
- Nursery to 4th grade: 0
- 5th and 6th grade: 0
- 7th and 8th grade: 0
- 9th grade: 0
- 10th grade: 1
- 11th grade: 1
- 12th grade, no diploma: 3
- High school graduate (or equivalency): 33
- Less than 1 year of college: 7
- Some college more than 1 year, no degree: 1
- Associate degree: 13
- Bachelor's degree: 2
- Master's degree: 0
- Professional school degree: 0
- Doctorate degree: 2


Housing units in structures:
- One, detached: 66
- Mobile homes: 30
Housing units lacking complete kitchen facilities in 2022: 5.4%

Private vs. public school enrollment:
| Here: | 0.0% |
| Idaho: | 13.5% |
| Here: | 25.0% |
| Idaho: | 8.5% |


