Bow, WA (Washington) Houses and Residents
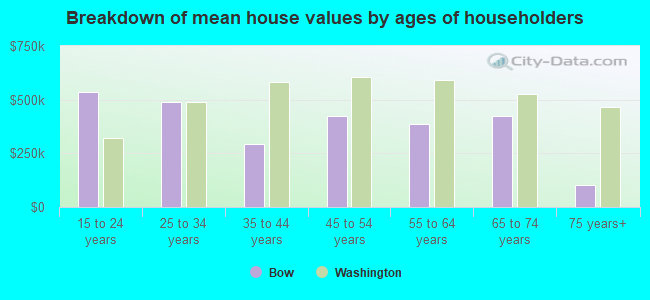
| Bow: | $593,124 |
| Washington: | $569,500 |
Total population: 6,099 (Urban population: 0, Rural population: 5,472 (227 farm, 5,245 nonfarm))
Houses: 2,255 (2,065 occupied: 1,739 owner occupied, 326 renter occupied)
| % of renters here: | 16% |
| State: | 36% |
Housing density: 31 houses/condos per square mile
Median price asked for vacant for-sale houses and condos in 2022 in this county: $430,980.
Median contract rent in 2022: $1,352 (lower quartile is $1,043, upper quartile is over $2,000)
Median gross rent in Bow, WA in 2022: $1,497
Housing units in Bow with a mortgage: 737 (81 second mortgage, 145 home equity loan, 0 both second mortgage and home equity loan)
Houses without a mortgage: 241
Compare current foreclosures near Bow, WA:
| Photo | Address | Area | Beds / Baths | Price | Details |
|---|---|---|---|---|---|

|
#1
Roney Rd
Bow, WA 98232
|
672 sq. feet
|
1 baths - beds |
show details | |

|
#2
Mactaggart Ave
Bow, WA 98232
|
- sq. feet
|
- baths - beds |
show details | |

|
#3
Halloran Rd
Bow, WA 98232
|
- sq. feet
|
- baths - beds |
show details | |

|
#4
Sunset Ave
Anacortes, WA 98221
|
1,584 sq. feet
|
1 baths 2 beds |
show details | |

|
#5
15th St
Bellingham, WA 98225
|
2,970 sq. feet
|
2 baths 3 beds |
show details | |

|
#6
M Ave
Anacortes, WA 98221
|
1,420 sq. feet
|
2 baths 3 beds |
show details | |

|
#7
Aqua Ln
Anacortes, WA 98221
|
2,608 sq. feet
|
2 baths 3 beds |
show details | |

|
#8
Mount Baker Loop
Mount Vernon, WA 98273
|
2,743 sq. feet
|
2 baths 4 beds |
show details | |

|
#9
Marigold Dr Unit 36
Bellingham, WA 98229
|
460 sq. feet
|
1 baths 1 beds |
show details | |

|
#10
Porter St
Mount Vernon, WA 98273
|
2,116 sq. feet
|
1 baths 3 beds |
show details |
| Photo | Address | Area | Beds / Baths | Price | Details |
|---|---|---|---|---|---|

|
#11
Fruitdale Rd
Sedro Woolley, WA 98284
|
1,188 sq. feet
|
2 baths 3 beds |
show details | |

|
#12
Wildflower Way
Sedro Woolley, WA 98284
|
908 sq. feet
|
1 baths 2 beds |
show details | |

|
#13
Wildflower Way
Sedro Woolley, WA 98284
|
904 sq. feet
|
1 baths 2 beds |
show details | |

|
#14
Fidalgo Pl
Sedro Woolley, WA 98284
|
1,259 sq. feet
|
2 baths 3 beds |
show details | |

|
#15
Mashie St
Anacortes, WA 98221
|
1,152 sq. feet
|
1 baths 2 beds |
show details | |

|
#16
Porter St
Mount Vernon, WA 98273
|
1,364 sq. feet
|
1 baths 3 beds |
show details | |

|
#17
Marigold Dr
Bellingham, WA 98229
|
2,182 sq. feet
|
3 baths 3 beds |
show details | |

|
#18
Michigan St # A
Bellingham, WA 98229
|
2,472 sq. feet
|
2 baths 2 beds |
show details | |

|
#19
Mclean Rd
Mount Vernon, WA 98273
|
1,262 sq. feet
|
2 baths 2 beds |
show details | |

|
#20
N Laventure Rd
Mount Vernon, WA 98273
|
960 sq. feet
|
1 baths 3 beds |
show details |
| Photo | Address | Area | Beds / Baths | Price | Details |
|---|---|---|---|---|---|

|
#21
Yew Street Rd
Bellingham, WA 98229
|
1,120 sq. feet
|
1 baths 2 beds |
show details | |

|
#22
N Belair Dr
Mount Vernon, WA 98273
|
1,120 sq. feet
|
1 baths 3 beds |
show details | |

|
#23
W Alder Dr
Sedro Woolley, WA 98284
|
2,365 sq. feet
|
2 baths 3 beds |
show details | |

|
#24
Prairie Rd
Sedro Woolley, WA 98284
|
1,024 sq. feet
|
1 baths 3 beds |
show details | |

|
#25
Marine Heights Way
Anacortes, WA 98221
|
2,175 sq. feet
|
2 baths 3 beds |
show details | |

|
#26
N 17th St
Mount Vernon, WA 98273
|
2,780 sq. feet
|
3 baths 5 beds |
show details | |

|
#27
Gardner Rd
Burlington, WA 98233
|
1,542 sq. feet
|
2 baths 4 beds |
show details | |

|
#28
Old Samish Rd
Bellingham, WA 98229
|
2,240 sq. feet
|
2 baths 6 beds |
show details | |

|
#29
Firwood Ln Apt 207
Mount Vernon, WA 98273
|
1,307 sq. feet
|
2 baths 3 beds |
show details | |

|
#30
N 18th Pl
Mount Vernon, WA 98273
|
1,184 sq. feet
|
3 baths 3 beds |
show details |
| Photo | Address | Area | Beds / Baths | Price | Details |
|---|---|---|---|---|---|

|
#31
Horseshoe Cir
Bellingham, WA 98229
|
1,229 sq. feet
|
2 baths 2 beds |
show details | |

|
#32
N Waugh Rd
Mount Vernon, WA 98273
|
1,612 sq. feet
|
2 baths 3 beds |
show details | |

|
#33
21st St
Anacortes, WA 98221
|
2,338 sq. feet
|
3 baths 5 beds |
show details | |

|
#34
27th St
Anacortes, WA 98221
|
1,579 sq. feet
|
2 baths 4 beds |
show details | |

|
#35
12th St
Bellingham, WA 98225
|
1,914 sq. feet
|
2 baths 3 beds |
show details | |

|
#36
Karli St
Mount Vernon, WA 98274
|
1,656 sq. feet
|
2 baths 3 beds |
show details | |

|
#37
Lincoln St Unit 123
Bellingham, WA 98229
|
784 sq. feet
|
1 baths 2 beds |
show details | |

|
#38
Otis St
Bellingham, WA 98225
|
726 sq. feet
|
1 baths 2 beds |
show details | |

|
#39
S State St Apt 416
Bellingham, WA 98225
|
815 sq. feet
|
1 baths 1 beds |
show details | |

|
#40
Cleveland Ave
Mount Vernon, WA 98273
|
888 sq. feet
|
1 baths 3 beds |
show details |
| Photo | Address | Area | Beds / Baths | Price | Details |
|---|---|---|---|---|---|

|
#41
Ellis St
Bellingham, WA 98225
|
952 sq. feet
|
2 baths 2 beds |
show details | |

|
#42
Dover St
Bellingham, WA 98226
|
1,606 sq. feet
|
2 baths 3 beds |
show details | |

|
#43
S 19th St
Mount Vernon, WA 98274
|
1,462 sq. feet
|
1 baths 4 beds |
show details | |

|
#44
15th St
Anacortes, WA 98221
|
1,040 sq. feet
|
1 baths 3 beds |
show details | |

|
#45
W 3rd St
Anacortes, WA 98221
|
1,028 sq. feet
|
3 baths 4 beds |
show details | |

|
#46
S 22nd Pl # B
Mount Vernon, WA 98274
|
2,516 sq. feet
|
3 baths 2 beds |
show details | |

|
#47
W Hazel St
Mount Vernon, WA 98273
|
1,401 sq. feet
|
3 baths 6 beds |
show details | |

|
#48
Ridge Way
Mount Vernon, WA 98273
|
2,929 sq. feet
|
3 baths 3 beds |
show details | |

|
#49
Flynn St Spc 51
Bellingham, WA 98229
|
784 sq. feet
|
1 baths 2 beds |
show details | |

|
Check over 1 million property listings on Foreclosure.com!
|
browse all offers | |||

Household type by relationship:
Households: 115,277- In family households: 96,098 (22,309 male householders, 8,347 female householders)
23,747 spouses, 31,478 children (28,838 natural, 950 adopted, 1,690 stepchildren), 2,114 grandchildren, 1,110 brothers or sisters, 871 parents, foster children, 1,654 other relatives, 3,690 non-relatives
- In nonfamily households: 19,179 (7,200 male householders (5,248 living alone)), 7,701 female householders (6,396 living alone)), 4,278 nonrelatives
- In group quarters: 1,624 (650 institutionalized population)
18,368 married couples with children.
5,970 single-parent households (1,535 men, 4,435 women).
94.6% of residents of Bow speak English at home.
4.6% of residents speak Spanish at home (30% speak English very well, 32% speak English well, 25% speak English not well, 13% don't speak English at all).
0.8% of residents speak other Indo-European language at home (100% speak English very well).
Foreign born population: 351 (5.0%)
(60.4% of them are naturalized citizens)
| Here: | 6.2 |
| State: | 6.5 |
| Here: | 5.0 |
| State: | 3.9 |
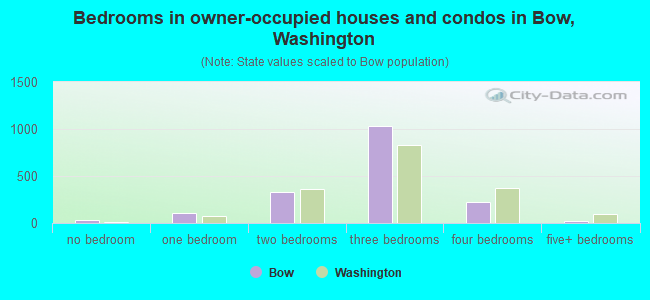
- Bedrooms in owner-occupied houses and condos in Bow, Washington
- 32no bedroom
- 1021 bedroom
- 3272 bedrooms
- 1,0363 bedrooms
- 2244 bedrooms
- 185+ bedrooms
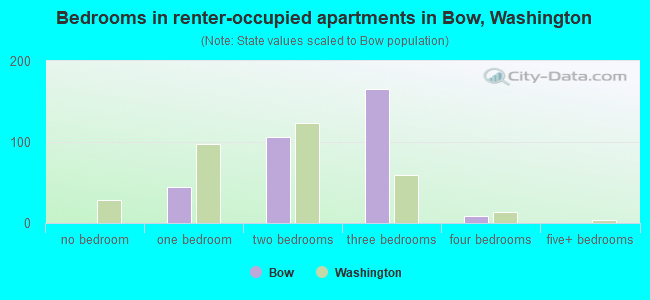
- Bedrooms in renter-occupied apartments in Bow, Washington
- 0no bedroom
- 451 bedroom
- 1062 bedrooms
- 1663 bedrooms
- 94 bedrooms
- 05+ bedrooms
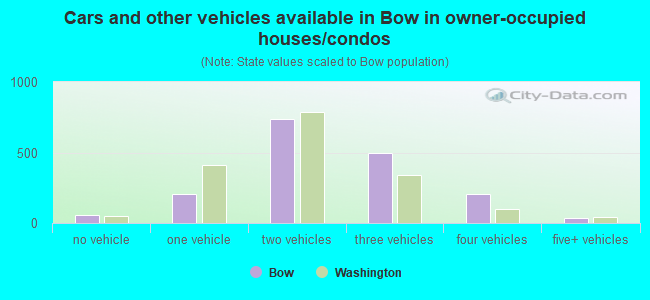
- Cars and other vehicles available in Bow in owner-occupied houses/condos
- 60no vehicle
- 2041 vehicle
- 7362 vehicles
- 4953 vehicles
- 2054 vehicles
- 395+ vehicles
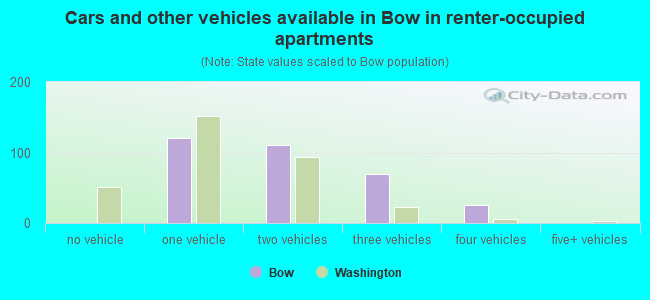
- Cars and other vehicles available in Bow in renter-occupied apartments
- 0no vehicle
- 1201 vehicle
- 1112 vehicles
- 693 vehicles
- 264 vehicles
- 05+ vehicles
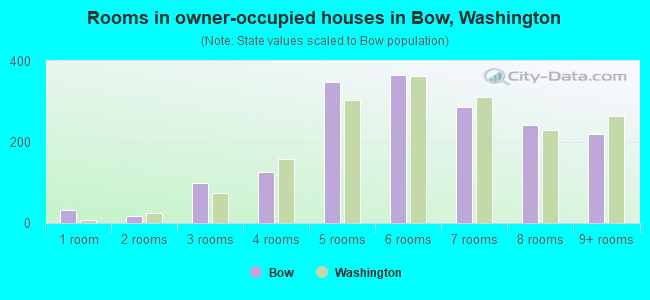
- Rooms in owner-occupied houses in Bow, Washington
- 321 room
- 182 rooms
- 1003 rooms
- 1254 rooms
- 3495 rooms
- 3666 rooms
- 2867 rooms
- 2438 rooms
- 2209+ rooms
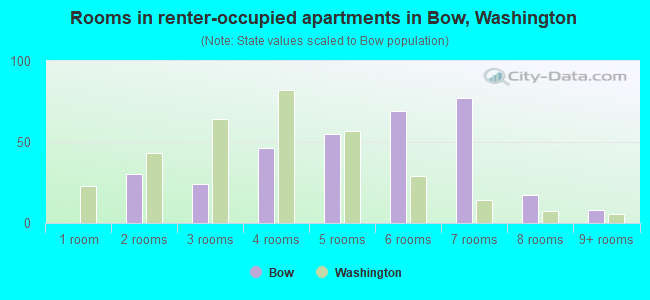
- Rooms in renter-occupied apartments in Bow, Washington
- 01 room
- 302 rooms
- 243 rooms
- 464 rooms
- 555 rooms
- 696 rooms
- 777 rooms
- 178 rooms
- 89+ rooms
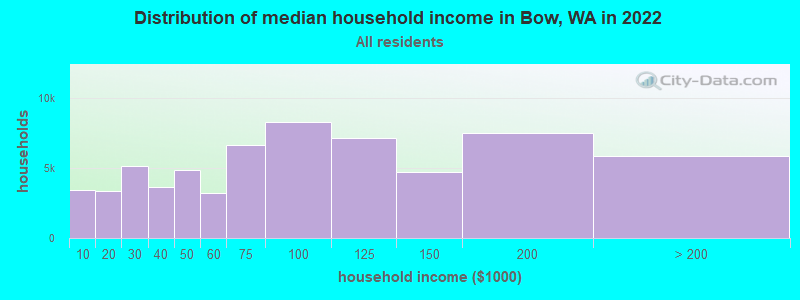
Bow, WA household income distribution

- 3,460Less than $10,000
- 3,323$10,000 to $19,999
- 5,104$20,000 to $29,999
- 3,609$30,000 to $39,999
- 4,833$40,000 to $49,999
- 3,183$50,000 to $59,999
- 6,670$60,000 to $74,999
- 8,277$75,000 to $99,999
- 7,140$100,000 to $124,999
- 4,694$125,000 to $149,999
- 7,507$150,000 to $199,999
- 5,877$200,000 or more
Percentage of workers working in this county: 74.0%
Number of people working at home: 562 (15.8% of all workers)
Travel time to work (commute)
- Less than 5 minutes: 70
- 5 to 9 minutes: 97
- 10 to 14 minutes: 344
- 15 to 19 minutes: 541
- 20 to 24 minutes: 645
- 25 to 29 minutes: 214
- 30 to 34 minutes: 345
- 35 to 39 minutes: 60
- 40 to 44 minutes: 100
- 45 to 59 minutes: 114
- 60 to 89 minutes: 96
- 90 or more minutes: 103
Means of transportation to work:
- Drove a car alone: 2,394 (81.4%)
- Carpooled: 236 (8.0%)
- Bus or trolley bus: 11 (0.4%)
- Walked: 79 (2.7%)
- Other means: 9 (0.3%)
- Worked at home: 213 (7.2%)
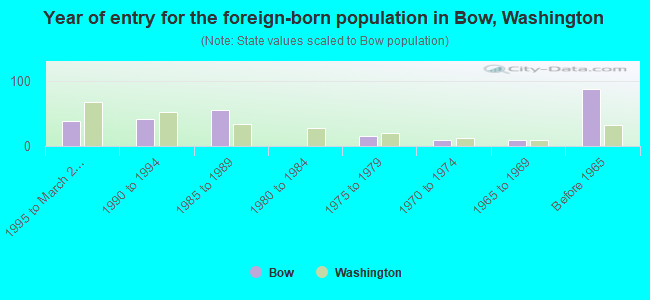
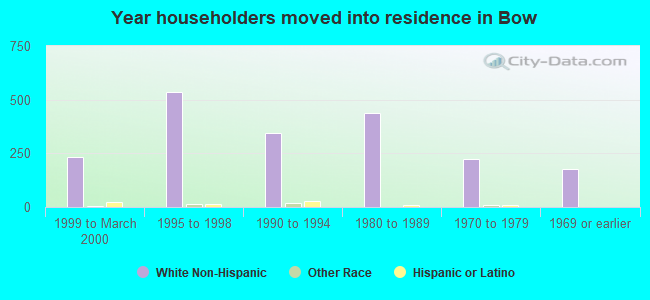
- Year of entry for the foreign-born population in Bow, Washington
- 391995 to March 2000
- 411990 to 1994
- 551985 to 1989
- 01980 to 1984
- 151975 to 1979
- 91970 to 1974
- 91965 to 1969
- 87Before 1965
Most common places of birth for foreign-born residents (%):
| Bow: | 44.3% (113) |
| Washington: | 24.1% (148,115) |
| Bow: | 25.1% (64) |
| Washington: | 7.7% (47,568) |
| Bow: | 6.3% (16) |
| Washington: | 0.6% (3,795) |
| Bow: | 5.9% (15) |
| Washington: | 2.8% (16,936) |
| Bow: | 4.3% (11) |
| Washington: | 3.4% (21,167) |
| Bow: | 4.3% (11) |
| Washington: | 0.4% (2,307) |
| Bow: | 3.5% (9) |
| Washington: | 7.6% (46,733) |
| Bow: | 3.5% (9) |
| Washington: | 0.1% (448) |
| Bow: | 2.7% (7) |
| Washington: | 6.2% (38,172) |
Place of birth for U.S.-born residents:
- This state: 3,260
- Other state: 1,946
- Northeast: 236
- Midwest: 600
- South: 342
- West: 768
66% of Bow residents lived in the same house 5 years ago.
Out of people who lived in different houses, 61% lived in this county.
Out of people who lived in different counties, 68% lived in Washington.
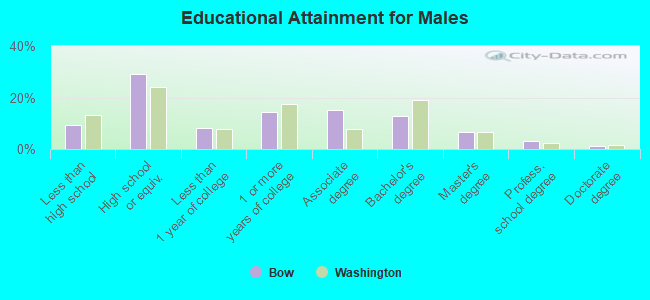
Education attainment for males 25 years and older:
- No schooling: 12
- Nursery to 4th grade: 0
- 5th and 6th grade: 23
- 7th and 8th grade: 35
- 9th grade: 0
- 10th grade: 33
- 11th grade: 8
- 12th grade, no diploma: 62
- High school graduate (or equivalency): 548
- Less than 1 year of college: 150
- Some college more than 1 year, no degree: 270
- Associate degree: 287
- Bachelor's degree: 237
- Master's degree: 127
- Professional school degree: 57
- Doctorate degree: 24
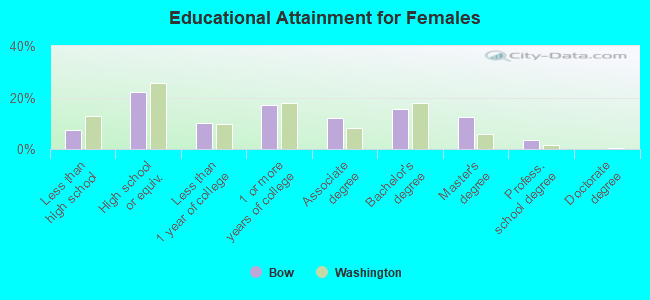
Education attainment for females 25 years and older:
- No schooling: 11
- Nursery to 4th grade: 0
- 5th and 6th grade: 10
- 7th and 8th grade: 29
- 9th grade: 10
- 10th grade: 8
- 11th grade: 23
- 12th grade, no diploma: 39
- High school graduate (or equivalency): 400
- Less than 1 year of college: 178
- Some college more than 1 year, no degree: 308
- Associate degree: 219
- Bachelor's degree: 279
- Master's degree: 223
- Professional school degree: 60
- Doctorate degree: 0
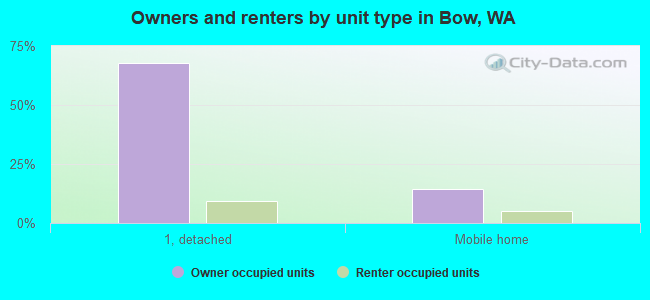
Housing units in structures:
- One, detached: 1,711
- One, attached: 17
- Two: 24
- 3 or 4: 19
- 10 to 19: 8
- Mobile homes: 436
- Boats, RVs, vans, etc.: 40
Median worth of mobile homes: $425,898
Housing units lacking complete kitchen facilities: 2.2%
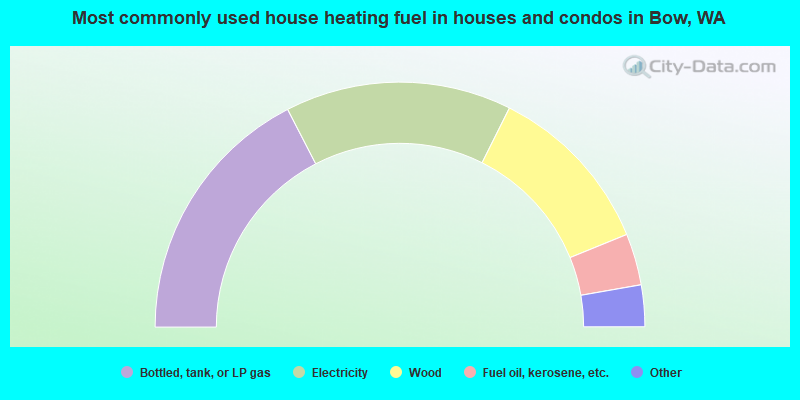
- 34.8%Bottled, tank, or LP gas
- 29.9%Electricity
- 22.9%Wood
- 6.8%Fuel oil, kerosene, etc.
- 3.7%Utility gas
- 1.3%Solar energy
- 0.6%Other fuel
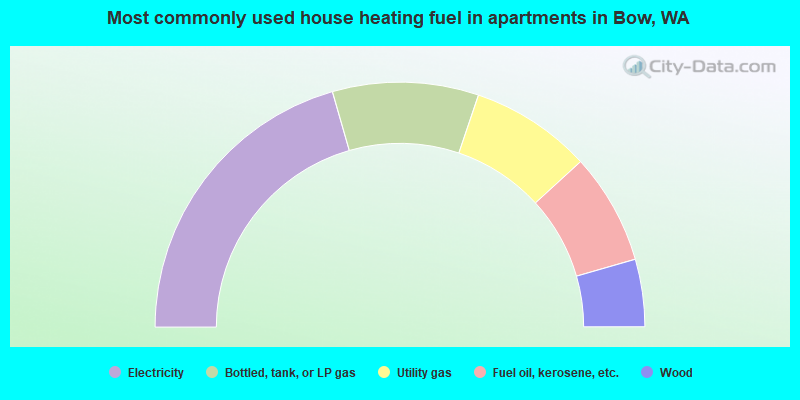
- 41.1%Electricity
- 19.3%Bottled, tank, or LP gas
- 16.0%Utility gas
- 14.7%Fuel oil, kerosene, etc.
- 8.9%Wood
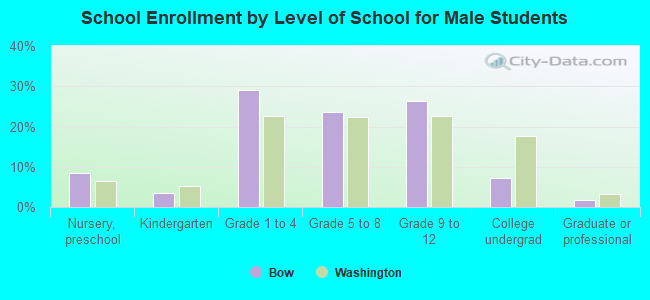
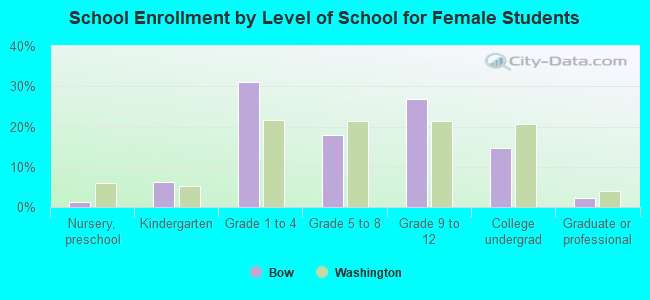
Private vs. public school enrollment:
| Here: | 5.6% |
| Washington: | 9.2% |
| Here: | 1.9% |
| Washington: | 7.0% |
| Here: | 14.8% |
| Washington: | 15.7% |